Thus, hemp straw residues used in the same pilot plant showed lower SGP of biogas and methane probably due to the lignocellulosic composition. SGP and GPR for biogas and methane were higher in the last phase of the experiment (with enzymatic treatment) than the penultimate phase (without enzymes).

Conclusions
Anaerobic digestion of industrial hemp – Effect of harvest time on methane energy yield per hectare. Effects of enzyme addition on biogas production from anaerobic digestion of agricultural biomass. Waste biomass value.
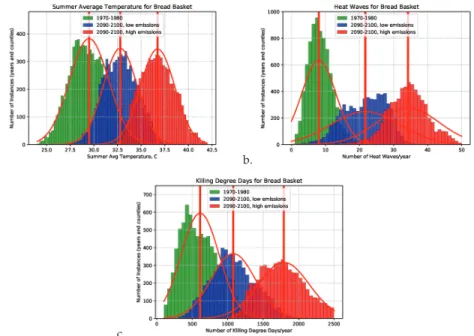
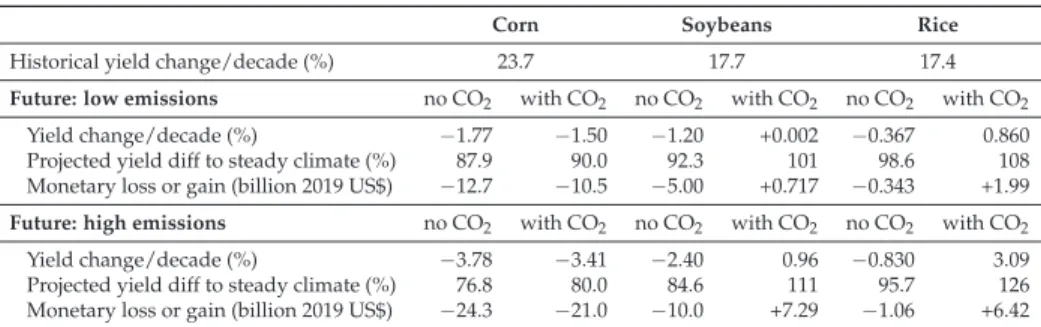
Impact of Climate Change on Twenty-First Century Crop Yields in the U.S
- Introduction
- Methods
- Results
- Discussion
There are many different approaches to identifying the impact of climate change on crop yields. Before accounting for CO2 fertilization, crop yields are expected to decline dramatically in the coming century.
Climate-Smart Agriculture and Non-Agricultural Livelihood Transformation
- Climate-Smart Agriculture in the Western Highlands, Guatemala
- Climate-Smart Agriculture and Poverty Reduction
- Non-Agricultural Livelihood Transformation
- Conclusions
Guatemala is ethnically very diverse, and indigenous groups (who make up almost 40% of the total population) live mainly in the western highlands. Guatemala Will Never Change': Radical Pessimism and the Politics of Self-Interest in the Western Highlands.J.
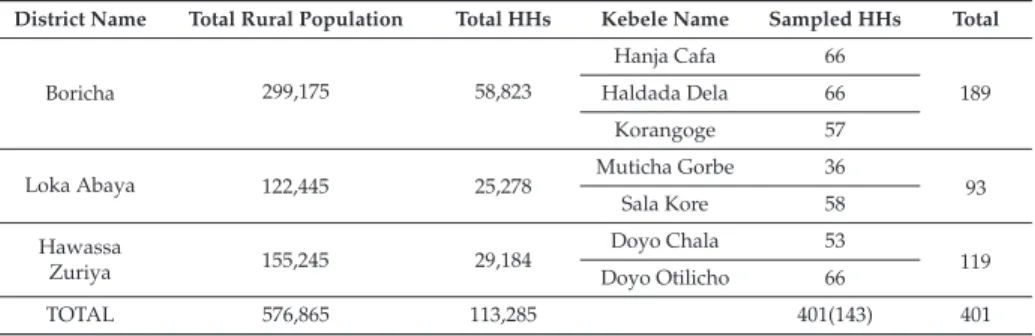
Climate Change-Induced Impacts on Smallholder Farmers in Selected Districts of Sidama,
Southern Ethiopia
Climate Change-Induced Impacts in Ethiopia
Nevertheless, climate change-induced impacts challenge the roles of agriculture for the overall growth of the country [12]. Previous studies have revealed that climate change and variability have had significant impacts on agriculture and overall economic growth in Ethiopia [32,34,35]. Specifically, climate change-induced impacts have hindered the country's economic growth and effort to move out of poverty.
For example, it has been reported that the growth estimates have been reduced by 2–9% due to climate change-induced impacts [ 30 ]. Under the worst-case scenarios, the economic impact of climate change could reduce Ethiopia's GDP by up to 8% [ 36 ]. Overall, with greater vulnerability, and less resilience to climate change-induced impacts, the country is projected to experience a 6% decline in total agricultural output in the coming years [38].
In addition to the impacts on the national economy, the impacts of climate change have affected the health and livelihoods of smallholder farmers in Ethiopia. Food and water shortages caused by climate change affect the health, education and economic status of households [8].
Data and Methods
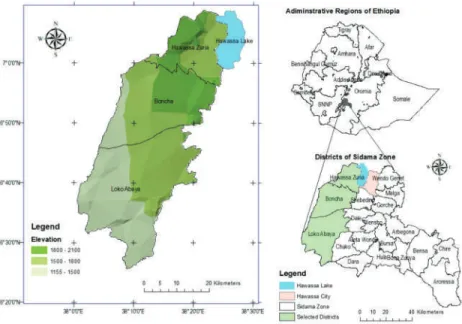
About 80% of the Ethiopian population lives in rural areas making drought-prone agriculture the main means of livelihood. In the 20th century alone, twelve extreme droughts occurred in Ethiopia that hampered the country's economic development. Malaria affects labor availability at the household level and increases household health expenditure.
Variable RF and higher temperatures characterize the districts compared to other districts of the zone. About 97% of the population in these districts live in rural areas where drought-stricken agriculture is their source of livelihood. Agro-pastoral communities dominate the southwestern parts of the study area, where climate-related animal diseases are common.
Considering the deviations of the responses, a 5% probability (19 HHs) gives 401 households, which were selected from the three districts. So, odds are defined for an event with probability and the logit is the log of the odds ie;.
Results and Discussion
The findings of this study nevertheless revealed other climate change-induced impacts that occur repeatedly in the study area. The model revealed that having a member or a position in the 1 to 5 groups affects the probability of exposure to climate change-induced drought. The model also examined the use of agricultural technology and the likelihood of exposure to climate change-induced impacts.
Flooding is one of the climate change-induced impacts experienced by the HHs in the study area. Also, participating in decisions about climate change adaptation affects exposure to climate change-induced flooding (Table 5). In addition, the use of improved animal feed, chemical fertilizers and improved seed diversity also control the likelihood of exposure to climate change-induced hunger.
Climate change and variability-induced impacts are widely available in the study area despite different adaptation strategies by the government and households. Moreover, the supply of agricultural inputs (improved seeds and chemical fertilizers) specifically in drought years increased the likelihood of exposure to climate change-induced impacts.
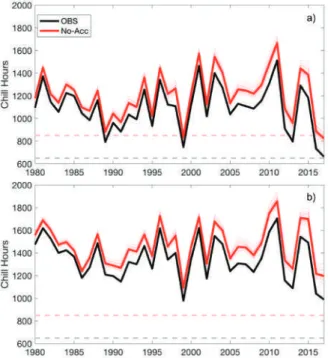
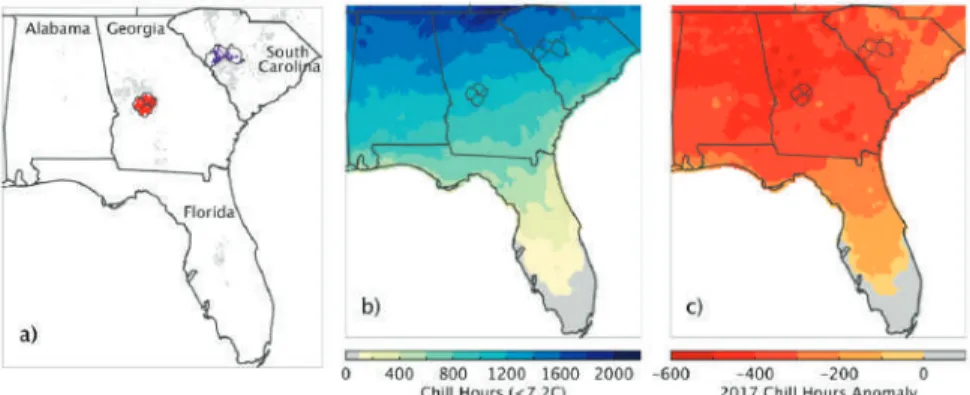
Warming Winters Reduce Chill Accumulation for Peach Production in the Southeastern United States
Materials and Methods
Annual cold accumulation was considered from 1 October to 15 February, as is standard in the SEUS peach industry [33]. Cold accumulation was calculated over the 1981-2017 period using the observational data, and for the counterfactual scenarios using the observed data from 1981-2017 after removing the influence of anthropogenic climate change. The mean cold accumulation for the observed period 1981–2017 over the SEUS ranged from less than 100 h in southern Florida, to more than 2000 h in the Blue Ridge Mountains of northeastern Georgia (Figure 1b).
The observed mean cold accumulation over 1981–2017 was less than that modeled in the absence of anthropogenic climate change, consistent with expectations from modeled warming (Figure 2a). The estimated cold accumulation in 2017 excl. however, the modeled first-order influence of climate change for the peach-growing area of Georgia ranged from ∼760 to. Time series of 1981–2017 cold accumulation for (a) the peach growing region of Georgia and (b) the peach growing region of South Carolina.
Although insufficient cold accumulation is not a major cause of loss for federally insured crops in the SEUS [41,42], previous work has postulated that projected decreases in cold may reduce suitability for perennial crop production [19,43]. Yield potential definition of the cooling requirement shows probable underestimation of the risk of climate change on winter cold accumulation.
Defining Crop–Climate Departure in West Africa
Improved Understanding of the Timing of Future Changes in Crop Suitability
Data and Methods 1. Study Area
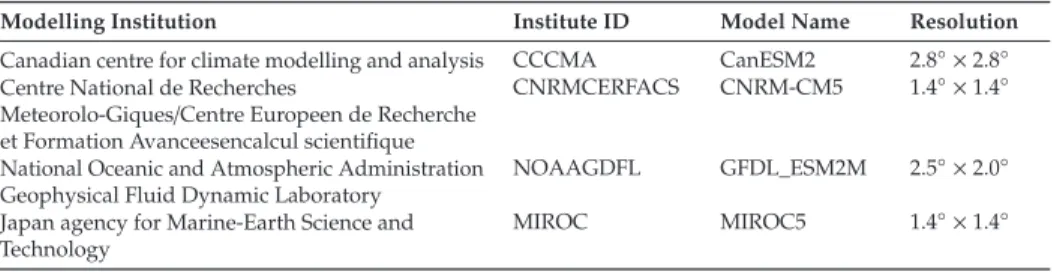
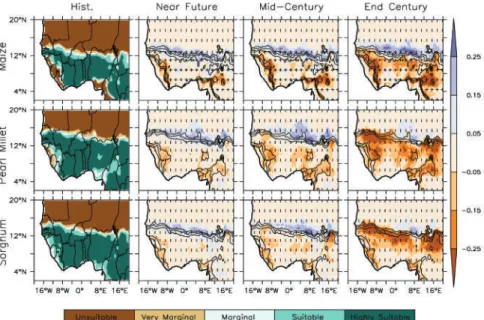
It assessed the suitability of crop growth in the zone for past climate conditions with reference to the published literature. This weak correlation may be due to the low resolution of the GCMs in recording total monthly rainfall in the Guinea zone. Nevertheless, the simulated crop suitability of Eco-GCM is similar across the three AEZs over West Africa for the eight crops considered in the study.
It is unsuitable (Eco-CCMA and CNRM) to marginally suitable (Eco-GFDL and MIROC) for cassava cultivation in the Sahel AEZ. Variability in planting month suitability for cassava crops in response to both AEZ and time increase is observed in the GCMs (Figure 5). The Ecocrop simulations of crop growth suitability for the period 1960–2010 and the crop types evaluated confirm previous findings regarding the type of crop actually grown in the region.
The impact of warming in the future will affect the seasonality of the crop, i.e. the suitability of the planting time. The impact of global warming on the crop–climate relationship in the three West African EEZs varies by crop grown.
![Figure 1. West African topography and the three Food and Agriculture Organizations (FAO)- (FAO)-Agro-ecological zones (AEZs): the Guinea, Savanna, and Sahel zones [25,34].](https://thumb-ap.123doks.com/thumbv2/1libvncom/9200954.0/78.723.142.585.318.616/figure-african-topography-agriculture-organizations-ecological-guinea-savanna.webp)
Summary and Conclusion
Agriculture in West Africa in the twenty-first century: climate change and impact scenarios and options for adaptation. The World Bank. World Development Report 2010: Development and Climate Change; World Bank: Washington, DC, USA, 2010; Available online: https://openknowledge.worldbank.org/handle, accessed 30 November 2018). IPCC, 2001: Climate Change 2001: Impacts, Adaptation and Vulnerability, Contribution of Working Group II to the Third Assessment Report of the Intergovernmental Panel on Climate Change, edited by J.
Climate change impact and potential adaptation strategies under alternative climate scenarios for yam production in the sub-humid savanna zone of West Africa. Moderate. Empirical Approaches for Assessing the Impact of Climate Change on Agriculture: The EcoCrop Model and a Case Study with Grain Sorghum.Agric. Science of the total environment An assessment of yield gains under climate change due to genetic modification of pearl millet. Science.
Contribution of Working Group I to the Fourth Assessment Report of the Intergovernmental Panel on Climate Change; Solomon, S., Qin, D., Manning, M., Chen, Z., Marquis, M., Ave, K.B., Eds.; Cambridge University Press: Cambridge, UK; New York, NY, USA, 2007. Finding Tomorrow's Agriculture Today CGIAR Research Program on Climate Change; Agriculture and Food Security (CCAFS): Copenhagen, Denmark, 2011.
Assessing Future Spatio-Temporal Changes in Crop Suitability and Planting Season over West Africa
Using the Concept of Crop-Climate Departure
Data and Methodology 1. Study Area
The climate of the region is mainly controlled by the West African Monsoon (WAM) which accounts for about 70% of the annual rainfall [24,26]. Some of the main crops cultivated in the region are cassava, groundnuts, millet, maize, sorghum, oilseed, plantain, cocoa, rice, wheat. Other crops such as cocoa and plantain to name a few contribute significantly to the region's economy.
However, the method contributes to the demand for regional-scale assessment of crop response to future climate projections. Past studies (eg have evaluated the performance of historical RCA4 data against the CRU data set in past climate. This gives a level of confidence in the use and performance of the Ecocrop simulation in the region.
We use two conditions (model agreement and statistical significance) to assess the robustness of projected climate change for the next three months. all have used methods to test and demonstrate the robustness of climate change signals.
Result
The projection shows an increase of up to 4.5◦C in southern Guinea (coastal area) and 4◦C in the interior. The projection shows that no change is expected by mid-century in the eastern part of the region. In contrast, an increase in SIV up to 0.2 is expected in the southern Sahel zone for cereals.
The projected increase in SIV ensures an increase in the area suitable for growing both crops. However, a two-month early planting is projected by the end of the century in the southern Sahel region. Similarly, a two-month early planting period for mangoes in the southern Sahel region is projected by mid-century and up to three months by the end of the century.
We suggest that projected changes in temperature could lead to an increase of between 1–4.5◦C in minimum and average temperature over West Africa in the near future to the end of the century. This can help solve the challenge of uncertainty in future simulation of crop suitability and planting season.
Managing New Risks of and Opportunities for the Agricultural Development of West-African
Floodplains: Hydroclimatic Conditions and Implications for Rice Production
Results and Discussion
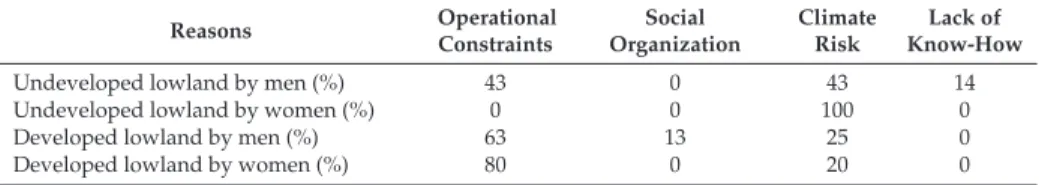
The least consensual perceptions are paradoxically related to the climate or the year's water regime. However, the perception of climate risk varies depending on the gender of the respondents and the level of development of the lowlands (Table 1). An increase in temperature was also observed in the Beninese part of the Niger Basin by Badou et al.
The high values imply a strong performance of the HBV model for the two years of observed discharge. The calibrated and validated HBV model simulated the discharge of the Lofing-Radier River for the period 1971–2018. The results of the Mann-Kendall trend test applied to the discharge statistics are shown in Table2.
There was no significant increase in annual rainfall for the period, however, an increasing delay in the onset of the rainy season (with a decrease in the duration of the pre-wet season) was observed. Comparison of available discharge and irrigation water demand for the 30 ha Lofing inland valley.
MDPI