She is a postdoctoral researcher at the Institute for Plant Ecology in Giessen, Germany and a member of the DASIM research unit. He is Assistant Professor of Soil Science in the UCD Faculty of Agriculture and Food and a Fellow of the UCD Soil Institute.

Greenhouse Gases from Agriculture
Introduction
The main natural sources of CO2 include ocean-atmosphere exchange, animal, soil (microbial respiration) and plant respiration, and volcanic eruption. Important anthropogenic sources of CO2 include the combustion of fossil fuels (coal, natural gas and oil), deforestation and land cultivation, which increases the breakdown of organic matter in the soil and of crop and animal residues (Xu and Shang2016).
Impact of Ammonia on GHG Emissions
A default emission factor defined by the IPCC, known as EF4, can be used to estimate indirect emissions of N2O resulting from the volatilization of NH3 and other nitrogen oxides (NOx) (IPCC2006). Therefore, management options that reduce NH3 volatilization from soil are considered mitigation practices because they reduce indirect N2O emissions (IPCC2014a; Lam et al. 2017).
Aim of the Book
Therefore, measurement of NH3 emission is important to estimate indirect N2O emissions derived from soil amendments, such as urea-based fertilizers, green manures, animal excreta or ammonium-based fertilizers in alkaline soils. NH3 is a reactive N gas that greatly affects the environment through eutrophication and acidification of natural ecosystems as well as human health due to the promotion of particulate formation (Sanz Cobena et al.2014).
Introduction
Information about gas concentration in a soil profile can also be used for gas flux prediction (Chirinda et al. 2014; Kammann et al. 2001). However, in combination with chamber-based techniques, soil profile techniques can provide valuable additional information to explain and analyze GHG emissions from the land surface (Müller et al.2004).
Chamber-Based Methods
- Advantages and Disadvantages of Closed Chamber-Based Methods
- Principles and Applications of Chamber-Based Techniques for Gas Flux Measurement
- Gas Exchange Processes
- Chamber Types
- Chamber Design
- Chamber Operation, Accessories, Evacuation of Exetainers, and Gas Flux Measurement
- Gas Pooling to Address the Spatial Variability of Soil GHG Fluxes
- GHG Measurements in Paddy Rice System
- Analysis of GHG Samples on a Gas Chromatograph (GC)
The homogeneity of the air in the headspace can be compromised in taller chambers (eg >40 cm). However, the vial must not contain traces of the gas to be determined in the gas sample.

Methods to Quantify GHG Production in the Soil Profile
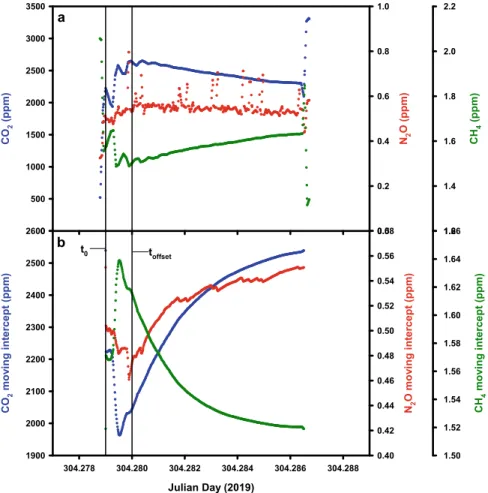
For further reading of the Global Research Alliance paper by Harvey et al. 2020) on gas analysis is recommended. The advantage is that both gas fluxes at the ground surface (if automated chambers are used) together with soil gas concentrations can be monitored in situ at the same time (see Section 3.2.2). A decrease in concentration (CO2, N2O) or increase under subambient conditions (CH4) indicates a contamination with ambient air, which will be corrected via the following regression analysis.
The dynamics of the break of this moving regression shows the time (toffset) when the adjustment period ends (see Fig.2.2b). The concentrations of CO2, CH4 and N2O in the samples are then determined by a linear regression between the peak and the bottom of the sample analysis.

Standard Operating Procedure (SOP) for Gas Flux Measurement
- Field Gears and Equipment Needed for GHG Sampling
- Step-Wise Procedure (SOP) for GHG Measurements
- Gas and Soil Sampling
- Safety Measures for GHG Sampling
Ensure that the metal casing of the chamber base is not damaged by force hammering. Exercise extreme care by covering the room area while applying fertilizer to the main plot of the field. Before placing the chamber on top of the base, fill the base frame with water using a watering can.
Carefully place the chamber on the frame, making sure it sits properly in the water-filled chute. Connect the syringe to the three-way tap on the room (must be an airtight connection).
Calculation of GHG Fluxes .1 Overview
- Calibration
- Calculation of the Gas Concentration and Fluxes
- Conversion from Concentration to Mole
- Data Analysis
For further reading of the Global Research Alliance paper by De Klein et al. For further reading of the Global Research Alliance paper by de Klien et al. For each measurement you will get a separate flux (Fig.2.4), the unit of the gas flux is usually ppm h-1 or mg m-2h-1.
For further reading of the Global Research Alliance paper Venterea et al. 2020) when calculating the current. For further reading of the Global Research Alliance papers by De Klein et al.

Analysis of GHG Samples with Optical Gas Analysers
The light absorption at a specific wavelength, measured as light attenuation by a detector, is proportional to the concentration of a gaseous compound (Hensen et al. 2013; Rapson and Dacres2014). The main optical techniques used for the quantification of GHG are non-dispersive infrared spectroscopy (NDIR), Fourier transform infrared spectroscopy (FTIR), photoacoustic spectroscopy (PAS), tunable laser absorption spectroscopy (TLAS), cavity ring-down spectroscopy . (CRDS), and off-axis integrated cavity output spectroscopy (OA-ICOS) (Werle 2004; Hensen et al. 2013; Peltola et al.2014; Rapson and Dacres2014). Depending on the resolution of the FTIR analyzer, it determines gas concentrations only (low-resolution FTIR) or isotopomers simultaneously (high-resolution FTIR) (Griffith et al.2012; Rapson and Dacres2014).
Acoustic signals are proportional to the gas concentration of the target gas species (Iqbal et al.2013; Rapson and Dacres2014). Laser-based analyzers do not operate with broadband IR radiation, but instead are tuned to the unique absorption line of a specific trace gas (Hensen et al.2013).
Hands-On Approaches Using a CRDS Analyser
- Overview of the CRDS Techniques for Determining GHG Concentrations and Soil Fluxes
- Theory: Near-Infrared Absorption Spectroscopy Fundamentals
- Operational Principle of Cavity Ring-Down Spectroscopy
- Minimum Detectable Flux (MDF)
- Selecting the Appropriate Flow Path
- In-Line Flow Path
- Parallel Flow Path
- Multiple Chambers
- Calibration
- Advanced Application Considerations: Filtration of Gas Samples
- Liquid Water and Water Vapour
- CRDS-Specific Considerations
- Datalogging and Flux Processing
After choosing a specific wavelength range, the concentration of the target gas can be measured by determining the absorption of light. The greater the difference between the two, the less impact the CRDS analyzer will have. The CRDS analyzer connection location should follow the same approach as shown in Fig.2.12 and 2.13.
The concentrations measured by the CRDS analyzer are then compared with the accepted value of the gas cylinder. All concentration data obtained with a CRDS analyzer is automatically stored on the hard drive of the analyzer.

Enhanced Raman Spectroscopy of Greenhouse Gases
- Raman Spectroscopy of Gases
- Enhanced Raman Gas Spectroscopy
- Enhanced Raman Spectroscopic Analysis of Greenhouse Gases
An excellent light-analyte interaction is achieved in fiber-enhanced Raman spectroscopy and a large number of molecules contribute to the Raman signal (Frosch et al.2013b). In conventional Raman spectroscopy, the signal is excited and collected from a small scattering volume (Fig.2.17a) (Frosch et al. 2013b). It was found that pine (Pinus sylvestris) can switch from carbohydrate-dominated respiration to a mixture of substrates during several days of drought stress, but spruce (Picea abies) cannot (Hanf et al.2015b).
Individual respiration rates (both O2 . and CO2) are used to calculate subsequent RQ values (Hanf et al.2015b). Nitrogen evolution was continuously monitored during stepwise enzymatic denitrification of labeled and unlabeled nitrates by Pseudomonas stutzeri (Fig.2.22) (Keiner et al.2015a).

GHG Fluxes from Aquatic Systems
- Determining Dissolved N 2 O Concentrations
- Determining N 2 O Fluxes from a Water Body
- Determining Gas Transfer Velocity (K)
- Models for Determining N 2 O Fluxes from Water Bodies
- Other Factors to Consider
- Determining EF5
Once sampling is complete, the dissolved N2O embodied in the water equilibrates with the gas phase in the headspace of the Exetainer. The value of quarts due to the turbulent mixing of the water body at the water-atmosphere interface. If the water body is large, the chamber can be attached to a boat, with a slack line, while both float in the current (Beaulieu et al.2012).
Also dissolved in the water is an inert chemical tracer that can be used to estimate the flow rate and dilution of the stream. Such changes have implications for the N cycle, and thus for the amount of N2O dissolved in the water.
Indirect GHG Emissions–Ammonia Emissions
- A Simple Low-Cost Chamber to Quantify NH 3 Volatilisation
In addition, a significant part of the errors in NH3 volatilization measurements can be reduced if it is ensured that the amounts of fertilizers applied in the relative. Amount of urea in the chamber area=256.11 mg urea (2.35) The NH3 trapping foams in the "plastic bottle" chamber must be replaced periodically during the measurement period. Conversely, when the goal is to estimate only the total amount of NH3-N loss, the intervals of foam replacement can be increased, but not more than 5 days (Araújo et al.2009).
To extract NH4+ from foams, the contents of the plastic containers (foam+solution) are transferred to an Erlenmeyer flask and then deionized water (40 ml) is added to extract NH4+. An example table to illustrate the calculation for converting N concentration in extraction solutions to total NH3-N loss per hectare is detailed in Table 2.7.
Gas Production Processes in Terrestrial Ecosystems
De Wilde HPJ, De Bie MJM (2000) Nitric oxide in the Scheldt estuary: production by nitrification and emission to the atmosphere. Hensen A, Skiba U, Famulari D (2013) Low cost and state-of-the-art methods to measure nitrogen oxide emissions. Jacinthe P-A, Dick WA (1996) Use of silicon tubes to sample nitrous oxide in the earth's atmosphere.
Outram FN, Hiscock KM (2012) Indirect emissions of nitric oxide from surface water bodies in a lowland agricultural catchment: an important contribution to agricultural greenhouse gas budgets. Smith KA (2017) Changing perspectives on nitrogen oxide emissions from agricultural soils: key control processes and assessment at different spatial scales.
Automated Laboratory and Field Techniques to Determine Greenhouse
Automated Laboratory Techniques
- Technical Challenges
- System 1
- Measurements of Gas Samples
- Possible Sample Containers
- Semi-automated Determination of Nitrate and Nitrite
- Application of the Automated Incubation System to Determine Denitrification Kinetics
- System 2
- The GC
- The NO Analyser
- Leaks, Carryover, and Dilution of Headspace by Sampling
- Software
- Data Handling and Analysis
- Documentation
A Y-cable (custom-made; Autosampler Guys, Alexandria, VA, USA) is used to enable the gas chromatograph to control both the incubation system and the A/D converter of the nitric oxide analyzer. The outlet of the PDHID is connected to the CLD inside the nitrogen oxide analyzer. After placing the vials in the temperature-controlled tray holders of the incubation system, the gas chromatographic analysis begins.
The described robotic gas analysis system is an improved version of the system described by Molstad et al. This description of the robotic incubation system was modified from a technical report (Molstad et al. 2016) available on Researchgate.

Automated Chamber Systems for Field Measurements .1 Field Techniques Using GC Systems
- Combination of Automatic Chamber System and CRDS Analyser for Field GHG Flux Measurements
For further reading of the Global Research Alliance paper by Grace et al. 2020) on automated techniques. In the LI-COR control software, LI-8100A, the total gas volume in the system (chamber, tubes, internal analyzer tubes, water trap) must be determined for correct flow calculations. The LI-8100A software can be used to control the valve system of the Multiplexer and the measurement sequence of 16 automated chambers.
It is important to synchronize the IRGA and Picarra system clocks frequently (daily-weekly); otherwise, the SoilFluxPro software cannot properly match the LI-COR and Picarro data sets for flux calculations. Matching LI-COR and Picarro datasets in SoilFluxPro software is also explained in the application note (Licor2016).
Micrometeorological Methods for Greenhouse Gas Measurement
- Introduction
- Flux-Gradient Method
- Aerodynamic Method
- Bowen Ratio (Energy Balance Method)
- Eddy Correlation Approach
- Alternative Micrometeorological Methods .1 Eddy Accumulation
- Mass Balance Technique
- Non-isotopic Tracer Release and Measurement Methods
With the exception of the mass balance method (see below), micrometeorological methods are based on the assumption that the GHG flux to or from the surface is identical to the vertical flux measured at the reference level at some distance above the surface (Eugster and Merbold2015). . In addition, the turbulent flux is proportional to the product of a vortex diffusion coefficient and the mean vertical concentration gradient of the gas. The Bowen ratio (energy balance) and the aerodynamic techniques are two of the more popular methods of calculating vertical fluxes.
In addition, the correction of the trace gas density with respect to water vapor and heat transfer is required. Baldocchi D (2014) Measuring fluxes of trace gases and energy between ecosystems and the atmosphere-the state and future of the eddy covariance method.
Direct and Indirect Effects of Soil Fauna, Fungi and Plants on Greenhouse Gas
Greenhouse Gases from Soil Fauna .1 Introduction
- Overview of Fauna on GHG Emissions
- Carbon Dioxide (CO 2 )
- Methane (CH 4 )
- Nitrous Oxide (N 2 O)
- Field Methodology
Spatial clustering of soil fauna can result in increased spatial variability of soil CO2 emissions due to the creation of point sources of CO2 (Ohashi et al. 2007). Epigeic earthworms live and feed mainly in the bedding area above the mineral soil (Horn et al. 2006). However, the impact of earthworms on functional soil bacterial communities remains unclear (Chapuis-Lardy et al. 2010).
Chambers can also be used to directly measure net GHG fluxes using clusters of soil fauna such as dunghills or termite mounds (Penttilä et al. 2013; Jamali et al. 2011a,b). This information can reveal which of the earthworm species is most active in digesting plant material residues (Giannopoulos et al. 2010).

Greenhouse Gases from Fungi and Plants