Inquiries about the use of the book should be directed to INTECH rights and permissions department ([email protected]). The publisher accepts no responsibility for any damage or injury to persons or property resulting from the use of any materials, instructions, methods or ideas contained in the book.
Introduction
Energy security is therefore crucial for the future of the manufacturing industry and provides a significant incentive to reduce consumption levels. A case study to demonstrate the applicability of the developed EM procedure for the manufacturing level of business strategy.
Review of Existing EM Techniques
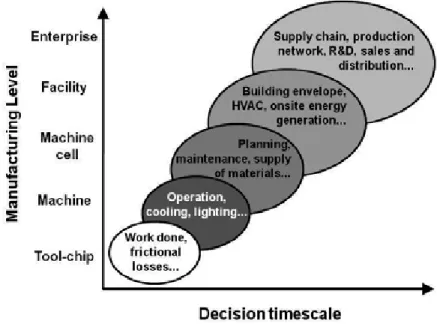
- Energy Research on an Enterprise Level
- Energy Research on a Facility Level
- Energy Research at the Machine Cell Level
- Energy Research Associated with Production Machines and Equipment
- Energy Research on the Turret Level (Theoretical Process Energy)
Integration of the optimization of energy consumption of processes as part of the process selection algorithm in a process planning program is also possible as and has been demonstrated [23]. Since the energy efficiency of the system is highly part-specific, a KERS must be tailored.
An Overview of the Current Scope of EM
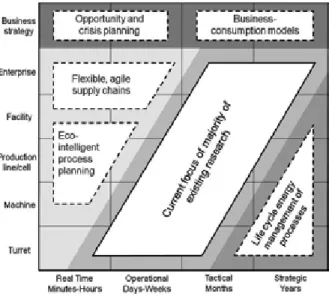
Lifecycle Process System Planning
Therefore, a large number of lifecycle process planning tools are required to help manufacturers manage their process requirements over the long term. Lifecycle process EM must consider flexible, reconfigurable process chains, peripheral energy requirements (refrigeration, transport systems, etc.) and plant layout to ensure the most appropriate.
Eco-Intelligent Manufacturing and Agile Supply Chains
Recently, as with products, manufacturers have begun to take a life-cycle view not only of their factories, but also of the processes within the factories [47]. Therefore, the planning of the life cycle process is highly dependent on a company's ability to map the roadmap of the sector in which it operates.
Energy Management at the Business Strategy Level
EM techniques are required to assess the different effects of the two strategies so that effective EM decisions can be made. Of crucial importance is sufficient insight into the impact of the business strategy on energy consumption.
A Case Study for EM Method at the Business Strategy Level
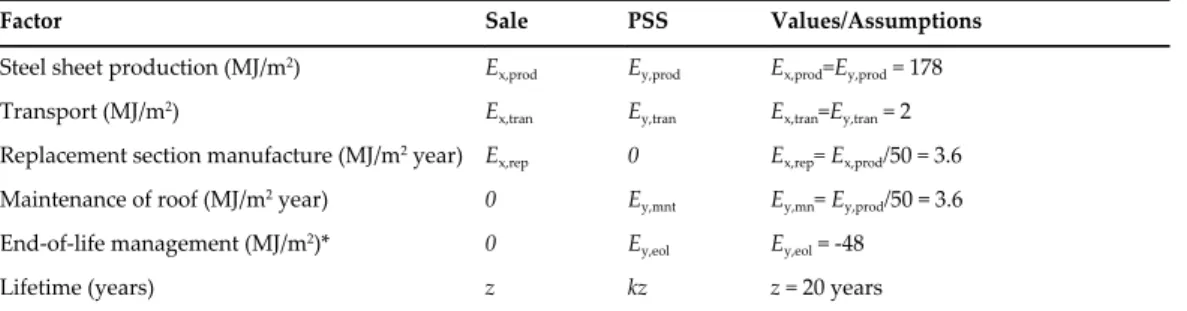
The longer the lifespan of the product in relation to the energy consumption, the more energy-efficient the production of the product. The incentive to extend the life of the product by the manufacturer means that extra care may be taken in the maintenance of the roof covering, at the expense of Ey,mnt.
Concluding Discussions
If the manufacturer encourages recycling of the material, they can justify that any energy benefit is offset against their manufacturing energy consumption. It therefore stands to reason that approaches to EM for business strategies should take into account the energy consumption over which the manufacturer has direct control over the product's life cycle.
Author details
These new strategies are developed with economic benefit as a primary focus, but it is also important for production. Crucially at the business strategy level, there is no requirement for detailed energy data that is difficult to obtain at a planning stage.
Requirements for electrical energy for a production process, Proceedings of CIRP International Conference on Life Cycle Engineering. Improving Energy Efficiency in Factories - Case Studies and Guidance, 16th CIRP International Conference on Life Cycle Engi‐.
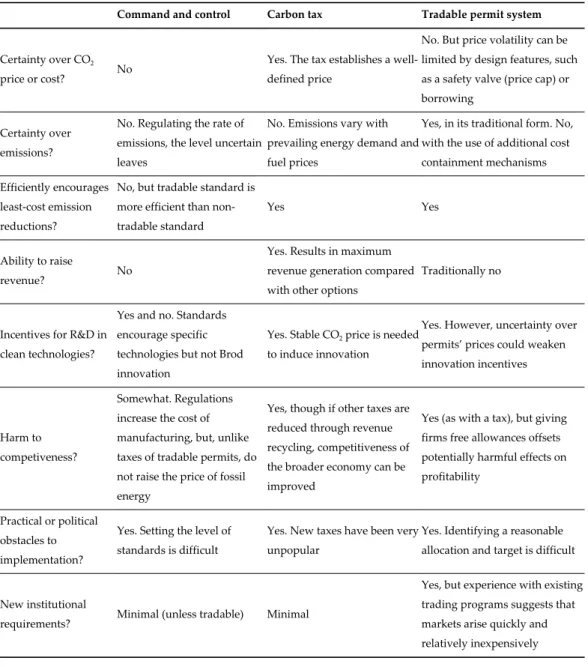
The Choice between Economic Policies to Face Greenhouse Consequences
- The traditional issue of the choice of environmental policies
- Carbon tax versus tradable permit system
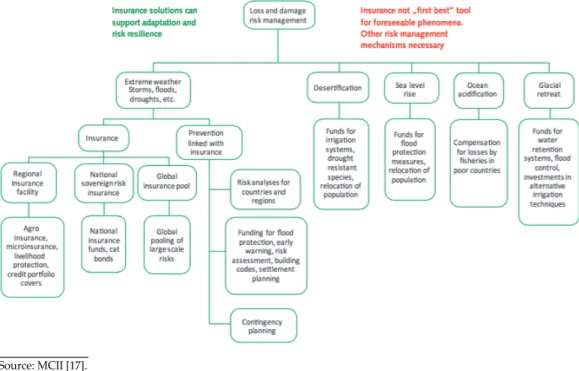
- Insurance as an environmental policy instrument
- Policies choice in the case of climate change and the concept of “economic global public goods”
- Final remarks: COP 21 and the issue of the linkage of different national policies
The insurance sector could play a relevant role in the choice of political-economic instruments for climate change. Policy choice in the case of climate change and the concept of “economic global public goods” global public goods”.
Energy for Sustainable Development: The Energy–
Poverty–Climate Nexus
- The Problems
- The Energy–Poverty Nexus
- The Energy–Climate Nexus
- The Poverty–Climate Nexus
- Potential Solutions
- Solar Power
- Wind Power
- Clean Biomass
- Micro-Hydro
- Hybrid Systems
- What Now? Next Steps
- Summary
Off-grid and mini-grid options for renewable electricity include solar, wind, clean biomass and micro-hydro. Development of renewable energy and sustainability for off-grid rural areas in developing countries and energy efficiency.
![Table 1. Number of people lacking access to electricity and relying on the traditional use of biomass for cooking, 2009 (million) [2]](https://thumb-ap.123doks.com/thumbv2/1libvncom/9200944.0/51.765.89.675.204.425/number-lacking-electricity-relying-traditional-biomass-cooking-million.webp)
Native Forest and Climate Change — The Role of the Subtropical Forest, Potentials, and Threats
Deforestation, fragmentation, and climate change
Therefore, changes in the biomass, including decomposition – although it is a hardly measurable phenomenon [10] – will affect the character of the soil. Variations in land cover are one of the natural and anthropogenic forces that act at different scales and influence changes in regional and global climates.
Climate change in Argentina
A better understanding of biomass and carbon stocks in forests therefore provides valuable information for spatial planning and the design of comprehensive strategies in the context of global climate change. This information is also needed to improve understanding of biomass and carbon distribution patterns at the global level and to describe land use patterns.
Materials and methods
- The Yungas ecosystem: Pedemontana Jungle
- Case studies
- Sampling design
- Estimation of biomass and carbon
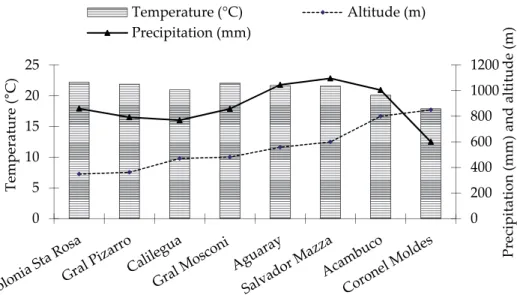
The fragmentation of the Pedemontana jungle generates microclimate changes at the edges, which can affect carbon sequestration. The methodology used for each of the case studies presented in the next section shows some differences which are summarized in Table 1.
Results and discussion
- Effect of temperature and humidity on the carbon stock: dry and humid subtropical forests at the same latitude
- Effect of legal protection on the ecosystem
- Effect of fragmentation on the carbon stock Contributors: Manrique, S.M
Soil temperature (ST) is one of the most stable variables, although variations can be discerned: considering 100% at the edge (18°C on average) it is reduced to 25% in the interior. The studied species represent approximately 86-90% of the total in the case of forest (by plot).
Main remarks
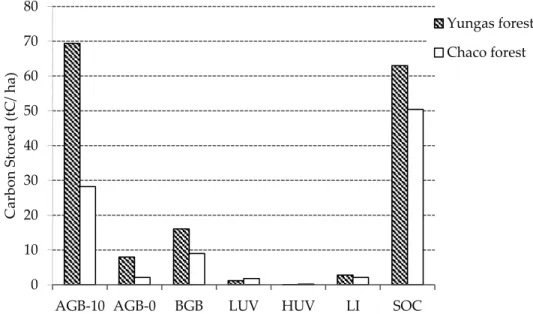
Furthermore, the carbon sequestration potential of the Pedemontan jungle increases as latitude decreases, with 28% more carbon sequestered at 22° than 24°S latitude. Carbon sequestration in the least human-impacted (degradation) sectors of the Pedemontan jungle is 23% higher than in more degraded areas.
Acknowledgements
At the same time, deforestation, degradation and fragmentation of the Pedemontana jungle can affect its ecological and social integrity, and the ability to provide ecosystem services of provision and regulation in the long term, and therefore its ability to respond to the global impact of climate change. The consequences of this imbalance in handling are shown negatively in the medium and long term, while in the short term they cannot be seen most of the time.
Greenhouse Gas Emissions – Carbon Capture, Storage and Utilisation
CO 2 capture
There are several technologies and strategies to capture CO2 from stationary sources: pre-combustion, post-combustion and oxygen gas (Figure 2). There are several technologies and strategies for capturing CO2 from stationary sources: pre-combustion, post-combustion and oxy-fuel (Figure 2).
First generation of capture technologies
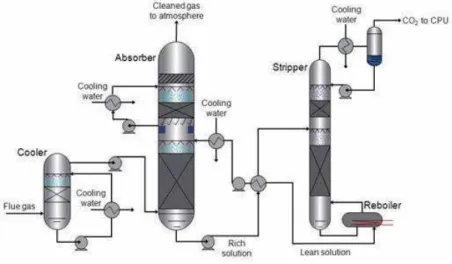
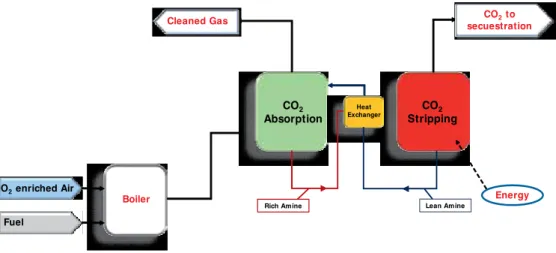
- Post-combustion capture
- Chemical absorption from amines
- Pre-combustion capture
- Oxy-combustion capture
Carbon capture and storage (CCS) is likely to be a crucial part of the lowest-cost path to decarbonisation. Carbon capture and storage (CCS) is likely to be a crucial part of the lowest-cost path to removal.
Emerging technologies for CO 2 capture
- Chemical looping combustion
- Hydrate-based separation
- Calcium looping
- Partial oxy-combustion
- Biological CO 2 capture
- Ionic liquid absorption
This separation approach is based on hydrate formation from high-pressure water in contact with flue gas containing CO2. Calcium binding is based on the reversible reaction between CaO and CO2 to form calcium carbonate.
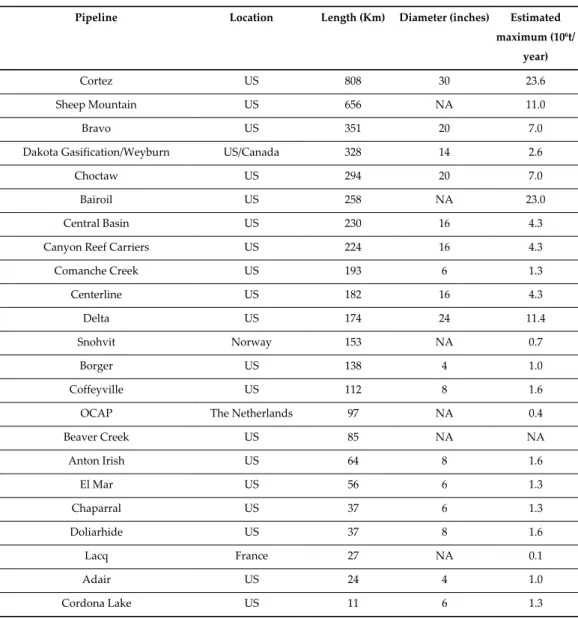
CO 2 transport
A new hybrid concept is proposed to reduce the energy requirements associated with the CO2 capture step by combining a partial combustion of fuel with oxygen (using oxygen-enriched air instead of high-purity oxygen as the oxidant) and a CO2 separation process that treats a flue gas with a higher CO2. The use of algae is also considered a promising CO2 capture option among natural reactions.
CO 2 storage
- Depleted hydrocarbon fields
- Deep saline aquifers
- Coal seams
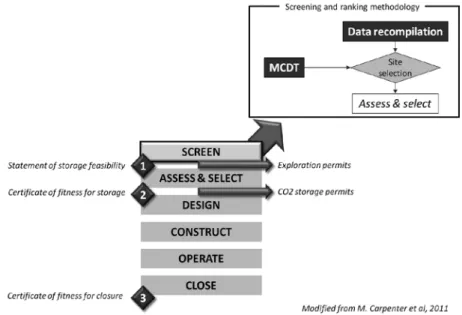
- Site selection and exploration
Coal properties (range, grade and permeability) determine the suitability of the site, either for storage or storage with only CH4 recovery. In general, most of the areas that could be suitable for the storage of CO2 have not been well explored geologically.
Monitoring techniques
The wells will provide real information on the storage and formation of the cap under subsurface conditions. Considering the injection phase, controlling the injected CO2 behavior is one of the most important tasks.
CO 2 uses
- Current uses of CO 2
- Direct use of CO 2
- Water treatment
- Use of CO 2 in chemicals
- Chemical conversion
Chemical cleaning with CO2 is one of the most popular applications of supercritical fluids in the textile sector. Currently, 95% of microalgae production is based on open systems (raceways or round open ponds).
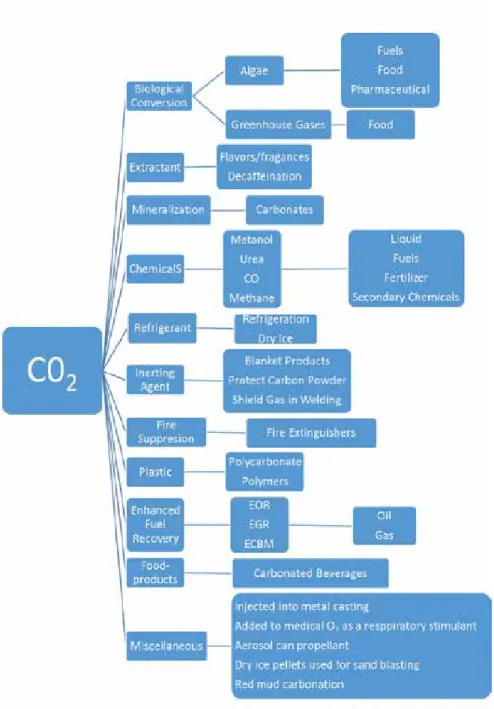
New ways for CO 2 uses
- Power to gas technology (P2G)
- Electrochemical CO 2 utilisation
- Polymers production
- Macrofouling control in industrial facilities
In the "Dream Production" project, Bayer MaterialScience (Germany) combines part of the waste streams of coal-fired power plants, CO2, with the production of polymers. A project developed by Iberdrola and the University of Salamanca shows that carbon dioxide acidification is only in

Others
Over the years, several projects have focused on the direct use of flue gases from combined cycle power plants to develop various applications. In this way, the CENIT SOST-CO2 project demonstrated the use of CCPP flue gases in a direct way for pH control in cooling tower cooling water systems, and Iberdrola developed an application for power plants.
Environmental problem and CO 2 emissions
The major challenges facing these green technologies lie in the difficulty for implementation on an industrial scale, which makes them economically unfeasible compared to fossil fuel-based power plants. In the pre-combustion capture scenario, the fossil fuel is treated under certain temperature and pressure to gasify the fuel and produce hydrogen.
Existing technologies for CO 2 capture
The discovery of new fossil fuel reserves, combined with a rising demand for energy, has led to an increase in the number and capacity of power plants worldwide. In this chapter, a large section will be devoted to the incorporation of ILs into the pores of MOFs to improve their CO2 capture capacity.
CO 2 capture using solid sorbents
- Criteria for the evaluation of solid sorbents
- Zeolites
- Carbon-based CO 2 capture
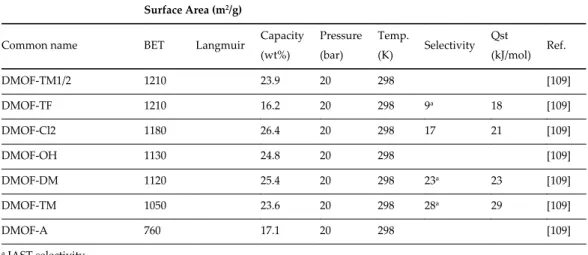
- Metal organic frameworks
In particular, stability in the presence of water vapor is essential for the sustainable performance of a solid sorbent. This finding highlights the detrimental effect of the presence of water vapor on CO2 adsorption on zeolites.
Graphite-based capture has recently (after 2011) been introduced as a promising candidate for CO2 capture applications, and research is growing rapidly in this area [73–77]. The following section is devoted to the review of the most recent studies of CO2 capture and separation on MOFs, and we will mainly target the works published in the last four years.
- Evaluation of MOFs in CO 2 Capture
- Strategies to Improve the CO 2 Capture Performance on MOFs
In addition to the nature of the metal junctions, the method of activation was found to play a vital role in determining CO2 uptake and CO2 affinity, which was consistent with Llewellyn et al. Moreover, the introduction of functional groups on the metal faces before the framework synthesis can interfere with the formation of the building units, which can result in the deterioration of the crystal structure [183–185].
Recent Advances and Current Trends
- Hybrid Systems Based on MOFs
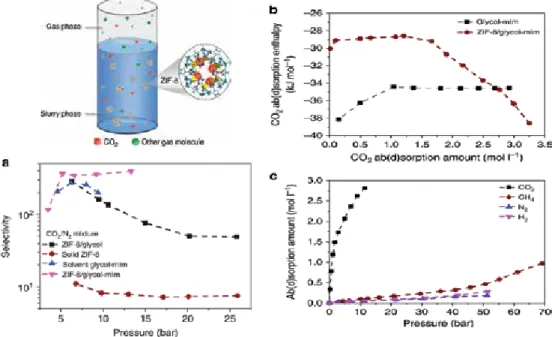
- Ionic Liquids/MOF Composites
- Ab/Adsorption in Ionic Liquids/MOF Slurry System
Pyridine was also grafted onto Ni-DOBDC to improve water stability and increase the hydrophobicity of the material [196]. Increasing ZIF-8 loads have shown further improvement in CO2 capacity as previously observed [225]; however, it is worth noting that a high solids load in the sludge system was not recommended from a process engineering point of view, as it could cause problems during the pumping of the sludge mixture and increase the solids losses in the multi-cycle separation process [225].
Challenges and Outlook
- Water Stability of MOFs
Finally, in the following section, we focus on the studies of water stability as it is one of the main drawbacks of MOFs. 231] conducted a study on the effects of organic ligand functionalization in a series of isostructural MOFs in the Zn(BDC-X)-(DABCO) 0.5 family on water stability.
Carbon Dioxide Geological Storage (CGS) – Current Status and Opportunities
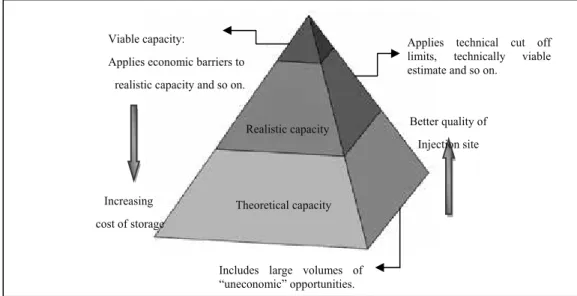
CGS: Storage Capacity
- Estimation techniques in depleted oil and gas reservoir
- Estimation techniques in saline aquifers
- Estimation techniques in coal beds
According to the estimation of CO2 storage capacity studied by Bachu et al., based on a summary of the Carbon Sequestration Leadership Forum (CSLF), different time frames and field scales are considered, taking into account different capture mechanisms (physical and chemical mechanisms) [26]. It should be noted that the other methods used in saline reservoirs can be used here for the estimation of CO2 storage volume: 'volumetric-based estimation'.
CGS: Modeling and Simulation
According to the CGS simulation methods, there have been some comparative investigations between the different simulators, as reported by David et al. GholamiY., et al., in 2015, also investigated the measurement of CO2 diffusivity in synthetic and saline aquifer solutions at reservoir conditions with an emphasis on the role of ion interactions [114-117].
CGS: Monitoring and Verification
Another 2/3-dimensional simulation study focusing on reactive flow and transport in deep saline aquifers has been performed by Kumar et al. Additional features based on Law et al., such as coal matrix swelling, mixed gas diffusion, non-isothermal effect, water motion, etc., should be considered [103].
Conclusions
95] Xu T., Apps J.A., et al.: Numerical simulation of CO2 deposition by mineral trapping in deep aquifers. 132] Hovorka S.D., Benson S.M. et al.: Measuring the sustainability of CO2 storage in saline formations: the Frio experience.
Methane Emissions from Rice Production in the United States — A Review
- The greenhouse effect
- Greenhouse gas emissions
- Rice production
- Rice production extent
- Global rice production practices
- Rice production practices in the US
- Arkansas rice production practices
- Flooded soils
- Physical characteristics of flooded soils
- Soil redox potential
- Methane emissions from rice
- Methane production and oxidation
- Substrate for methane production
- Duration and timing of methane production
- Transport mechanisms
- Factors affecting methane emissions from rice
- Soil factors affecting methane emissions from rice
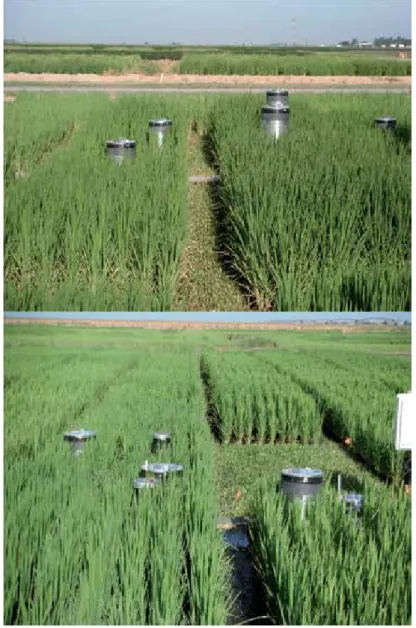
Arkansas was responsible for 36% of estimated CH4 emissions from rice cultivation, although Arkansas accounted for 43% of total US rice production in 2013. China and India currently dominate global rice production accounting for 30 and 22%, respectively, of total global production in 2012.
![Figure 1. Total primary energy supply of resource by 1993, 2011 and 2020 (data from [2])](https://thumb-ap.123doks.com/thumbv2/1libvncom/9200944.0/11.765.159.594.398.650/figure-total-primary-energy-supply-resource-data.webp)
![Figure 4. Machining energy use breakdown for a 1988 Cincinnati Milacron automated milling machine with a 6.0 kW spindle motor [35].](https://thumb-ap.123doks.com/thumbv2/1libvncom/9200944.0/18.765.187.581.568.911/figure-machining-breakdown-cincinnati-milacron-automated-milling-machine.webp)