An IPCC Special Report on the impact of global warming of 1.5°C above pre-industrial levels and related global greenhouse gas emission pathways, in the context of strengthening the global response to the threat of climate change, sustainable development, and efforts to eradicate poverty [Masson-Delmotte, V., P.
Preface
Scope of the Report
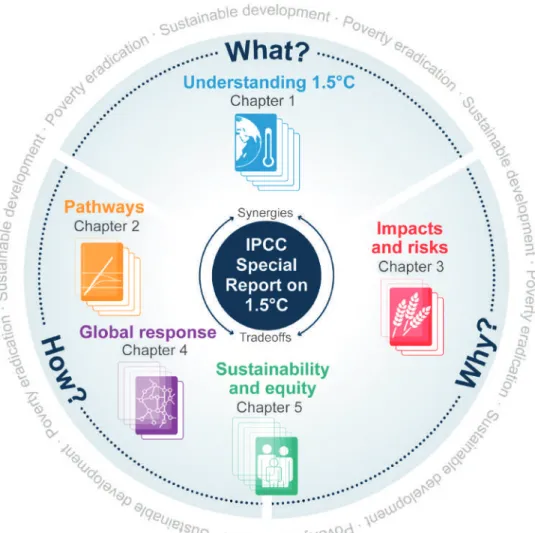
Structure of the Report
The chapter also examines the synergies and trade-offs of adaptation and mitigation options with sustainable development and the SDGs and provides insights into possible pathways, particularly climate sustainable development pathways to a 1.5°C warmer world.
The Process
Acknowledgements
Finally, special thanks go to the technical support units of the working group, whose tireless dedication, expertise and enthusiasm guided the preparation of this Special Report. We gratefully acknowledge the collegial and collaborative support provided by Marlies Craig, Andrew Okem, Jan Petzold, Melinda Tignor and Nora Weyer of the WGII Technical Support Unit and Bhushan Kankal, Suvadip.
Summary for Policymakers
Summary
Introduction
Understanding Global Warming of 1.5°C 4
Many land and sea ecosystems and some of the services they provide have already changed as a result of global warming (high confidence). In total, they are greater if global warming exceeds 1.5 °C before returning to that level by 2100 than if global warming gradually stabilizes at 1.5 °C, especially if the peak temperature is high (eg around 2 °C) (high confidence).
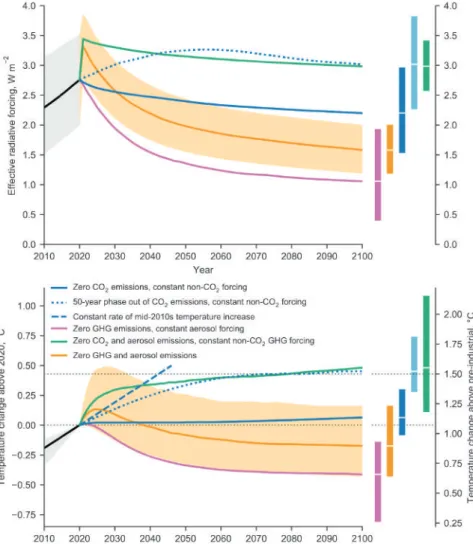
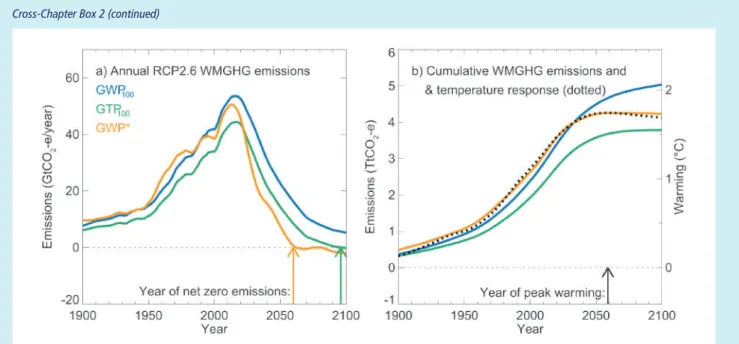
Cumulative emissions of CO2 and future non-CO2 radiative forcing determine the probability of limiting warming to 1.5°C
Projected Climate Change, Potential Impacts and Associated Risks
- Limiting global warming to 1.5°C compared to 2°C is projected to reduce increases in ocean temperature as well as associated increases in ocean acidity and decreases in ocean oxygen levels
- Most adaptation needs will be lower for global warming of 1.5°C compared to 2°C (high confidence)
Heavy precipitation associated with tropical cyclones is expected to be higher at 2°C compared to 1.5°C global warming (average confidence). Aggregate on a global scale, heavy precipitation is expected to be higher at 2°C than at 1.5°C global warming (average confidence).
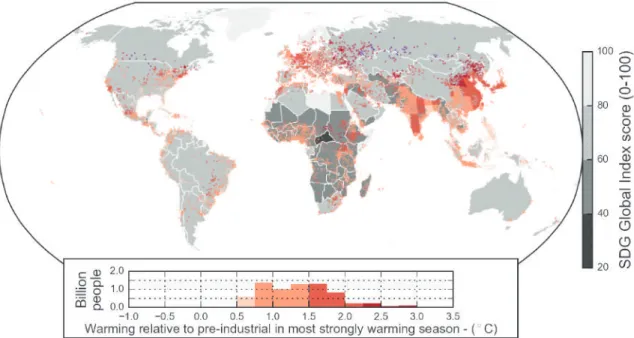
How the level of global warming affects impacts and/or risks associated with the Reasons for Concern (RFCs) and selected natural, managed and
Emission Pathways and System Transitions Consistent with 1.5°C Global Warming
Non-CO2 emissions in pathways that limit global warming to 1.5°C show deep reductions similar to those in pathways that limit warming to 2°C. Emissions of non-CO2 enhancers are also reduced or limited in pathways that limit global warming to 1.5°C with no or limited excess, but they do not reach zero globally.
Global emissions pathway characteristics
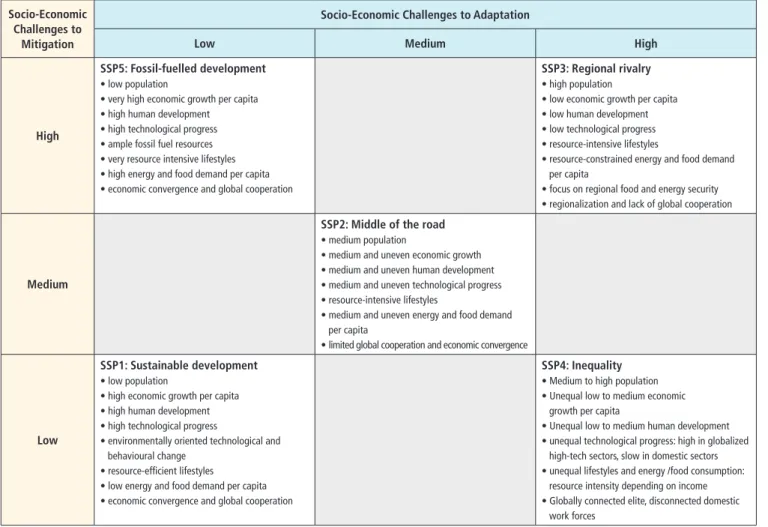
P3: A middle scenario in which social as well as technological development follows historical patterns. Emissions reductions are mainly achieved by changing the way in which energy and products are produced, and to a lesser extent by reducing demand.
Characteristics of four illustrative model pathways
Pathways limiting global warming to 1.5°C with no or limited overshoot would require rapid and far-reaching transitions in energy, land, urban and infrastructure (including transport and
In pathways that limit global warming to 1.5°C with no or limited overshoot, the electricity share of energy demand in buildings will be around 55–75%. 17 Including two pathways limiting warming to 1.5°C with no or limited overshoot and four pathways with higher overshoot.
Strengthening the Global Response in the Context of Sustainable Development and Efforts to Eradicate Poverty
- Estimates of the global emissions outcome of current nationally stated mitigation ambitions as submitted under the Paris Agreement would lead to global greenhouse gas emissions 18 in 2030
- The avoided climate change impacts on sustainable development, eradication of poverty and reducing inequalities would be greater if global warming were limited to 1.5°C rather than 2°C, if mitigation
- Adaptation options specific to national contexts, if carefully selected together with enabling conditions, will have benefits for sustainable development and poverty reduction with global
These trade-offs can be reduced through adjustments that include attention to poverty and sustainable development (high confidence). Indicative links between mitigation options and sustainable development using the SDGs (links do not show costs and benefits).
Indicative linkages between mitigation options and sustainable development using SDGs (The linkages do not show costs and benefits)
Limiting the risks from global warming of 1.5°C in the context of sustainable development and poverty eradication implies system transitions that can be enabled by an increase of adaptation
Estimates of the cost of adaptation may turn out lower at 1.5°C than at 2°C. Public acceptability may enable or hinder the implementation of policies and measures to limit global warming to 1.5°C and adapt to its impacts.
Technical Summary
TS Technical Summary TS
TS.1 Framing and Context
Feasibility is considered in this report as the capacity of a system as a whole to achieve a particular result. This framework also emphasizes the global interconnectedness of past, present and future human-environment relationships, highlighting the need and opportunity for integrated responses to achieve the goals of the Paris Agreement.
TS.2 Mitigation Pathways Compatible with 1.5°C in the Context of
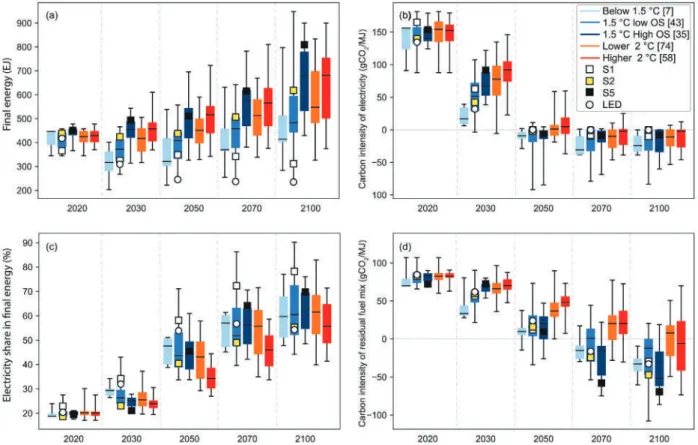
Limiting warming to 1.5°C implies reaching net zero CO2 emissions globally around 2050 and simultaneous deep reductions in non-CO2 power plant emissions, especially methane (high confidence). Energy characteristics and land transitions in 1.5°C pathways The share of primary energy from renewables increases while coal consumption decreases across pathways limiting warming to 1.5°C with no or limited exceedance (high confidence).
TS.3 Impacts of 1.5ºC Global Warming on Natural and Human Systems
Heavy precipitation associated with tropical cyclones is expected to be higher at 2°C compared to 1.5°C of global warming (medium confidence). The risk of water scarcity is expected to be greater at 2°C than at 1.5°C of global warming in some regions (medium confidence).
TS.4 Strengthening and Implementing the Global Response
The energy system transition that would be required to limit global warming to 1.5°C above pre-industrial conditions is underway in many sectors and regions around the world (moderate evidence, high agreement). The speed of transition and technological change required to limit warming to 1.5°C above pre-industrial levels has been observed in the past within specific sectors and technologies {4.2.2.1}.
TS.5 Sustainable Development, Poverty Eradication and Reducing Inequalities
The design of the mitigation portfolio and policy instruments to limit warming to 1.5°C will largely determine the overall synergies and trade-offs between mitigation and sustainable development (very high confidence). Addressing challenges and expanding opportunities between and within countries and communities would be necessary to achieve sustainable development and limit warming to 1.5°C, without making the poor and disadvantaged worse off (high confidence).
Chapters
Framing and Context
1Executive Summary
This report focuses on 'climate-resilient development pathways', which aim to achieve the goals of sustainable development, including climate adaptation and mitigation, poverty reduction and inequality reduction. This report draws on traditional evidence of the physical climate system and associated impacts and vulnerabilities of climate change, together with knowledge derived from perceptions of risk and experiences with climate impacts and governance systems.
11.1 Assessing the Knowledge Base
Equity and a 1.5°C Warmer World
Equity is a longstanding principle within international law and climate change law in particular (Shelton, 2008; Bodansky et al., 2017). The AR5 describes equity as three dimensions: intergenerational (equity between generations), international (equity between states) and national (equity between individuals) (Fleurbaey et al., 2014).
Eradication of Poverty
Human rights include internationally accepted norms that align with the Paris ambitions of poverty eradication, sustainable development and vulnerability reduction (Caney, 2010; Fleurbaey et al., 2014; OHCHR, 2015). Any comparison between 1.5°C and higher levels of warming implies risk assessments and value judgments and cannot be directly reduced to a cost-benefit analysis (Kolstad et al., 2014).
Sustainable Development and a 1.5°C Warmer World
Another asymmetry concerns differential impact: the worst impacts tend to be on those least responsible for the problem, within countries, between countries and between generations (Fleurbaey et al., 2014; Shue, 2014; . Ionesco et al., 2016). Fourth, there is asymmetry in future response capacity: some countries, groups and places are at risk of being left behind as the world moves towards a low-carbon economy (Fleurbaey et al., 2014; Shue, 2014; Humphreys, 2017).
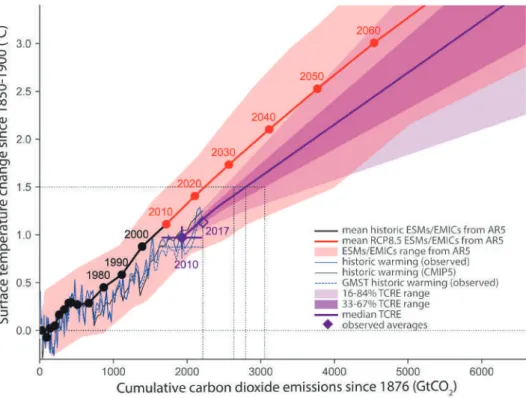
Understanding 1.5°C: Reference Levels, Probability, Transience,
- Working Definitions of 1.5°C and 2°C Warming Relative to Pre-Industrial Levels
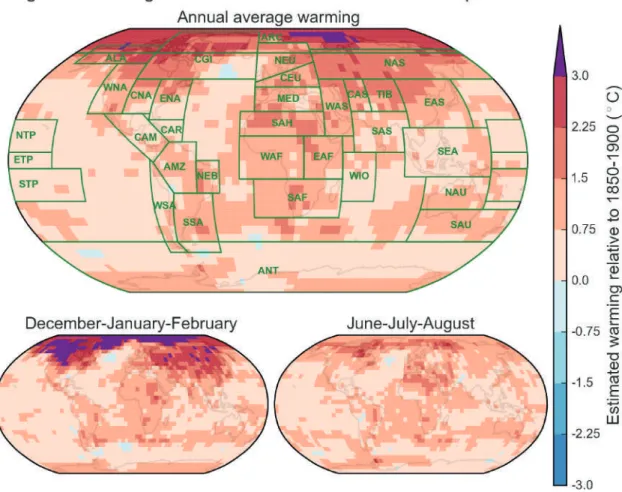
- Global versus Regional and Seasonal Warming Warming is not observed or expected to be spatially or seasonally
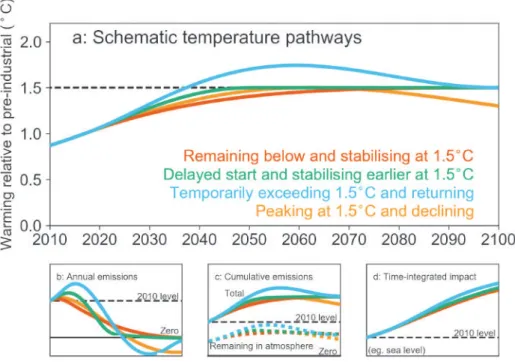
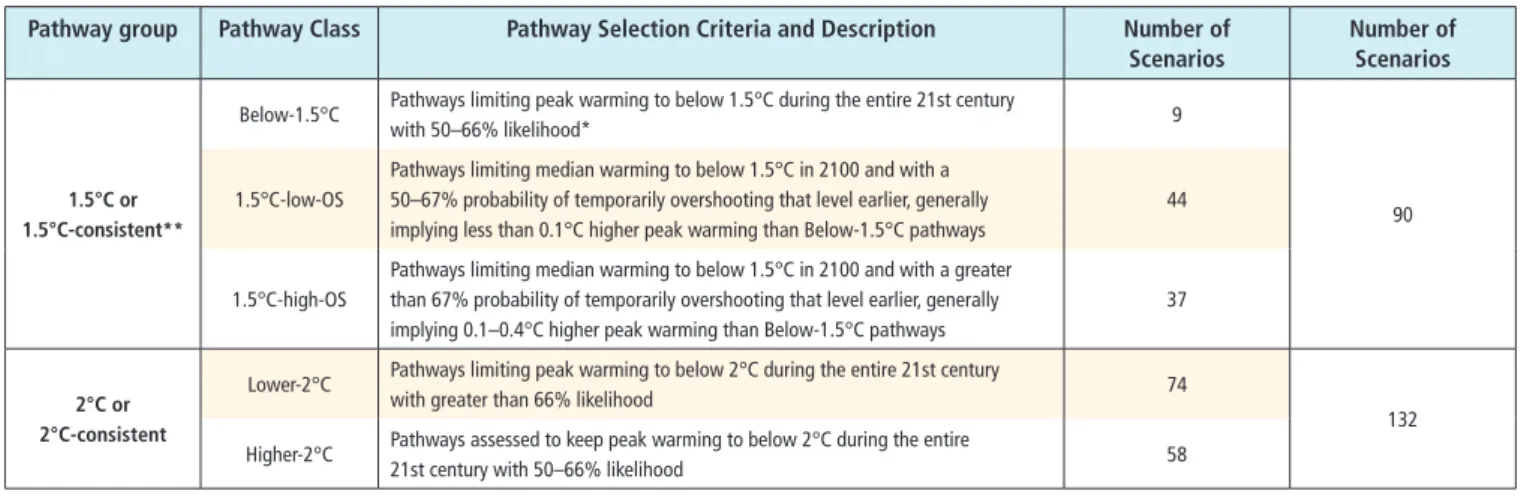
- Definition of 1.5°C Pathways: Probability, Transience, Stabilization and Overshoot
- Geophysical Warming Commitment
The definition of regions (green boxes and labels in upper panel) was adopted from the AR5 (Christensen et al., 2013). This is only the case in the most ambitious scenarios for non-CO2 mitigation (Leach et al., 2018).
Impacts at 1.5°C and Beyond
- Definitions
- Drivers of Impacts
- Uncertainty and Non-Linearity of Impacts
Some impacts depend on atmospheric composition, increasing atmospheric carbon dioxide levels leading to changes in plant productivity (Forkel et al., 2016), but also ocean acidification (Hoegh-Guldberg et al., 2007). For example, the impacts of 1.5°C overshoot and stabilization at a later stage compared to stabilization at 1.5°C without overshoot may differ in magnitude (Schleussner et al., 2016).
Strengthening the Global Response
- Classifying Response Options
- Governance, Implementation and Policies
- Transformation, Transformation Pathways, and Transition: Evaluating Trade-Offs and
Diversity and flexibility in implementation choices exist for adaptation, mitigation (including carbon dioxide removal, CDR) and remedial measures (such as solar radiation modification, SRM), and a potential for trade-offs and synergies between these choices and sustainable development (IPCC, 2014d; Olsson et al., 2014). The IPCC has weaved the concept of sustainable development into recent assessments, showing how climate change can undermine sustainable development, and the synergies between sustainable development and responses to climate change (Denton et al., 2014).
Assessment Frameworks and Emerging Methodologies that Integrate Climate
- Knowledge Sources and Evidence Used in the Report
- Assessment Frameworks and Methodologies Climate models and associated simulations
With important exceptions, such as China, published knowledge from the most vulnerable parts of the world to climate change is limited (Czerniewicz et al., 2017). The challenge is that a society's perception of loss from the effects of climate change is an area that requires further research (Tschakert et al., 2017).
11.6 Confidence, Uncertainty and Risk
Storyline of the Report
Positive and negative effects of adaptation and mitigation measures and trajectories for a 1.5°C warmer world are investigated.
Why are we Talking about 1.5°C?
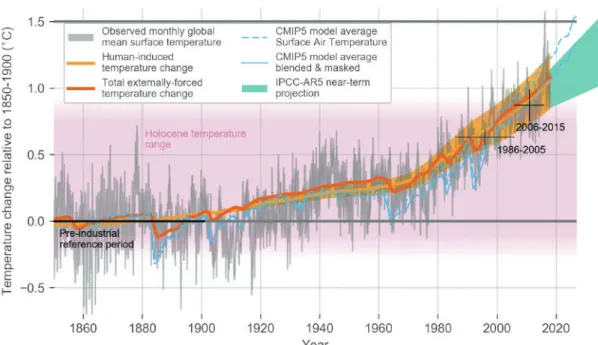
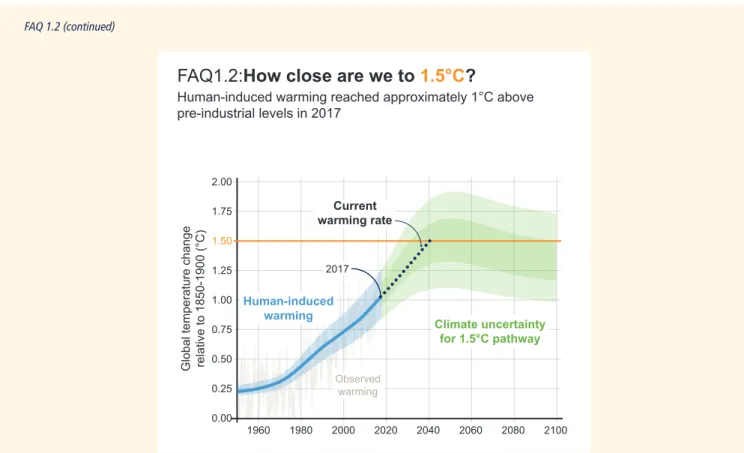
How Close are we to 1.5°C?
Contribution of Working Group I to the Fourth Assessment Report of the Intergovernmental Panel on Climate Change [Solomon, S., D. Contribution of Working Group I to the Fifth Assessment Report of the Intergovernmental Panel on Climate Change [Stocker, T.F., D.
A Special Report of Working Groups I and II of the Intergovernmental Panel on Climate Change (IPCC) [Field, C.B., V.R. Contribution of Working Group III to the Third Assessment Report of the Intergovernmental Panel on Climate Change [B.
Mitigation Pathways Compatible with 1.5°C
What Kind of Pathways Limit Warming
2Executive Summary
Introduction to Mitigation Pathways and the Sustainable Development Context
- Mitigation Pathways Consistent with 1.5°C
- The Use of Scenarios
- New Scenario Information since AR5
- Utility of Integrated Assessment Models (IAMs) in the Context of this Report
The AR5 also relied on such studies, which were mainly discussed in Chapter 6 of Working Group III (WGIII) (Clarke et al., 2014). AR5 found that sectoral 2°C decarbonisation strategies of IAMs were consistent with sector-specific studies (Clarke et al., 2014).
Geophysical Relationships and Constraints
- Geophysical Characteristics of Mitigation Pathways This section employs the pathway classification introduced in Section
- The Remaining 1.5°C Carbon Budget .1 Carbon budget estimates
Uncertainty about climate sensitivity affects future projections and estimates of the carbon budget (Schneider et al., 2017). Their findings are based on an older understanding of Earth system feedbacks (Arneth et al., 2010).
Overview of 1.5°C Mitigation Pathways
- Range of Assumptions Underlying 1.5°C Pathways Earlier assessments have highlighted that there is no single pathway to
- Key Characteristics of 1.5°C Pathways
- Emissions Evolution in 1.5°C Pathways
- CDR in 1.5°C Pathways
- Implications of Near-Term Action in 1.5°C Pathways Less CO 2 emission reductions in the near term would require steeper
This figure implies 1.5 °C-consistent pathways that must remain within even stricter emission limits (Rogelj et al., 2018). They include three 1.5 °C-consistent pathways based on SSP (Rogelj et al., 2018): a sustainability-oriented scenario (S1 based on SSP1), developed with the AIM model (Fujimori, 2017), fossil fuel intensive.
Disentangling the Whole-System Transformation
- Energy System Transformation
- Energy Supply
- Energy End-Use Sectors
- Land-Use Transitions and Changes in the Agricultural Sector
A global study (Stevanović et al., 2017) reported similar GHG reduction potential for both production-side (agricultural production measures in combination with reduced deforestation) and consumption-side (diet change in combination with lower share of food waste) measures in the order of 40% in 210011 (compared to a baseline mitigation scenario without land-based reduction). Variations in these drivers can lead to drastically different land use implications (Popp et al., 2014b) (Figure 2.24).
Challenges, Opportunities and Co-Impacts of Transformative Mitigation Pathways
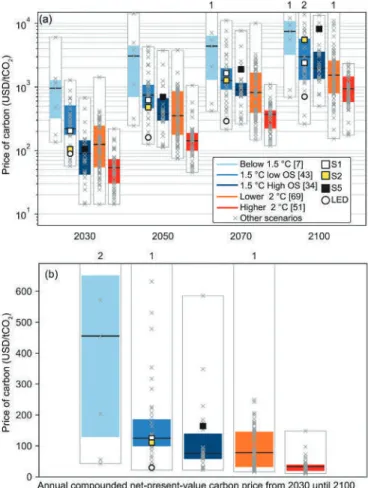
- Policy Frameworks and Enabling Conditions Moving from a 2°C to a 1.5°C pathway implies bold integrated policies
- Economic and Investment Implications of 1.5°C Pathways
- Sustainable Development Features of 1.5°C Pathways
The carbon price is also sensitive to the unavailability of BECCS (Bauer et al., 2018). Making the transition to a 1.5°C world would require a major shift in investment patterns (McCollum et al., 2018).
Knowledge Gaps
- Geophysical Understanding
- Integrated Assessment Approaches
- Carbon Dioxide Removal (CDR)
At the same time, the literature on climate-SDG interactions is still an emerging field of research and therefore there is low to medium confidence in the precise magnitude of the majority of these. The IAMs used in this report do not account for climate impacts (Section 2.1), and similarly, none of the Gross Domestic Product (GDP) projections in the mitigation pathway literature assessed in this chapter included the feedback of climate damage on economic growth (Section 2.3).
What Kind of Pathways Limit Warming to 1.5°C and are we on Track?
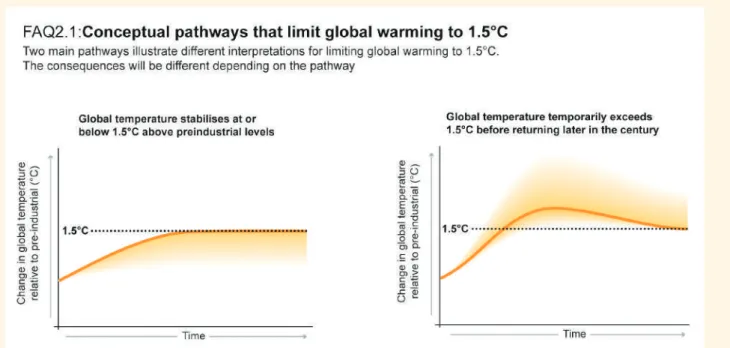
Temperatures shown are relative to pre-industrial but paths are illustrative only, demonstrating conceptual not quantitative features.
Impacts of 1.5°C
Natural and Human Systems
3Executive Summary
About the Chapter
With few exceptions, the focus here is on the analysis of transient responses at 1.5°C and 2°C of global warming, in some cases also assessing simulations of short-term stabilization scenarios (Section 3.2). Economic benefits that would be achieved (Section 3.5.3), climate change 'hotspots' that could be avoided or mitigated (Section 3.5.4 based on the assessments of Sections 3.3, 3.4 and 3.5) and tipping points that could be circumvented (Section 3.5.5) at 1.5 °C compared to higher rates of global warming are all examined.
How are Risks at 1.5°C and Higher Levels of Global Warming Higher Levels of Global Warming
- How are Changes in Climate and Weather at 1.5°C versus Higher Levels of Warming Assessed?versus Higher Levels of Warming Assessed?
The section is primarily globally focused due to limited research on regional risks and adaptation options to 1.5°C and 2°C. Although there is increasing documentation of climate-related impacts in places where indigenous peoples live and where subsistence communities are found, the corresponding projections of the risks associated with 1.5°C and 2°C warming are necessarily limited.