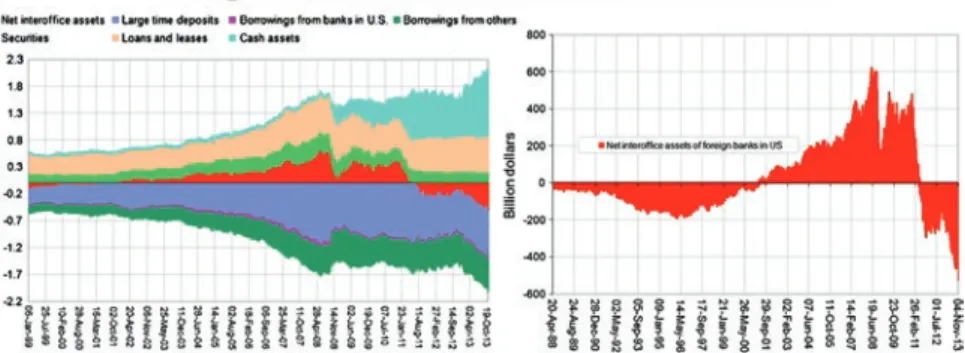
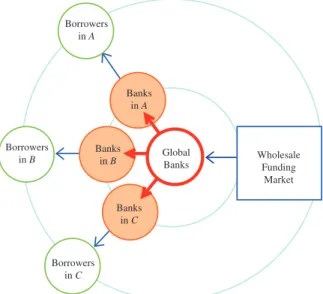
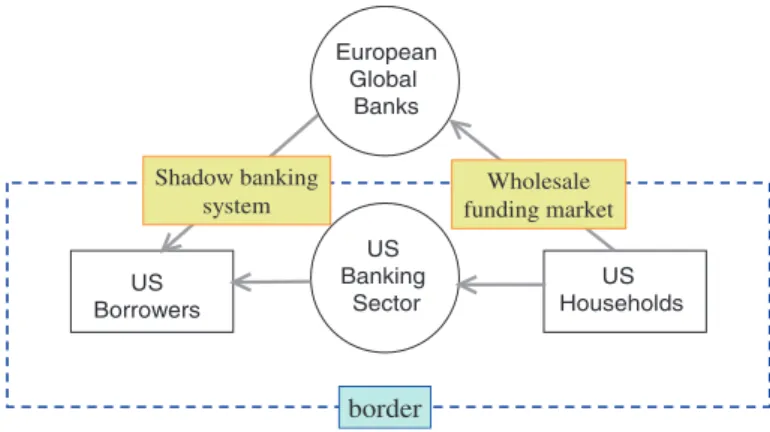
We can gain additional insights into the nature of gross capital flows through the banking system by tracking interbank claims from foreign banks operating in the US. Banks with access to the US dollar funding market through US money market funds channel funding from US financial markets to banks in other parts of the world (referred to as Regions A, B, and C). The interconnected nature of the global banking system creates spillover effects of financial conditions across borders.
The global factors that motivate the decisions of the world's banks will, through the institutional structure of the global banking system, determine credit conditions in all locations. As noted earlier, the net interbank assets of foreign banks in the US rose sharply before reversing at the height of the Eurozone crisis in 2011. The net interbank assets of foreign banks in the US therefore reflect the extent to which global banks are engaged in supplying funds to US dollars to other parts of the world.
Thus, the enabling conditions of liquidity in the US dollar wholesale market will be transmitted through the global banking system to other parts of the world.
Exchange Rates and Leverage
Consider the example of a foreign bank branch that lends in dollars to local borrowers, which converts the proceeds of the dollar loan into LCY—perhaps to hedge the currency risk of long-term export receivables or to engage in outright speculation that the LCY will rise further. In this situation, an initial appreciation of the recipient economy's currency will strengthen the balance sheets of domestic borrowers who borrowed in dollars. A reinforcing mechanism exists through which greater bank risk-taking reduces credit risk, which drives even greater bank risk-taking and further appreciation of the domestic currency, thus completing the circle.
In this environment, an appreciating local currency may not have the purported effect of reducing capital inflows. The rising phase of the cycle will give the appearance of a virtuous circle, in which the mutually reinforcing effect of real appreciation and improved balance sheets work together. The rapid growth of a banking sector, fueled by capital inflows and a rising currency, has been a classic early warning indicator of emerging economy crises.
Once the currency has appreciated sufficiently, investors responsible for the capital inflow will recognize the change in the risk-return configuration and will therefore delay their investment. Indeed, the standard prescription of the official sector still follows a lexicographic sequence in which the real exchange rate must be allowed to appreciate sufficiently, and all the domestic macroeconomic policy responses must be exhausted before (and as a last resort) the implementation of measures to stem capital inflows directly. Domestic distortions can account for both capital inflows and exchange rate appreciation.
Currency appreciation and strong profitability, along with calm economic conditions, may be seen by banks as a signal to further expand lending, leading to further capital inflows. Therefore, the fundamental philosophical divide is between those who believe and do not believe that real appreciation eventually stifles capital inflows due to a reassessment of the attractiveness of the destination currency. Members of the first camp (the traditional view) believe that capital flows are driven by textbook portfolio investors who are guided by fundamental valuations of currency values, while members of the second camp believe that capital flows are driven not only by valuations fundamental values, but also from the short-term imperatives of the bank's balance sheet capacity—and what Borio and Disyatat (2011) refer to as.
Second Phase of Global Liquidity
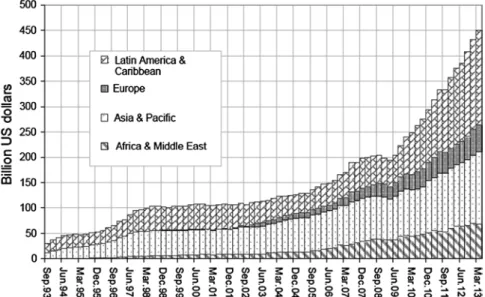
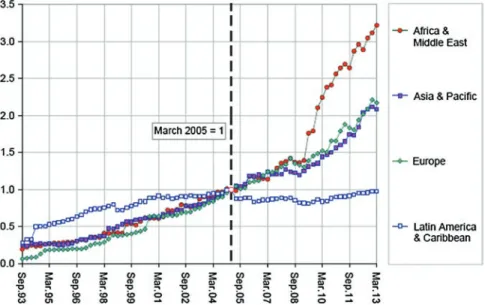
Corporate borrowers in emerging economies have increased their total international securities lending from less than $200 billion in the wake of the Lehman crisis to $450 billion in March 2013. If the proceeds of the borrowing are sent to headquarters through a capital account transaction, traditional balance of payments accounts would show a net capital inflow in the form of larger external liabilities from the head office to its overseas subsidiary. Drawing on the discussion in Azis and Shin (2013), it helps to illustrate the second phase of global liquidity and the importance of emerging market debt securities as the channel for emerging market borrowers to access global capital markets.
In the case of non-banking banks, the growth in the net issuance of international debt securities was even more dramatic. The international debt securities numbers are based on the nationality of the borrower rather than the usual practice of sorting by residence (the reason "external" is in quotation marks). If a corporate borrower in an emerging market issues corporate bonds through its overseas branch – say in London – the normal balance of payments (domiciled) definition would treat the bonds as a liability of a UK entity.
Thus, it would be important to consider the consolidated balance sheet in explaining the behavior of the emerging market company, taking into account the debt securities issued offshore to reconstruct the total assets and liabilities of the decision-making unit. . Billion dollars Non-banks (international . debt securities) Non-banks (External loan obligations) Banks (International debt securities) Banks (External loan obligations). As mentioned earlier, the May 2013 "faint tantrum" and the January 2014 emerging market crisis posed the problem of reconciling the small net external debt positions of many emerging economies (measured in ordinary terms of residence ) with the seemingly disproportionate impact of targeting and then initiating tighter global monetary conditions in their currencies and financial markets.
Intercompany accounts will keep track of the subsidiary's claims on headquarters, but the accumulation of claims may occur through the day-to-day operations of the company rather than an explicit financial transaction classified as capital inflow on the balance of payments. As before, the difference between nationality and residence series accounts for the offshore issuance of international debt securities. 2013) highlight the relevance of monetary aggregates as a potential indicator of the channel through which offshore issuance by emerging market firms can affect domestic financial conditions.
The Case of Emerging Asia
The benefit of accountability measures comes from the role NFCs play at the border. Also, non-core liabilities such as foreign loans tend to be more procyclical during booms. Note Data includes gross capital inflows for Indonesia, Japan, the Republic of Korea, the Philippines and Thailand.
Notes Data include gross capital inflows and outflows for Indonesia, Japan, the Republic of Korea, the Philippines and Thailand, calculated as a year-on-year change based on a 4-quarter rolling sum. In the Republic of Korea and Singapore, for example, bank liabilities tend to grow faster when US federal funds rates are low, indicating that US monetary policy has important effects on the leverage of banks in Asia. in progress. Above the impact of foreign bank interoffice assets in the US, bank liabilities in many Asian economies respond positively to US cross-border loans, and elasticities are higher for non-core liabilities.
However, the impact of non-nuclear liabilities appears highly non-linear and heterogeneous across different crisis episodes. On the asset side, loan-to-value ratios can rise rapidly due to excessive credit expansion and other forms of risky investment, while an increase in non-core liabilities through bank-led flows can increase risky behavior and increase bank leverage. We examine the implications for banking behavior using flow-of-funds (FOF) data from five Asian economies—Indonesia; the Republic of Korea; the Philippines;.
In the case of Indonesia, banks are increasingly seeking funds from non-currency and deposit sources. In the case of the Republic of Korea, the FOF data show a persistently strong tendency to expand loans. Although the level of non-core liabilities has still raised alarms in most economies, it could threaten macro and financial stability if left unchecked.
This implies that the credit risks associated with LCY bonds in the region's emerging markets are significantly lower than in the past. The share of foreign ownership in some of the region's LCY bond markets has increased, reaching roughly a third of total bonds outstanding in Indonesia and Malaysia, and more than 10% in the Republic of Korea and Singapore (Fig. 2.24).
Third Phase and Onward
The issuance of offshore FCY corporate bonds has caused currency mismatches on the consolidated balance sheets of emerging market companies. This offshore issuance has been accompanied by growth in corporate deposits in the domestic banking system, which become vulnerable to withdrawals in the event of corporate distress. The comments led to a sell-off in US bond markets, with bond yields rising from 2.13% in early June to 2.74% on July 8.
Note G3 currency bond issuance covers data for the People's Republic of China; Hong Kong, China;. For emerging Asia as a whole, FCY bond issuance fell from $81 billion in the first 5 months of 2013 to just $7.5 billion in June and July. With the exception of the renminbi and the Philippine peso, all emerging Asian economies fell against the US dollar following the May 22 announcement.
Bond yields in the PRC and Vietnam were the only exceptions as they were unaffected by the sell-off. Consistent with other vulnerability indicators, India and Indonesia (along with Vietnam) are at the top of emerging Asian economies with the highest CDS spreads (Figure 2.29). CDS spreads in the PRC, Malaysia and the Philippines also widened despite better fundamentals.
We normally invoke a mismatch in leverage or maturities when explaining crises – with the usual protagonists in the crisis story of banks or other financial intermediaries. For the People's Republic of China (PRC), the daily stock price indices are the combined composites of Shanghai and Shenzhen weighted by market capitalization in US dollars. Asset managers are accountable to the trustees of the fund that gives them their mandate.
For Emerging Asia, a positive (negative) value for the exchange rate indicates the appreciation (depreciation) of the local currency against the US dollar. For European markets, a positive (negative) value for the exchange rate indicates the depreciation (appreciation) of the local currency relative to the US dollar.