The wear resistance of the cermet coatings was measured by tribometer (UMT TriboLab, Bruker, Campbell, CA, USA). The surface characteristics of the cermet coatings were measured using a 3D optical microscope (ContourGT-1, Bruker, Campbell, CA, USA). The worn morphologies of the substrate and cermet coatings were observed by SEM, as shown in Figure 17.

Discussion
The main reason for this result was the different volume fraction of the reinforcing particles in the coating. The hardness of the coating at 2500 W decreased slightly from the surface area to the middle area and decreased significantly in the bonding zone. Figure 6a shows the microstructure of the coating at 2800 W, the grain size and the volume fraction of the second phase i.
Conclusions
Effect of Mn on the mechanical properties and microstructure of reaction-centered Mo2NiB2 boride-based cermets. Mater. Effect of Ni content on the microstructure mechanical properties and erosive wear of Mo2NiB2-Ni cermets.Ceram. Effect of mechanical ball milling time on the microstructure and mechanical properties of Mo2NiB2-Ni cermets.Materials.
Investigations on Aging Behavior and Mechanism of Polyurea Coating in Marine Atmosphere
- Introduction
- Materials and Methods 1. Materials
- Results
- Conclusions
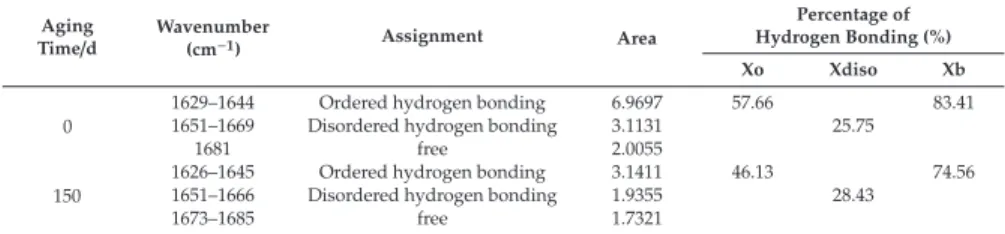
In this section, the effect of aging on the tensile properties of the polyurea coating was investigated. A comparative analysis of the relative trends in the degree of hydrogen bonding of PCB and PCA had to be considered separately. Morphology control in surfactant-free polyurethane/acrylic hybrid lattices - The distinct role of hydrogen bonding. Polymer.
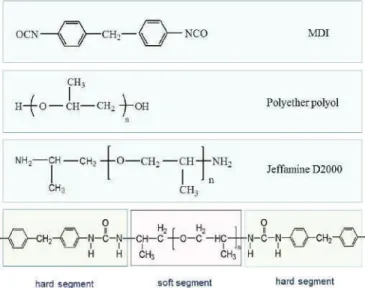
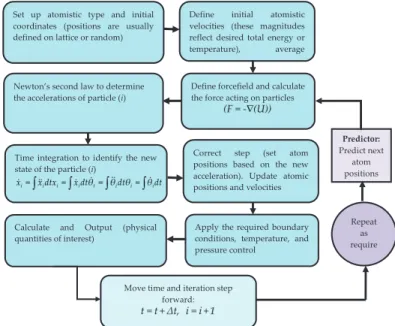
Material Analysis and Molecular Dynamics
Simulation for Cavitation Erosion and Corrosion Suppression in Water Hydraulic Valves
Materials and Methods
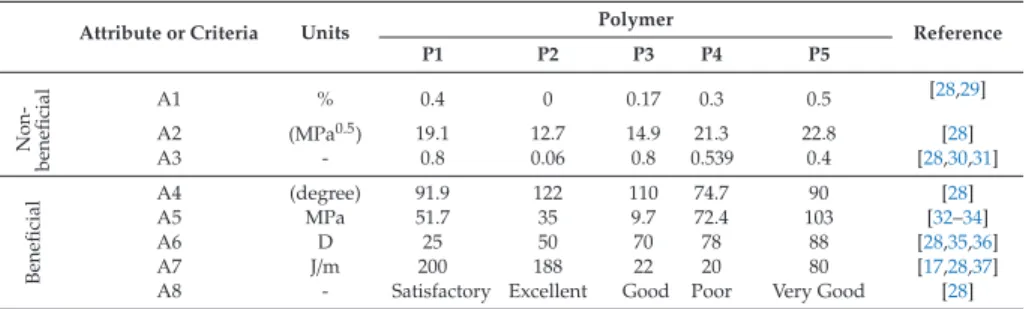
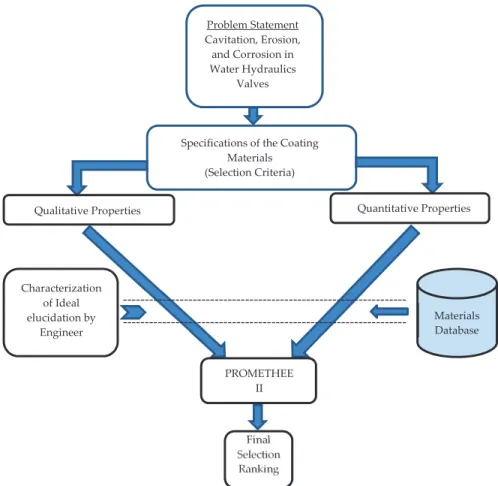
The right choice of material for a specific function is one of the essential tasks of the designers. To meet consumer final specifications, developers must, with specific functionalities, evaluate the quality of different materials and find suitable materials. The selection of materials is a challenging and time-consuming task due to the presence of a large number of materials with different characteristics.
The disclosed use of PTFE reveals the fact that it has meritorious chemical inactivity and high thermal stability. After preparing the PDMS solid, the hydrophilic uniqueness of the PDMS was lowered so that it can be covered with metals for electrode and microchannel applications [43]. Therefore it does not splinter when cracked and is one of the hardest thermoplastics with high scratch resistance [45].
Figure 3 shows the hierarchy of Material Selection based on non-beneficial and beneficial criteria. The criterion must match the requirement of the system to survive the pressure prone to hydrodynamic cavitation and erosion wear due to the massive flow of pressurized fluid in the valve chamber. Based on the valve demand for water hydraulics and taking into account the flow of the most important selected attributes, engineering and material.
The periodic layer of the amorphous polytetrafluoroethylene (PTFE) cell was constructed and the structure was geometrically refined from the atactic polymer used in this work.
Results and Discussion
This may be due to differences in the chemical reactivity functions within the frameworks of density functional theory (DFT), the high transfer rate of electrons to or from the in-plane (010) reactants of PTFE/Al2O3, or due to the change in the geometric structure of the molecules (equivalent in external potential). These results seem to indicate that the strength of the composite is better than the effect of water hydraulic valve degradation due to the sudden pressure surge caused by imploding cavitation bubbles. The improvement of cavitation erosion resistance can mainly be linked to the increase of hardness and elastic response of PTFE/Al2O3 improvement.
Funding: Natural Science Foundation of China supported this work under Grant 5187511, Natural Science Foundation of Heilongjiang Province of China under Grant F2016003, 'Jinshan Talent' Zhenjiang Manufacture 2025 Leading Talent Project, "Jiangyan Planning" Project in Yangzhong City. Numerical analysis and optimization of the flow forces in a water hydraulic proportional cartridge valve for injection system. IEEE access. In conjunction with the 2011 IEEE 24th International Conference on Micro Electro Mechanical Systems, Cancun, Mexico, 23-27 January 2011.
Enhancement of electrical and tribological properties of poly(methacrylate) matrix nanocomposite films by co-incorporating multi-walled carbon nanotubes and silicon dioxide microparticles. J. In Proceedings of the 2015 International Conference on Advanced Power and Control Engineering (ICPACE), Bangalore, India, 12–14 August 2015; pp. Application of the condensed Fukui function to predict reactivity in core-shell transition metal nanoparticles.Electrochim.
This article is an open access article distributed under the terms of the Creative Commons Attribution (CC BY) license (http://creativecommons.org/licenses/by/4.0/).
Mechanically Robust and Repairable
Superhydrophobic Zinc Coating via a Fast and Facile Method for Corrosion Resisting
Experimental
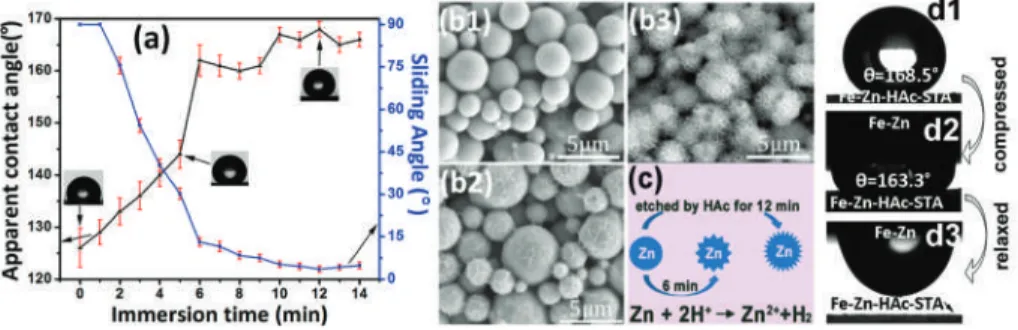
The surface wettability of the Fe-Zn-HAc-STA sample varies with the etching time in the aqueous solution of HAc. Scanning electron microscopic images of the Fe-Zn sample (b1), the Fe-Zn-HAc with an etch time of 6 min (b2) and 12 min (b3). Figure 2b shows the FTIR spectra of the Fe-Zn sample and the Fe-Zn-HAc-STA sample.
Fourier transform infrared spectra of Fe-Zn sample (curve i) and Fe-Zn-HAc-STA sample (curve ii) (b). Here, the Fe-Zn-HAc-STA sample was immersed in ethanol and the surface wettability variation was plotted (Figure 4a). As shown in Figure 5d, the thickness of the Fe-Zn-HAc-STA sample was reduced by 49μm after 100 cycles.
Variation of apparent contact angle for the Fe-Zn-HAc-STA sample in relation to wear cycles (b). Scanning electron images for the Fe-Zn-HAc-STA sample after 10 cycles of abrasion (c1,c2) and re-impregnation in acetic acid solution and ethanol solution of stearic acid (c3,c4). Scanning electron images for the cross-section of the Fe-Zn-HAc-STA sample before (d1) and after (d2) wear for 100 cycles.
Figure 6a shows the variation of surface wettability for Fe-Zn-HAc-STA sample (curves i, iii) and Fe-Zn sample (curve ii) in aqueous NaCl solution for 20 days.
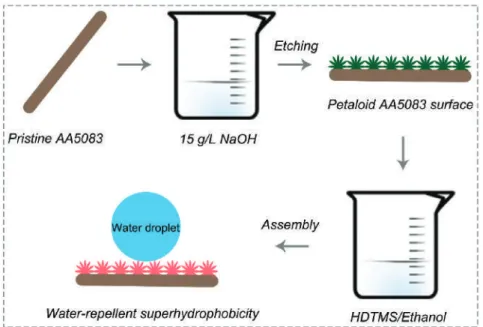
Lotus-Inspired Multiscale Superhydrophobic AA5083 Resisting Surface Contamination and Marine
Corrosion Attack
Experimental Section
A Dataphysics OCA25 instrument (Stuttgart, Germany) was used to measure the static water contact angles and sliding angles of the as-prepared superhydrophobic AA5083 samples. However, after the etching texture and HDTMS assembly, the contact angle of the as-prepared superhydrophobic AA5083 surface is about 156.3◦±1◦ with a sliding angle lower than 1◦. On the contrary, the elevation of the as-prepared superhydrophobic AA5083 was approx. 970 nm, which provides a significant improvement.
The chemical composition of the pristine AA5083 superhydrophobic surfaces and the HDTMS assembly was characterized by EDS (Figure 5a) and XPS (Figure 5b). It is clear that the elements C, O, Si and Al were detected and demonstrated in the XPS spectrum of the as-prepared AA5083 superhydrophobic surface. C 1s, O 1s and Si 2p peaks in the XPS spectra of the superhydrophobic AA5083 sample prepared as contributed to the assembly of the HDTMS molecule.
In this work, MnO powder and graphite powder were sequentially applied as surface contaminations of as-prepared superhydrophobic AA5083 samples. The anti-moisture and water-resistant property of the as-fabricated AA5083 superhydrophobic surface contributes to the remarkable improvement of the modulus of elasticity. The lower Qdl value and higher Rct value of the properly prepared AA5083 superhydrophobic substrate suggest that the charge transfer process of corrosive ions occurs with difficulty.
EIS and fitting results showed that the Rct of the as-prepared superhydrophobic AA5083 sample is two orders of magnitude higher than that of pristine AA5083.
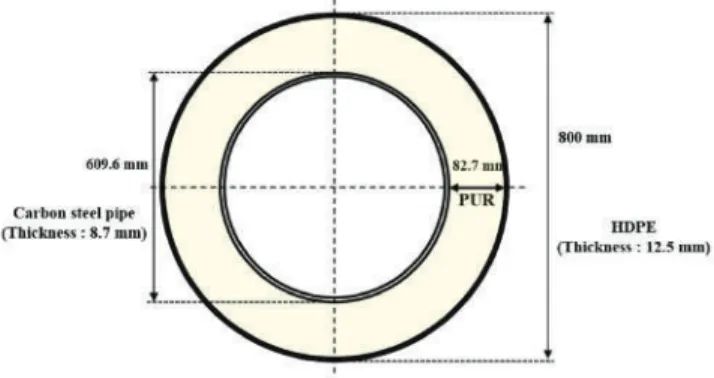
Optimization of Cathodic Protection Design for Pre-Insulated Pipeline in District Heating System
The computational analysis tool BEASY S/W (BEASY Ltd., Southampton, England), which is based on the boundary element method (BEM), was used to perform 3D modeling and computational analysis of the pre-insulated pipeline. Therefore, the CP design has been tested at a range of defect ratios and it is assumed that the insulating part of the pipeline has no defect. The area of the pipe used in the CP design was 12.62 m2, including an additional safety factor of 10%.
All simulation results failed to meet the CP criteria for pre-insulated pipelines (below -1350 mVSCE) because the IR drop caused by soil and structural factors was not considered in the CP design. Therefore, the simulation results can apply up to 10% of the defect ratio, which has a minimum potential of about −2.49 VSCE. When CP applies above 10% of the defect ratio, the defect site should be investigated first.
The results of the simulations using the theoretical method did not meet the CP criterion determined for the heating of pre-insulated pipelines. Consequently, all simulation results of failed pipelines met the CP criteria after adding the correct CP flow. Including practical corrosion properties of metal and environmental factors in the computational analysis improves the reliability of the CP design for a pipeline.
Optimizing cathodic protection design considering temperature variation for offshore structures. Corrosion.
Microstructure and Corrosion Resistance of Zn-Al Diffusion Layer on 45 Steel Aided by
Mechanical Energy
In this paper, we investigated the microstructures and distribution of elements of the Zn-Al diffusion layer. Figure 2 shows the SEM images and the corresponding energy dispersive spectroscopy (EDS) spectra of the Zn-Al diffusion layer in cross section. Figure 2b is an enlarged image of the rectangular area in Figures 2a,c,d are EDS spectra of the Zn-Al diffusion layer.
The first part (Part A) is close to the Zn-Al diffusion layer and has a thickness of 3 μm. We studied the surface corrosion topography and changes in the corrosion products of the Zn-Al diffusion layer in different stages of corrosion. It shows that the cathodic oxygen absorption reaction (the formation of a layer of corrosion products) controls the corrosion reaction of the Zn-Al diffusion layer by increasing the value of βc.
Impedance modulus and corrosion rate of different immersion times of the Zn-Al diffusion layer. Therefore, the impedance modulus of the Zn-Al diffusion layer rapidly increases to 3.5 wt. The installation data of the equivalent circuit of the Zn-Al diffusion layer is shown in Table 7.
In other words, the penetration of the corrosion solution causes the resistance Rc of the Zn-Al diffusion layer to decrease.