2008 China's Dilemma: Economic Growth, Environment and Climate Change 2009 China's New Place in a World of Crisis. 2014 Deepening Reform for China's Long-Term Growth and Development 2015 China's Domestic Transformation in a Global Context.
Deepening reform and opening-up for China to grow into a high-income countryChina to grow into a high-income country
The second cause of the growth slowdown is China's aging population, which is causing a decline in the share of the working-age population in the total population. While China's innovation is currently in its initial phase—characterized by high investments—the authors suggest that these upfront costs will yield high returns in the coming years.
China’s economic development
The theoretical model in Ek and Wu (2018) shows that the relationship between investment-cash flow sensitivity and the severity of financial frictions indeed depends on the curvature of the profit function and the cost function of external finance. This implies that 70 percent of the total TFP loss can be attributed to policy distortions.
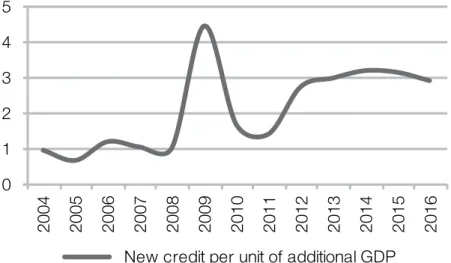
Chinese corporate debt and credit misallocation
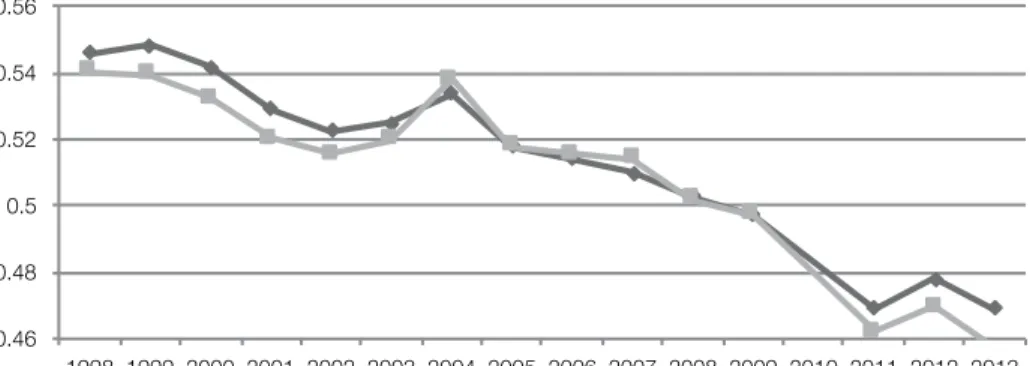
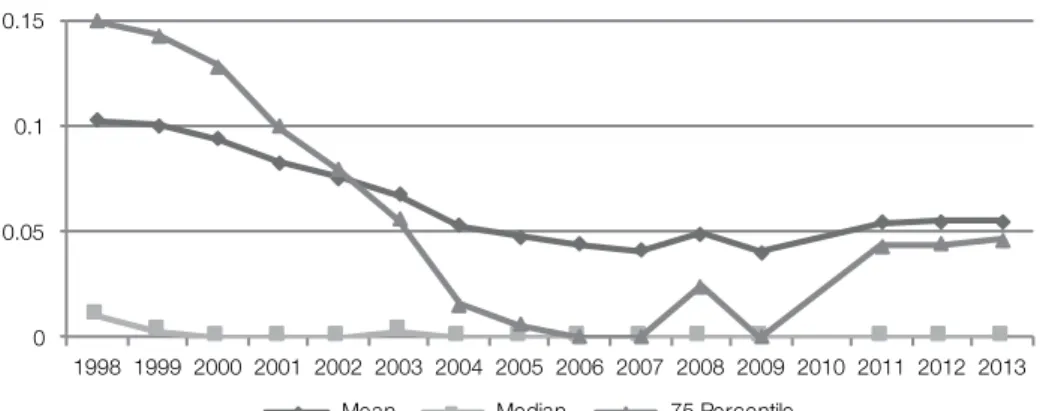
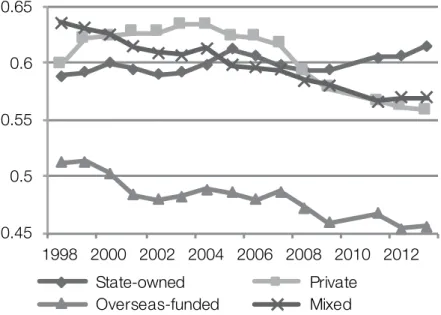
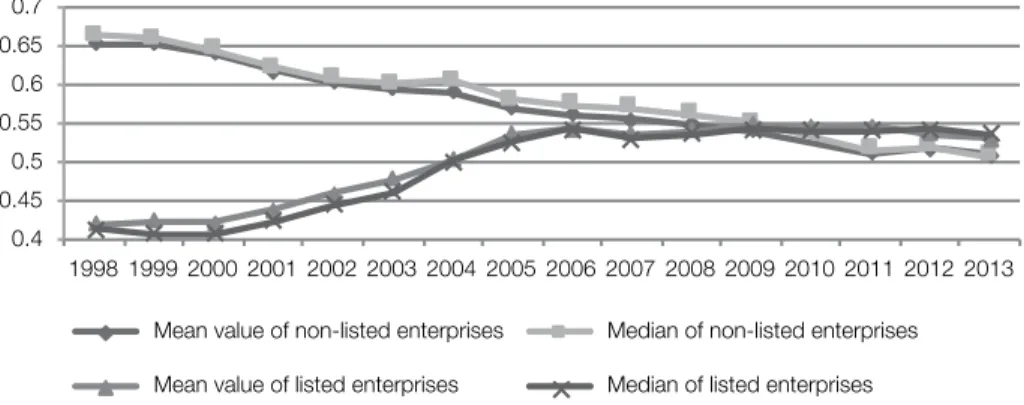
We first analyze the debt ratio (that is, total liabilities/total assets) of nearly 4 million observations in this data set. It is worth noting that the average debt ratio of long-standing SOEs was stable and increased after 2009. However, the relationship between the proportion of fixed assets and the debt ratio is not significant.
In this section, we present six facts about changes in the debt ratio of Chinese companies in the sub-samples, sorted by different standards. The average debt ratio in the East region fell by the smallest amount, from 63 percent in 1998 to 55 percent (see Figure 3.9). Therefore, the increase in operational risk may be a reason for the overall debt ratio decline.
In addition, Figure 3.3 shows that the fall in the long-term debt ratio is even greater. Therefore, the change in scale does not seem to explain the decline in the overall debt ratio of Chinese firms. The explained variable TotLev in table 3.1 is the debt ratio for each company in the current year.
A structural investigation of the Chinese economy with a hybrid
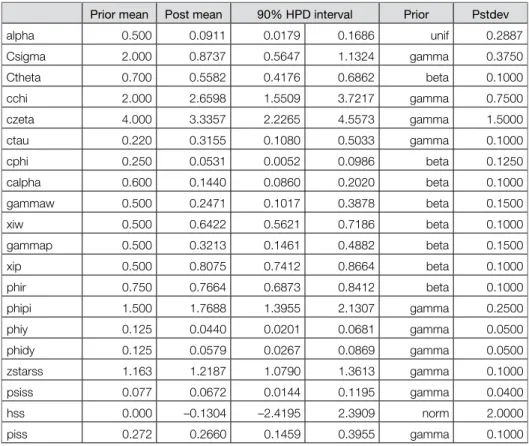
The financial friction mechanism is of the type proposed by Bernanke et al. 1999) to model market imperfections in the financial sector. A Taylor-type rule for monetary policy is a rule that determines the nominal interest rate of the economy. Details of the sources of this data series are in the working paper version of this chapter (Li and Wang 2018).
The different weightings attached to the quantity part of the monetary policy rule before and after 2009 indicate that the GFC had a measurable impact on China's monetary policy. Based on the estimated monetary policy rule in the previous subsection, we can continue with the examination of the cyclical fluctuations of the Chinese economy in the period 2001-17. As shown in the previous section, neutral technology is one of the main drivers of fluctuations in output growth, while investment-specific technology and.
A structural study of the Chinese economy with a hybrid monetary policy rule. net worth technology are the main drivers of investment activity. We construct a rich DSGE model in this chapter for the structural study of the Chinese economy. A structural study of the Chinese economy with a hybrid monetary policy rule Prior mean Post mean 90% HPD interval Prior Pstdev.
Off-farm employment in rural China and the hukou system
Third, the probability of farm workers going to a particular city for off-farm work is also important. MigShr_inprovince and MigShr_outprovince indicate the share of non-agricultural employment within province p and between provinces -p. In addition to household restriction policies, there are many other factors that influence farm workers' choice of off-farm work.
In particular, it is theoretically unlikely that off-farm part-time employment will be affected by the settlement-related restriction. 98 . in agricultural production and have off-farm income) from full-time off-farm employment (defined as detached from agricultural production, have no farming income and are fully engaged in non-agricultural industries). The essential question we are trying to answer is what is the impact of the hukou policy on the employment of rural labor outside the farm.
First, using the average share of off-farm employment in the total labor force at the farm household level, we examine the impact of employment-related and settlement-related restriction policies on the rural worker's choice of off-farm employment. This means that the relaxation of the employment restriction policy contributes positively to the increase in the share of the rural workforce that chooses employment outside of farms. This suggests that the wage gap is likely to have a greater impact on full-time off-farm employment.
The household registration policy classification and score method
Note: Two categories of household registration policy are summarized according to the national household registration policy from 1958 to the present, combined with the provincial household registration policy from 1981-2018 in 28 provinces, excluding Tibet, Xinjiang, Gansu, Hong Kong, Macau and Taiwan.
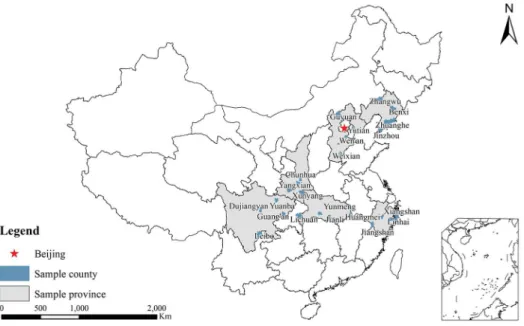
The distribution of sample farms
Robustness check for the cliffs in 2000 and 2008
Nonstandard employment: Global vision and evidence from China’s urban
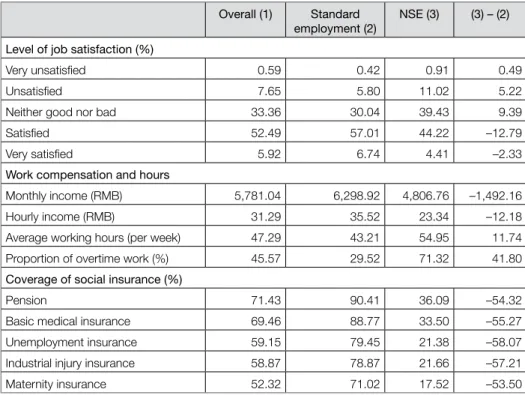
This chapter aims to draw more academic attention to the growth of NSE in China. The average monthly income of NSE employees was 76.31 percent of standard employees. The share of employees in a normal employment relationship who were included in the basic pension amounted to 90.41 percent, while the share of employees in the NSE was only 36.09 percent.
The share of union members in standard employment was 33 per cent, while that of NSE workers was only 3.68 per cent, indicating a low representation of NSE workers in such organisations. Sixth, of the six cities surveyed, the share of NSE workers whose wages were below the local minimum standard (7.25 percent) was higher than that of workers in standard jobs (2.42 percent) (Table 6.3). As indicated in the table, the percentage of NSE workers had a secondary education or lower, which was much higher than the proportion of those in standard employment (37.24 percent).
Fourth, the proportion of NSE workers with rural hukou was higher than those with urban hukou. First, the share of NSE in China's urban labor market was 34.95 percent, which shows the importance of this type of employment in China. Based on these findings, three key issues are highlighted to address the growth of NSE in China.
E-commerce development in rural China
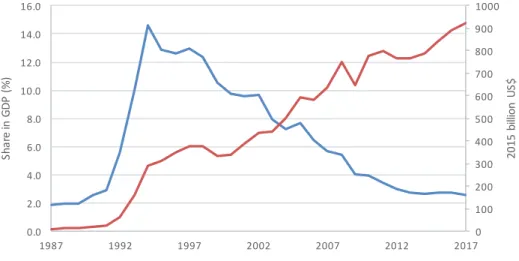
2016.1 In addition, it is particularly noteworthy that the digital economy contributed about 55 percent of total GDP growth, was a powerful growth engine and encouraged a range of socio-economic developments in China. The country is home to 42 percent of global e-commerce and the total annual e-commerce transaction value is greater than that of France, Germany, Japan, the United Kingdom and the United States combined (Wang et al. 2017). This share was significantly lower than that in the United States (3.72 percent) and the United Kingdom (4.5 percent).
In 2016, China's total value of online sales rose to RMB5.33 trillion, accounting for 14.9 percent of the country's total retail sales. 1 During its presidency of the G20 in 2016, China supported global efforts to define the digital economy within the G20 Digital Economy Development and Cooperation Initiative. As a result, there is much hope that the digital economy – especially e-commerce – can serve as an effective vehicle to generate growth, alleviate poverty, reduce inequality and improve various dimensions of social development in rural China.
Based on data from the Ministry of Trade, rural online retail increased by 39.1 percent in 2017. By the end of 2017, the number of online stores run in rural areas was 9.86 million – an increase of 20.7 percent. In addition, by considering related research and policy findings at national and sub-national levels, we provide some initial thoughts on the impacts of e-commerce development in rural areas and the policies needed to unlock the potential of the digital economy.
- Innovation of Chinese listed
- The effects of financial sector opening on financial constraints
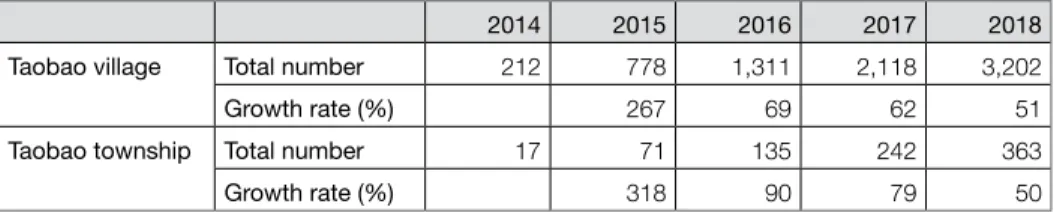
Second—not unlike other aspects of China's economic development—the distribution of Taobao villages exhibits clear regional differences. But the Taobao villages are clearly clustered in the coastal region, where the economy is generally more developed compared to the rest of the country. Behind the rapid improvement of China's overall innovative competence is the improvement of the innovative competence of Chinese enterprises, where listed enterprises are the main force of enterprise innovation and development.
The evaluation results show that, although China's national innovation competence is ranked among the top 20 in the world, listed Chinese companies are generally in the preliminary stages of innovation and development, and the potential for future progress is great. Therefore, evaluating the innovation competence of listed companies in China can provide a good picture of the structural distribution and overall trend of China's innovation competence. The regional distribution of China's top 500 companies in terms of innovation competence shows that there are more innovative companies in the east and less in the west of the country.
2015), A Comparative Analysis of the National Innovative Evaluation Indices, [in Chinese], Science Research Management Analysis of Independent Innovation Capability of Industrial Enterprises in China, [in Chinese], The World of Survey and Research Study on the Structural Model and Operating Mechanism of Regional Innovation Systems, [ in Chinese], China Soft Science (3): 135–8. Opening up the financial sector has played a very important role in the development of the domestic economy and the efficient allocation of factors of production. The establishment of the Chinese (Shanghai) Pilot Free Trade Zone in 2013 was another key juncture in China's liberalization of financial services.
In January 2002, the 'Rules for the Implementation of the Regulations of the People's Republic of China on the Administration of Foreign Financial Institutions (Amended)' was promulgated, and in December of the same year, renminbi business was opened to foreign banks in five cities: Guangzhou, Qingdao, Zhuhai, Nanjing and Wuhan . At the same time as China's entry into the WTO, in December 2001, the 'People's Republic of China Regulations on the Administration of Foreign-Invested Insurance Companies' was announced by the State Council.