V: Zbornik 11. konference IEEE Consumer Communications and Networking Conference (CCNC), Las Vegas, ZDA (2014). V: Proceedings of the 8th International Conference on Performance Evaluation Methodologies and Tools (Value tools), Bratislava, Slovaška (2014).
Performance and QoE
The benefits of including context in QoE monitoring and management are demonstrated through use cases involving video flash mobs as well as online and cloud gaming. Finally, we discuss potential technical realizations of context-aware QoE monitoring and management derived based on the SDN paradigm.
1 Introduction
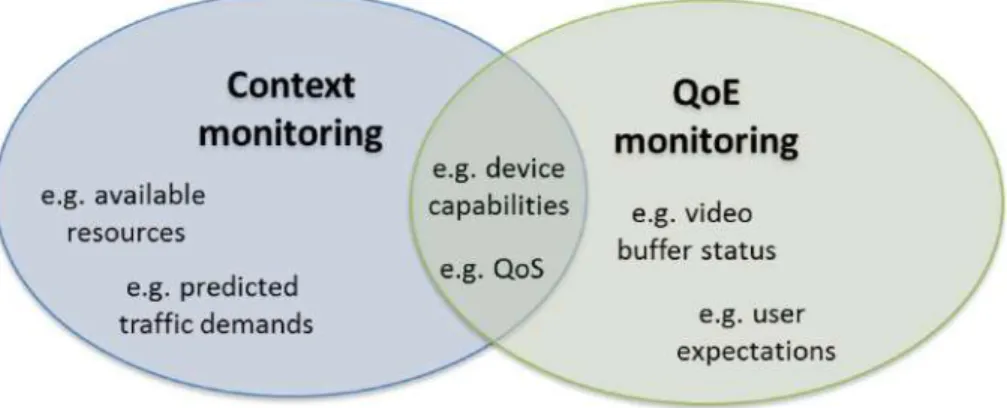
To date, there is still limited understanding of the potential business models, technical realizations, and exploitation benefits of extending "traditional" QoE monitoring solutions (e.g., monitoring network conditions, device capabilities, application-specific parameters, and user-related factors). with context monitoring. Section 2 outlines a generic framework for context monitoring by proposing a context information classification scheme and discussing the possible involvement of this information in QoE monitoring and management solutions.
2 Generic Framework for Context Monitoring
Definition and Classification of Context Information
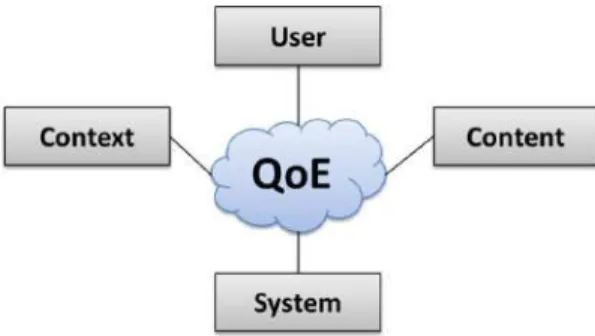
First, these context attribute values are used to derive context states defined as "the current state of a user, application, network, or device that is modeled at a point in time based on the context attributes". This notion of context factors as QoE influencing factors is also in line with recent works described in [50,56].
Towards Context-Aware QoE Modeling and Estimation Strategies
In some cases, the QoE model may directly include KPIs, such as a QoE score modeled against network latency or packet loss. We refer to an "enhanced" context-aware QoE evaluation model as potentially incorporating context data at three different levels:.
![Fig. 2. Context-aware QoE estimation process, adopted with modifications from [4].](https://thumb-ap.123doks.com/thumbv2/1libvncom/9202428.0/44.659.91.587.80.352/fig-context-aware-qoe-estimation-process-adopted-modifications.webp)
Involving Context in QoE Monitoring
The main concerns and challenges in implementing QoE monitoring procedures on top of the already available network mechanisms mainly have to do with A further challenge in capturing the context and consequently in the validation of QoE monitoring techniques is the fact that these studies must be carried out in the field.
3 Context Factor Examples, Use Cases and Literature
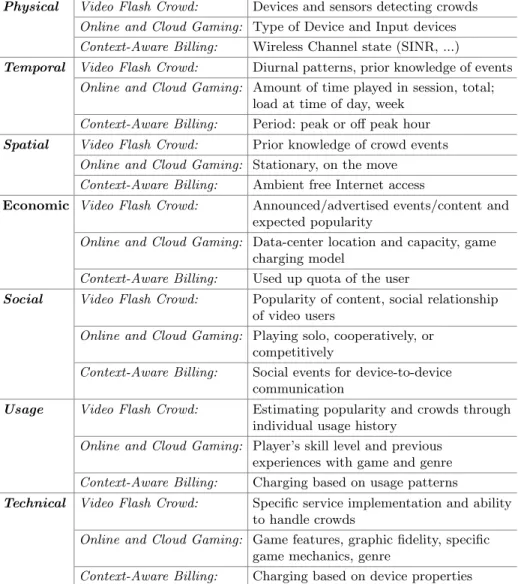
Usage Examples for the Context Factor Categories
Online and cloud gaming: Stationary, on the go Context billing: Free internet access in the environment. With the evolving mobile architecture, users increasingly expect the availability of services and applications while on the go.
Use Case: Video Flash Crowd and QoE
If many of the users who are not aware of the flash crowd event request the video at its highest quality, most of the users will suffer to stop, resulting in a worse overall QoE. The results are very sensitive to the dynamics and interactions of the HAS control loop and the CDN load balancing.
Use Case: Online and Cloud Gaming
If the specific characteristics of a game are known in advance, timing constraints can be determined without further measurement and used for stream management. Depending on the direction of the interaction, QoE management can be either lenient or become stricter over the course of a game session.
4 Discussion on Technical Realization Approaches of Context Monitoring
Monitoring with SDN
This is especially important for latency-sensitive applications such as online multiplayer games or teleconferencing. For this reason, SDN interoperability and communication with entities such as the Access Network Discovery and Selection Function (ANDSF) and the Policy and Charging Rules Function (PCRF) of 3GPP can be important.
QoE Management with SDN
The work in [45] considers a framework where the QoE of streaming video is measured at the video player running at the destination node, informing the network of the achieved QoE. Unlike the previous approach, QoE is measured within the network and is based on video reliability and representation throughput.
5 Conclusions
Other scenarios may also use APIs bound to different directions, e.g. context monitoring can also be carried out by the NBI. Further use cases highlighted some opportunities of how context monitoring can be deployed to improve QoE in future wireless and mobile networks.
I: Proceedings of the 8th International Conference on Emerging Networking Experiments and Technologies, CoNEXT 2012, s. I: Proceedings of the 12th ACM SIGCOMM Workshop on Network and System Support for Games (2013).
1 Introduction to QoE Management
It then discusses recent research on promising technical approaches to QoE-driven management that operate at different layers of the network stack. Subsequently selected concrete research on promising technical approaches of QoE-driven NAM that work on different layers of the presented network stack.
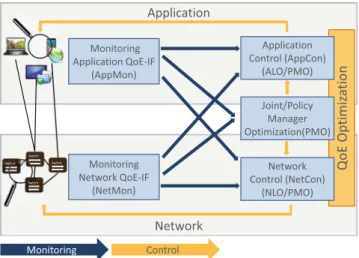
![Fig. 1. Overview: Network- and Application Management operate at different control points along the delivery chain of services and applications (based on [66]).](https://thumb-ap.123doks.com/thumbv2/1libvncom/9202428.0/66.659.92.593.82.282/overview-network-application-management-different-delivery-services-applications.webp)
2 Towards a Generic Framework for QoE-Driven Network and Application Management
Key Components and Key Challenges
As also previously mentioned, legal and business aspects related to the implementation of a QoE management framework must be addressed. QoE management as a whole QoE monitoring QoE adaptation and optimization Different terms and concepts used.
A Generic Framework for QoE-Driven NAM
In the case of QoE customization and optimization, the following four questions: (1) what should be checked?; (2) where to check?;. All implement an estimator of the buffer state of the YouTube client by deep packet inspection performed in the network.
3 Specific QoE Management Approaches
Multidimensional Modeling as a Prerequisite for Effective QoE Management
Therefore, perceptions of website usability, aesthetics, load time, and quality of information, respectively, differ in that order in how much they affect overall QoE (from most to least influential), regardless of the task performed or the resource used. device. in a context of mobile web browsing [12]. The number of taps, website aesthetics, website load time, and quality of website information in that order differ in how much they affect perceived usability (from most to least influential) in all considered cases except when browsing the thematic portal (regardless of the device used).
QoE Management by Differentiated Handling of Session-Control Signaling
More precisely, a strong and negative impact of session control signaling load on user perception of SIP performance metrics (ie RRD, SRD, SDD) and overall QoE. The research results indicate that session control signaling load negatively affects user perception of SIP signaling performance metrics and overall QoE with the VoIP service.

QoE Management with SDN
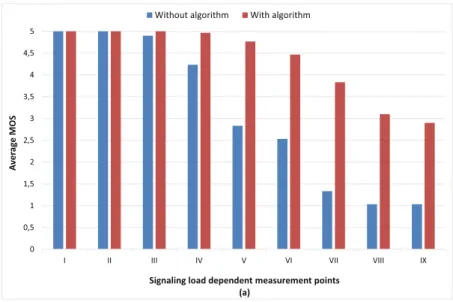
Figure 5 shows the user perception of overall QoE expressed in terms of mean opinion score (MOS) as a function of session control signaling load and algorithm implementation. Furthermore, a linear model is proposed to describe the relationship between user perception of SIP performance metrics and overall QoE with VoIP.
4 Outlook: Future Evolution of Software-Based QoE Management
Software-Defined Networking (SDN)
Network Functions Virtualization (NFV)
Multi-access Edge Computing (MEC)
5 Conclusion
In: Proceedings of 8th ACM/SPEC on International Conference on Performance Engineering Companion, ICPE 2017 Companion, p. In: Proceedings of the 11th International Conference on Network and Service Management (CNSM 2015), Barcelona, Spain, pp.
Indicators Towards Overall Telecommunication System’s QoE Management
Definitions of served, carried, parasitic, discarded and offered transport traffic are proposed, based on the ITU-T definitions, and eight service phase traffic quality indicators are proposed. 4, telecommunication system and network efficiency indicators are presented as follows: eight indicators – at the service stage level, five indicators – at the network level, and three indicators – at the overall system level.
2 Service Phase Concept and Traffic Quality Indicators
- Service Phase
- Causal Generalization
- Offered Carried Traffic
- Traffic Quality Indicators
- Offered Carried Traffic Efficiency – the ratio of the carried traffic, in a service phase, to the offered carried traffic
- Causal Ousted Importance – the ratio of the ousted traffic due to reason i (ous.Yi) to the offered carried traffic of a service phase (ofr.crr.Ys)
- Causal Parasitic Importance – the ratio of the parasitic traffic due to reason i (prs.Yi) to the served traffic of a service phase (srv.Ys)
- Parasitic Traffic Importance – the sum of all causal parasitic impor‐
- Ousted/Parasitic Traffic Ratio – this is the ratio of the ousted traffic to the parasitic traffic
1 the served traffic in the device with (srv.Ys) is the following sum:. 1) Definition 3: Traffic transferred in a resource group is traffic that was successful. If we treat the system as stationary, using Little's formula [6] we have: prs.Ys=prs.Fs prs.Ts and crr.Ys=crr.Fs crr.Ts.

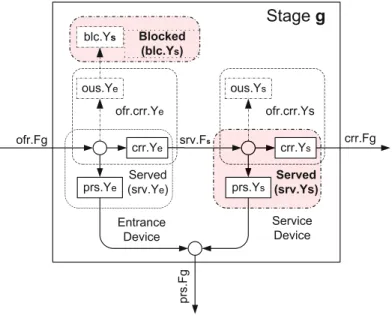
3 Service Stage Concept and Traffic Quality Indicators Definition 7: The Service Stage is a service presentation containing
- Service Stage
- Traffic Quality Indicators
- Carried Effectiveness of a Service Stage – the ratio of the effective carried traffic to the carried traffic
- Telecommunication System QoS Concept
- Efficiency Indicators
- Efficiency indicator Qai on the Ai sub-stage
- Efficiency indicator Qad on the Ad sub-stage
- Proposed Efficiency Indicators on Network Level
- Proposed Efficiency Indicators on Overall System Level
- Approach Applicability and Results
Let ofr.Fg be the flow intensity of the service request attempts offered to this step, crr.Fg – inten‐. The transported traffic (crr.Yg) in service step g is the sum of the transported traffic in units e and s:.
5 Network Cost/Quality Ratios
Mean Cost/Quality Ratio
The definition of the QoS indicator (Q) may differ from users' perspective (i.e. as a general QoE parameter) to the telecommunication service provider's perspective. In any case, the value of the QoS indicator (Q) in (57) is the average value in the time interval considered.
Instantaneous Cost/Quality Ratio
The traffic volume in a given time interval is the time integral of the traffic intensity over this time interval” [5], the 'Cost per Unit' quantity is:. Normalized Cost/Quality Ratio(NCQR) = 1. 60) The Normalized Cost/Quality Ratio (NCQR) is independent of the absolute system cost amount.
Prediction of Instantaneous Cost/Quality Ratio
Numerical prediction of normalized cost/quality ratio (NCQR), network call efficiency (Ebu) and paid traffic intensity in a unified telecommunication system with QoS guarantees (case 1: network capacity = 10% of terminals). Numerical prediction of normalized cost/quality ratio (NCQR), network call efficiency (Ebu) and paid traffic intensity in a unified telecommunication system with QoS guarantees (case 2: network capacity = 25% of terminals).

6 Conclusion
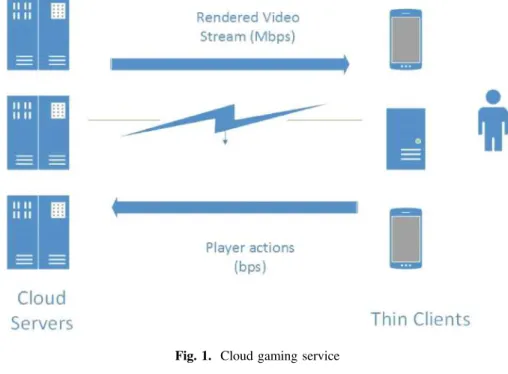
Essentially, lag compensation is a technique that attempts to equalize lag for all players in a cloud gaming scenario. The first goal is to explore the feasibility of implementing a real-time lag compensation mechanism for cloud gaming.
Motivation
At the same time, since most of the consumed video of a mobile data network is delivered through server-driven traditional HTTP video streaming, the ability of such monolithic HTTP video streaming to support a fully personalized video playback experience at the end user is called into question . . To that end, this traditional technique is gradually being replaced by client-driven video streaming that uses HTTP Adaptive Streaming (HAS).
From QoE-Awareness to Context-Awareness
At the same time, better QoE improvement can be achieved on the user side if both network and application level information are used (cross-layer approaches). Several variants of the three previous steps or building blocks can be found in the literature, such as [3,4].
2 System Analysis
- System Model
- Optimization Problem
- HAS-Based Strategy
- QoE Models
- Realization in the Network
In addition, similar to our approach, [14] proposes a predictive HAS strategy that requires predicting the channel state based on the received signal strength (RSS) and proactively adjusts the user buffer. Namely, R is the user's prediction of the available network bandwidth as estimated by the HAS strategy.

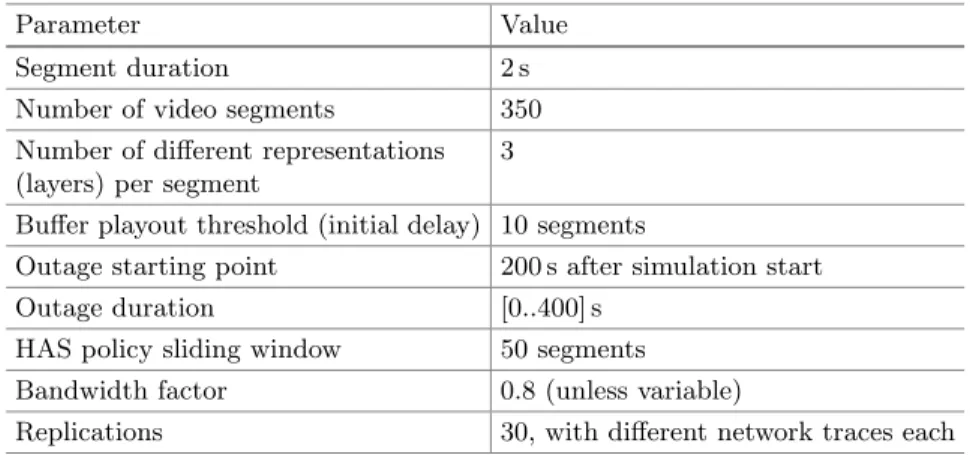
3 Evaluation Results
- Proof of Concept
- Required Advance Time Estimation (“Context Time”)
- Comparison of Different Strategies
- The Impact of Unreliability of Context Information
For the purposes of this experiment, we assume that the user's buffer is not limited and therefore the user will continue to download as many bits as his connectivity to the base station allows. In that case, we would expect that the starting point of the failure would not play such a crucial role, but the maximum size of the buffer would.
4 Conclusions
In accordance with the recommendations of the Telecommunication Standardization Sector of the International Telecommunication Union (ITU-T), it is analytically expressed. Two conceptual representation structures are compared – the normalized structure and the pie structure.
2 Conceptual Model
- Background
- Conceptual Model
- QoS Prediction Task Formulation
- Main Assumptions
- Capacity of Devices). The switching system (s) has capacity of Ns connections (every virtual internal switching line may carry only one call attempt)
- Virtual Channel Switching). Every call attempt occupies simulta‐
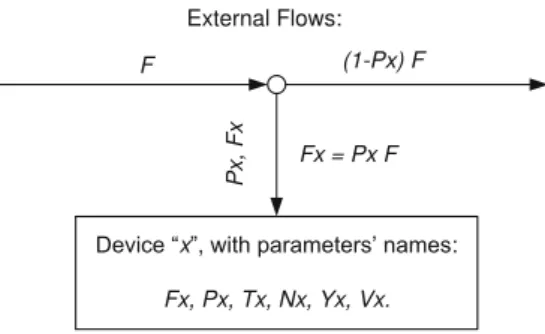
Fx – Intensity or incoming request flow rate (frequency) (ie number of requests per time unit) for device x;. This is an example of call hold - A-user is put on hold (virtual devices "transferred hold" (ch) and "abandoned hold" (ah)).
3 Analytical Model
- Overall Input Flow Intensity
- QoS Indicator 1: Carried Switching Efficiency
- QoS Indicator 2: B-Terminal Connection Efficiency
- B-Terminals’ Characteristics
- A-Terminals’ Characteristics
- QoS Indicator 3: Overall Call Attempt Efficiency
- Network Generalized Subservice Indicators
- AB-Terminals’ Characteristics
- Offered Traffic to the Switching System
Based on this, we define the B-terminal connection efficiency as the ratio between the flow intensity of the calls occupying the intended B-terminal (Fb) and the intensity of incoming call attempts (Fa). The flow intensities Fb1, Fb2 and Fb3 can be calculated by considering the intensity of the carried coupling current Fcs.
4 Results
- QoS Indicator 4: Overall Traffic Efficiency Indicator
- Numerical Results
- Overall Pie Parameters
- Causal Aggregated Overall Pie Parameters
- Numerical Results for Pie Characteristics
Probabilities of the three-branch pie flow of successful communication adherence. The pie traffic intensities of the three branches of successful communication are: Poryazov, S.: Determining the probability of finding subscriber B busy in telephone systems with decentralized control.
![Figure 11 presents results (as functions of the state of the network load – the traffic of all AB-terminals Yab , in the theoretical interval [0, 100]) for a network with blocking probability due to insufficient resources](https://thumb-ap.123doks.com/thumbv2/1libvncom/9202428.0/191.659.178.464.346.628/presents-functions-terminals-theoretical-interval-probability-insufficient-resources.webp)
In Sect.3, we briefly present the large-scale distributed systems we focus on in this chapter, that is systems of IoT, NFV and Clouds, and discuss their elasticity coordination needs. In Sect.5, we present some design patterns that can be used in distributed edge Cloud environments to coordinate elasticity decisions in a decentralized manner.
2 Overview of Elasticity
According to this dimension, solutions vary from design time optimization to runtime optimization methods. In design-time approaches, the system is first modeled in the desired language where optimization is performed on derived models according to specific quality characteristics.
3 Systems of IoT, NFV and Clouds and Their Elasticity Coordination Needs

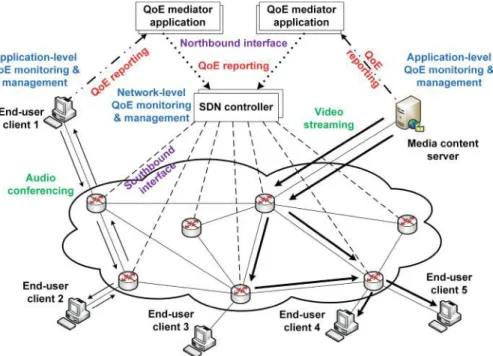
![Fig. 3. An example of performing context monitoring in an SDN environment, adapted from [31] and extended to illustrate a context monitoring scenario](https://thumb-ap.123doks.com/thumbv2/1libvncom/9202428.0/57.659.62.573.84.477/example-performing-monitoring-environment-extended-illustrate-monitoring-scenario.webp)