The columns of numbers in the middle of the output contain two error measurements, for various values of CP. Ordering items can reveal information about the form of the computation used to select the relative positions of ordered items. Based on subject responses, what is the relative precedence of the binary operators used in the study (which may differ from the actual precedence).
In an experimental study, the researcher actively tries to control the values of the explanatory variables (a common technique is to change the value of one explanatory variable while holding the others constant; in some cases, the setting in which the events take place is naturally an experiment, so that the explanatory variables of interest , change in a way that the experimenter could change them). One of the consequences of changes in the behavior of the environment in which the benchmark is implemented is the introduction of systematic noise into the results.
DESIGN OF EXPERIMENTS 359
Design of experiments
Subjects
An essential requirement for generalizing the results of an experiment to a larger population of subjects is that the characteristics of the sample of subjects be representative of the applicable characteristics of the population in question. A limiting factor in designing an experiment with human subjects is usually the amount of time the subjects are likely to be willing to participate in.1716. When humans are the subjects of experiments, a variety of human factors create uncertainty in the results; people constantly adapt to their environment, including the environment of an experiment (for example, they learn and remember memories of their experiences; see section 2.5), they also experience fatigue and their attention shifts back and forth during an experiment.
Much of the published research involving human subjects, in software engineering experiments, has used students. The industry is well aware that students' software engineering skills are not representative of professional developers (who have a few years of experience); the industry is where many graduates find employment after graduation, and the abilities of these new hires are clearly on display for everyone in the industry.
DESIGN OF EXPERIMENTS 361
The task
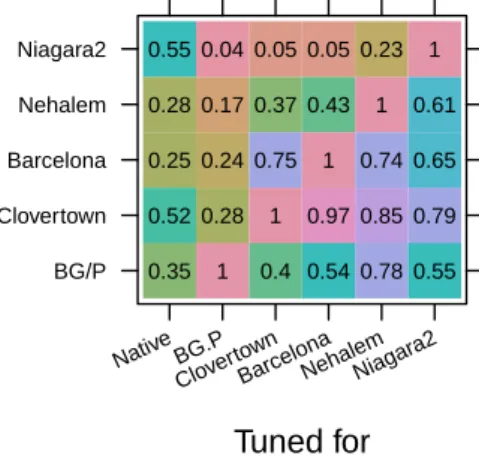
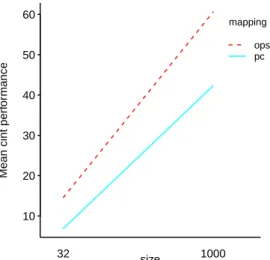
In a study by Bird201, a performance optimization expert took existing generic code from a library and created tuned versions for each of five different processors (IBM's Blue Gene P and four different members of Intel's x86 product line). The performance of the generic and all tuned versions of the code was measured on all processors. For example, benchmarking backup/recovery tools or desktop search applications requires realistic file system content (e.g. file system must contain realistic number of files, directory depth, disk fragmentation, etc.); reaching a position where it is possible to generate realistic file systems is a non-trivial task,16 let alone realistic file content attributes.1814.
What is actually being measured?
DESIGN OF EXPERIMENTS 363
Adapting an ongoing experiment
Selecting experimental options
32 1000ops
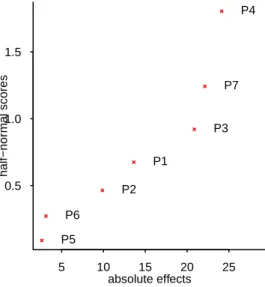
- Factorial designs
- BENCHMARKING 365
- Benchmarking
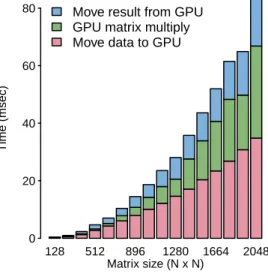
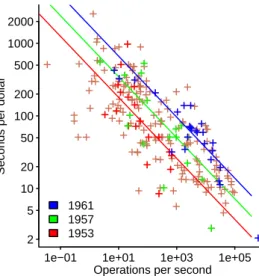
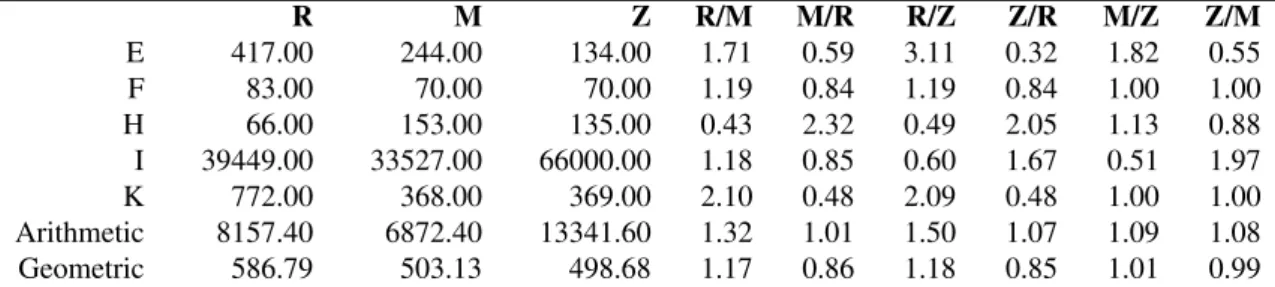
- BENCHMARKING 367 When comparing different systems, benchmark performance may be normalised to pro-
- Following the herd
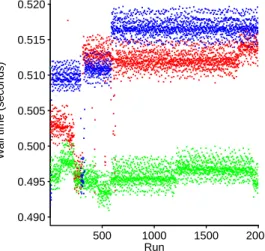
- Variability in today’s computing systems
- BENCHMARKING 369
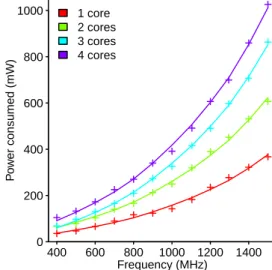
- discusses the building of mixed-effects models for power variations of the Intel Core processor
- BENCHMARKING 371
- BENCHMARKING 373
- SURVEYS 375
- Surveys
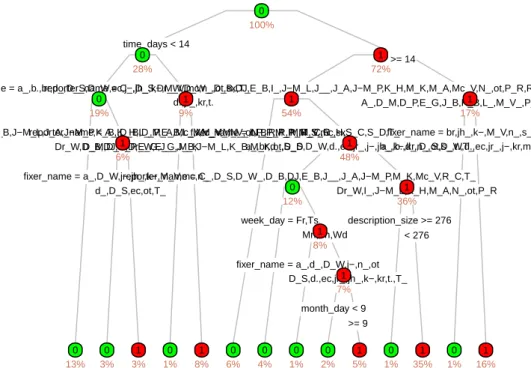
- discusses the analysis of ranked items, i.e., placed in a preferred order
Can.a.version.of.the.client.program.compiled.with.lib.1.0.jar.be.executed.with.lib.2.0.jar.1. Can.the.version.of.the.client.program.be.compiled.with.lib.1.0.jar.executed.with.lib.2.0.jar.2 Can.the.version.of.the.client.program.be.compiled.and .then.executed.with.lib .2.0.jar.2. Can.the.version.of.the.client.program.compiled.with.lib.1.0.jar.be.executed.with.lib.2.0.jar.3.
What.is.the.console output.if.the.client.program.version.compiled.with.lib.1.0.jar.is.executed.with.lib.2.0.jar. What.is.the.console output.if.the.client.program.version.compiled.with.lib.1.0.jar.is.executed.with.lib.2.0.jar.3.
Data preparation
- Introduction
- Documenting cleaning operations
- OUTLIERS 379
- Outliers
- Malformed file contents
- MISSING DATA 381
- Missing data
- Handling missing values
- RESTRUCTURING DATA 383
- NA handling by library functions
- Restructuring data
- Reorganizing rows/columns
- Miscellaneous issues
- Application specific cleaning
- Different name, same meaning
- MISCELLANEOUS ISSUES 385
- Multiple sources of signals
- Duplicate data
- Default values
- Resolution limit of measurements
- Detecting fabricated data
Perhaps all the vulnerabilities that had been reported but not yet fully patched were simply released, for the public to see, at the end of the year. The output below shows a count of the number of features recorded as completed, in a company using an agile process,1 for each day of the week. If there are one or more lines that do not follow the format selected at the beginning of the file (eg, different number of column delimiters; perhaps the result of unbounded strings, such as a pair of missing quote characters) , then subsequent values can appear in other columns, or be converted to another type.
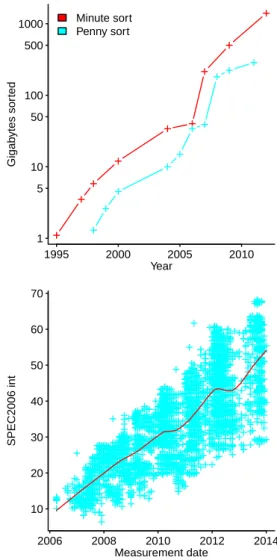
For example, the name of the developer who originally wrote the code referenced in a bug report might be missing if that developer is friendly with the person reporting the bug, with friendship not recorded in the sample. A quick and dirty method of imputing values that can be effective is to replace a missing value by the average of the values in the corresponding column containing the missing value;. The SPEC 2006 benchmark results often include a description of the characteristics of the memory used by the computer under test.
The character sequence oxo is common, and a look at some of the contexts in which this sequence appears shows that the use is mainly related to a chemical formula (some uses probably also refer to a cooking product of this name). Duplicate data is easy to create: comparing data from multiple sources can cause the same measurements to appear multiple times, or there can be multiple measurements of the same event (eg computer error logging where a single root cause produces the same message at intermittent moments after the experience errors1806 and spatially or functionally adjacent message-generating units;1132 see Github–data-check/Blue-Gene.log). When working near the resolution limit of the measurement process, spurious signals may arise due to the interaction between the measurement resolution and the processes that generate the measurement events.
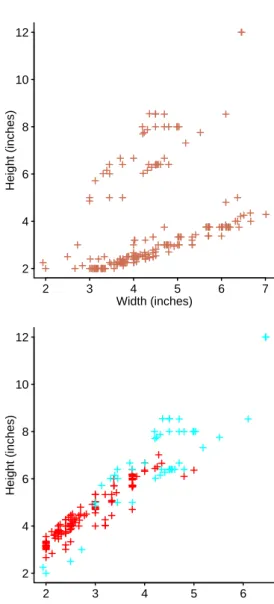
Initial analysis of the number of processes whose execution fell within a given time interval found unexpected behavior, there were many time intervals that contained no processes; see Figure 14.6, top plot. Further analysis revealed that the timer resolution was 1/64 second and the gaps were an artifact of the number of digits recorded, recording more digits (see Figure 14.6, lower graph) resulted in fewer intervals containing no measurement points . As always, the interpretation of why the data contain these patterns is the responsibility of the audience of the results; it is always worth repeating that domain knowledge is key.
Overview of R
- Your first R program
- Language overview
- Differences between R and widely used languages
- LANGUAGE OVERVIEW 389
- Objects
- Operations on vectors
- Creating a vector/array/matrix
- Indexing
- OPERATIONS ON VECTORS 391
- Lists
- Data frames
- OPERATORS 393 Where ever possible, the code written for this book uses the subset function, rather than
- Symbolic forms
- Factors and levels
- Operators
- OPERATORS 395
- Testing for equality
- Assignment
- The R type (mode) system
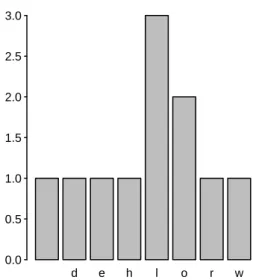
The plot function tries to produce a reasonable graphic of the data passed, which for character data is a histogram of the number of occurrences. All objects in the current environment can be saved to a file using the save function, and a previously saved environment can be restored using the load function. Like Perl, it is defined by how its single implementation behaves, ie. the software maintained by theRproject.1548.
When S was created, Fortran was the dominant engineering language, and Fortran's way of working heavily influenced early design decisions, ie. R does not have a C worldview; for example, it uses row/column instead of column/row. Object-oriented constructs were first added in the third iteration of the S language and were more of an addition to the functional flavor of the language than a complete overhaul. Operations involving NA returnNA when the result value is unknown because the NA value is unknown, but will return a value when the result is independent of the NA value, e.g. ON || RIGHT,.
The Rtype system has evolved over time and includes the terms mode (a higher level representation of the value representation, at least sometimes, than typeof, e.g. integer and double have mode numeric), storage.mode (a concept that goes back to the S language) and typeof (the underlying representation used by the C implementation of the language). The assignment operator creates an object, where the object name is the left operand and the value and type are those of the right operand (left/right is reversed when the -> . assignment operator is used). Multidimensional arrays can be created using the array function, with the usual case of two-dimensional arrays backed by a specific function i.e. the array function.
A list of operators and their precedence can be obtained by typing ?Syntax, at the R command line. The result of the indexx[1] has the same type asx, that is, the operation preserves the type), while the result ofx[[1]] is a simplified version of the type x (if simplification is possible. i. Theis.nafunction can be used to check for this quantity, that NAfunction returns TRUE, if its argument contains at least oneNA.
NULL
- Converting the type (mode) of a value
- Statements
- DEFINING A FUNCTION 397
- Defining a function
- Commonly used functions
- Input/Output
- Graphical output
- NON-STATISTICAL USES OF R 399
- Non-statistical uses of R
- Very large datasets
In the case of files, all the data in the file is often read and returned as a single object. Many functions try to automatically determine the data type of the data read, e.g. whether it is an integer, a real, a sequence of characters, etc. Sometimes the selected data type is incorrect and something needs to be done to ensure that the data is treated as having the desired type; read.
Some functions of the base system, e.g. read.csv, by default converts columns containing string values to factors; the original intention was probably to reduce the storage required to hold the data. The first line of the input file is assumed to specify the name of each column, with header=FALSE turning off this default behavior. All characters on an input line after, and including the comment character #, are ignored (various options interact with this behavior, including thecomment.charoption, which can be used to change the character used).
Theforeignpackage supports reading (and some writing) data stored in some binary file formats used by other applications, eg.read.spss. If the data is not already in a format that R can easily process, it may be easier to convert it using a language or tool you already know, rather than using R. By default, the graphical output is sent to a console device; this behavior can be overridden to create a file in a specific format eg.pdf,jpeg,pngandpictex.
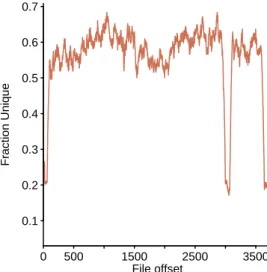
The behavior of the plot function can be affected by previous calls to the parfunction, which set configurable options. One technique to tell if a file contains compressed data (eg, a virus hidden in a script compressing it to look like a bunch of numbers) is to plot the fraction of distinct values that appear in blocks consecutive, fixed; see figure 15.2. The following code reads a pdf file, applies a sliding window to the data, and then plots the fraction of distinct values in each window (at a given offset).
An empirical study of the effect of time pressure on the cost-benefit ratio of regression testing. An empirical study of the reuse of software licensed under the GNU General Public License. External economies and economic progress: the case of the microcomputer industry. The Business History Review.