Chapter 1 (Tiepolo, Pezzoli and Tarchiani) assesses the state of implementation of the 11th Sustainable Development Goal in the tropics and the prospects, lines of research and challenges for revamping local planning to address climate change. Numerous people contributed to the creation of the 3rd UICCA Conference and subsequent book.
Introduction
We propose three areas of action to facilitate the integration of the recommendations into a tropical context. This highlights what is missing in the incorporation of the United Nations recommendations.
Materials and Methods
UNDESA data allow us to identify the inhabitants of the tropics only for settlements of 0.1-0.3 million inhabitants. As a result, we have prepared a special database derived from the national population censuses of tropical countries.
Results
- Future Climate Planning According to the UN Vision
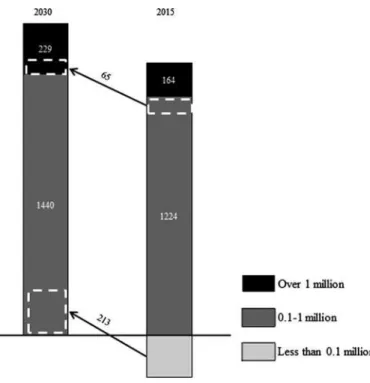
- Importance of the Tropical Human Settlements
- Relevance of the Effort Required
- Basic Information for Analysis
- Planning
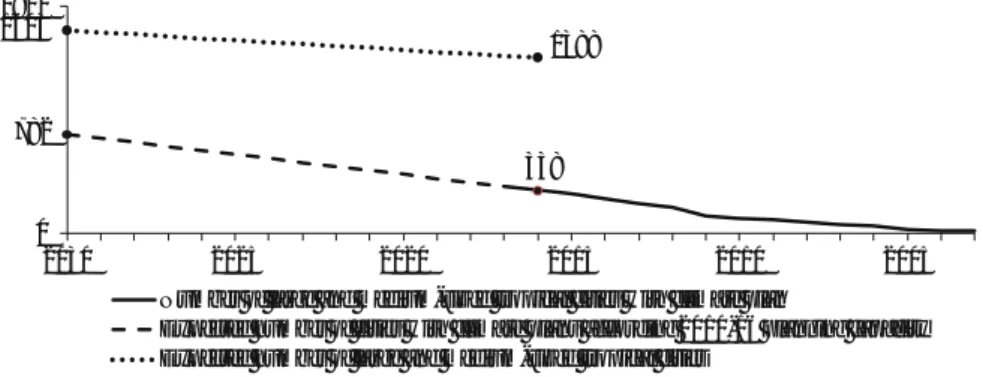
If climate planning manages to maintain the pace of the last seven years to plans/year), the number of cities with climate plans will increase from today's 25 to 47%. This is considered a compact (low-carbon) urban form, which is not recommended where density is already high (Tiepolo and Braccio 2017).
Discussion
The first obstacle is the lack of experience with urban climate planning in the half of cities that do not currently have a climate plan. The process of prioritizing measures is based on potential impact only in mitigation plans.
Conclusions
Contribution of Working Group III to the Fifth Assessment Report of the Intergovernmental Panel on Climate Change, ed. Relevance and quantity of climate planning in large and medium-sized cities in the tropics.
Introduction
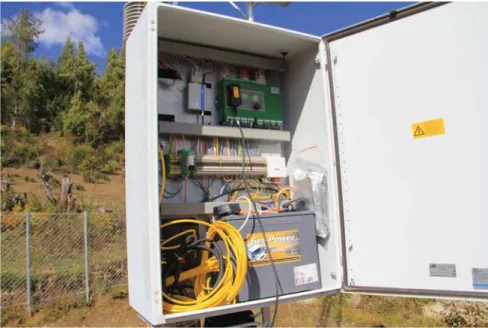
The effectiveness of the results depends mainly on the accurate choice of the places of installation (network plan), on the correct choice and description of instrumentation type to prepare the international tenders, on the training process to improve the AWS's management efficiency. The effectiveness of the results depends mainly on the sensors/system selection (technical specifications), the accurate choice of the places of installation and the evaluation of the observation network sustainability (economic and technical).
Why RAWS?
Examples of RAWS networks are HKH-HYCOS (Regional Flood Information System Hindu Kush Himalayan Region (http://www.icimod.org/hycos), SHARE (Station at High Altitude for Research on the Environment), SNOTEL (Snow Telemetry, http://www.wcc.nrcs.usda.gov/snow/), THAMO (Trans-African HydroMeteorological Observatory (www.thamo.org). It includes the Global Observing System (GOS), the observing component of the Global Atmosphere Watch (GAW), the WMO Hydrological Observing Systems (including the World Hydrological Cycle Observing System (WHYCOS)), and the observation component of the Global Cryosphere Watch (GCW)—(https://www.wmo.int/pages/prog/www /wigos/wir/index_en.html).
Transition from Manual to AWS
The WMO Integrated Global Observing System (WIGOS) aims at improved cooperation and coordination between NMHSs and relevant national and regional organizations. In recent years, many AWS manufacturers have improved their products, allowing researchers, field assistants, and operators to create unattended data collection with multiple options depending on the application.
RAWS Con fi guration and Requirements (Technical Speci fi cations)
The sensors and platform used should be suitable for remote diagnosis and troubleshooting in order to avoid frequent inspection visits. AWS Appliances. The cost of data loggers and communication devices has come down drastically with recent advances in electronic technologies, BUT the devices, which can work over an extended temperature range, are still expensive.
Data Transmission
These paths exist in the 80-120 km region of the earth's atmosphere and reflect RF energy between two stations. The height of the paths allows communication over the horizon at distances of up to 2000 km.
RAWS Management
To help improve AWS management, I would recommend the following to those responsible for the observation network. To officially appoint local agent/company for the maintenance of the AWSs of the monitoring network, at least in the initial phase.
Low-Cost RAWS: A Suitable Choice?
More advanced research institutes or public organizations tend to build AWS based on very cheap acquisition boards (e.g. Arduino, Raspberry) that offer a large number of options and devices (multiplexer, Wi-Fi boards, GPRS modem, application notes, developed by the community). Adopting a low-cost approach for remote location meteorological monitoring deserves attention as it can integrate conventional networks that provide useful information not otherwise available.
Conclusions
Proceedings of the International Workshop on "Automated Weather Stations for Applications in Agriculture and Water Resources Management: Current Use and Future Prospects". In Proceedings of the International Workshop on "Automated Weather Stations for Applications in Agriculture and Water Resources Management: Current Use and Future Prospects".
Introduction
The country faced heavy losses due to increased floods and drought episodes in the last decade. We consider a bottom-up approach to the process of adaptation to climate change as a key to the effectiveness of the measures.
Materials and Methods .1 Current Conditions
Standardized Precipitation Index (SPI)
The SPI index is recommended by the World Meteorological Organization (WMO) to be used by all national meteorological and hydrological services worldwide to characterize meteorological droughts (WMO2012). Since SPI is normalized, wetter and drier climates can be represented in the same way.
Future Climate Scenarios
To assess how realistic the models are in simulating the rainfall distribution in the Tillaberi region, we perform a comparison analysis with CHIRPS v. This method has the advantage that GCM-corrected series have an annual amount of rainfall that is consistent with the rainfall estimate. value.
Results
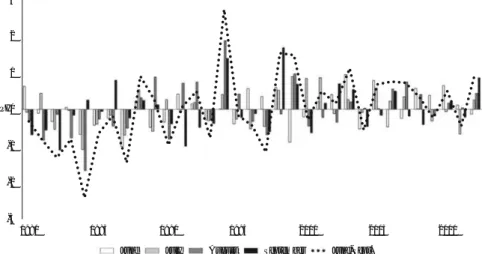
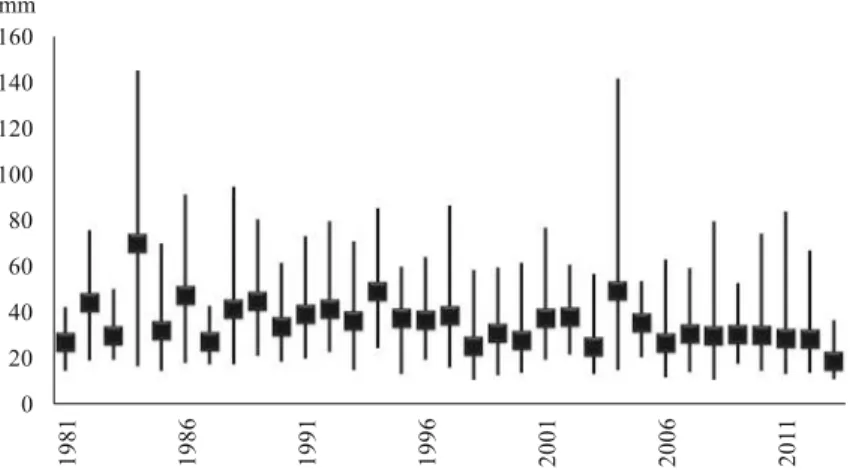
Standardized Precipitation Index
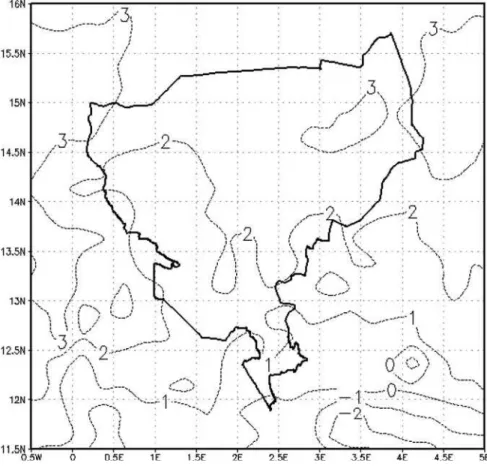
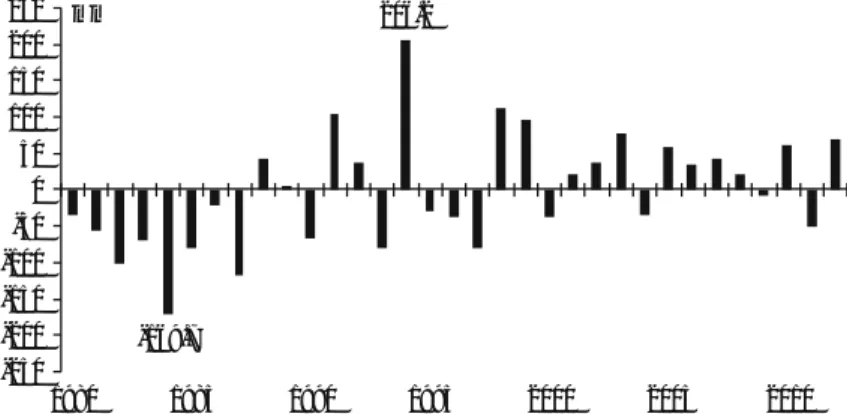
We could link the June SPI to the annual variation of the initial strength of the rainy season. September marks the end of the rainy season, and in the time series the SPI values for this month show a slight trend towards wet conditions.
Future Scenarios
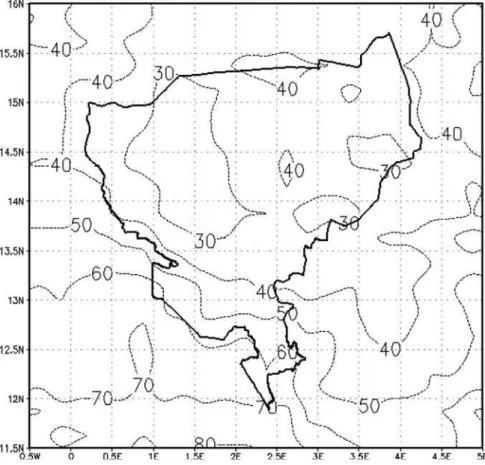
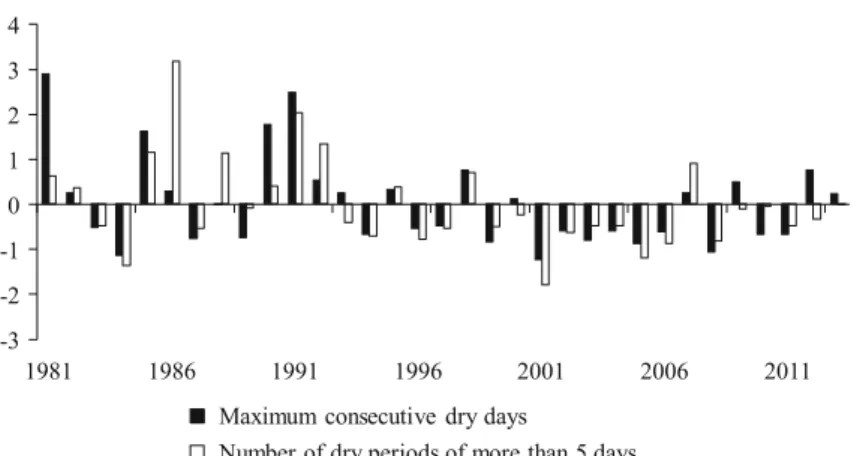
The map (figure 3.4) shows that we can expect an increase in the number of periods of more than 5 dry days between 0.5 and 1.5 in the Tillaberi region. We performed the same analysis with the highest amount of precipitation in 1 day and evaluated the changes in the most intense phenomena (Fig. 3.6).
Conclusions
The GCM outputs show a consistent increase in very intense precipitation events and an increase in the highest one-day precipitation amount. Change in the Hydrograph of the Sahel Rivers: The Case of Recent Red Floods of the River Niger in the Niamey Region. Global and planetary change.
Introduction
The analysis focuses on the critical aspects that determine the final yield of rice, such as: water availability in the (i) plant germination and (ii) flowering phases, and (iii) the dynamics of the rainy season. To bridge this gap, the study aims to produce a quantification of the climate risks to rice crops in the region.
Materials and Methods
Climate Extremes
The approach is useful in describing the climate context as it provides a quantitative estimate of the probability that an extreme event will occur. Therefore, if an estimate of the maximum annual consecutive drought period for a 20-year return period is required, the result of T = 20 years in the formula is an estimate of the probability of an event with a 20-year return period.
Growing Season
Rainy season start and end dates were determined for each year using methods for the CHIRPS daily precipitation estimate data set. The linear regression coefficient evaluated from the three values for each grid point in the domain allowed us to plot the current dynamics in the modulation of the growing season in the Casamance region.
Results
Rice Crop Germination
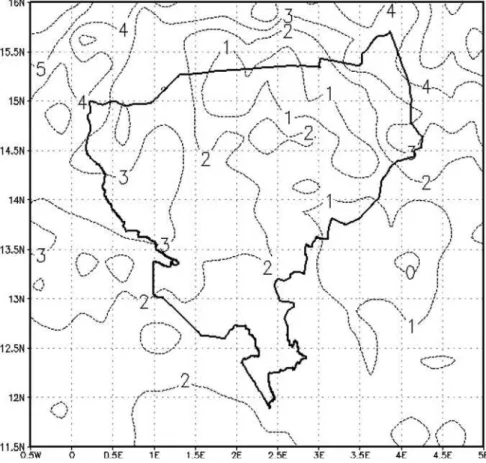
In the eastern part of the Kolda region, very long episodes of drought conditions seem to never occur normally. The map shows that values of more than 80 mm/day can be reached in 1 year every 20 in the central part of the Middel-Boere Casamance.
Rice Crop Flowering
The probability of having an average of 1.2-1.4 periods of 5 consecutive dry days per year is almost normal, while over 20 years one can expect 2.4-2.8 dry periods per year with an uneven distribution in the Middle Kazamana region and Upper. Episodes of consecutive dry days give a chance of 9-11 consecutive days as normal, while with a 20-year return period it is possible to reach 14-20 days.
Growing Season
In general, Casamance shows a slightly increasing trend in the length of the growing season. In the Sédhiou region in particular, maximum values are observed, resulting in an increase in the length of the growing season of 0.3 days per year.
Discussion
Instead, the intercept signal is weaker at the beginning of the growing season and shows an unclear trend in the region. This could be linked to the current variability of the onset of the West African monsoon.
Conclusions
Spatial and temporal variability of rainfall in the Sahel and its effects on farmers' management strategies.Journal of Arid Environments. Specifically, a vulnerability index and a population responsiveness index of three Woredas in the Oromia region of Ethiopia were determined and analyzed.
Introduction
Climate Change, Vulnerability and Resilience
It is well known that rural poverty increases as it increases elsewhere, and the projected situation is more difficult for the remote rural areas of the global south (often already poor), where people lack resources to fall back on. An innovative method is therefore explained, to evaluate the danger and effect of climate change on the drought in Ethiopia using the vulnerability analysis, with a deeper study of the system and the property of concern.
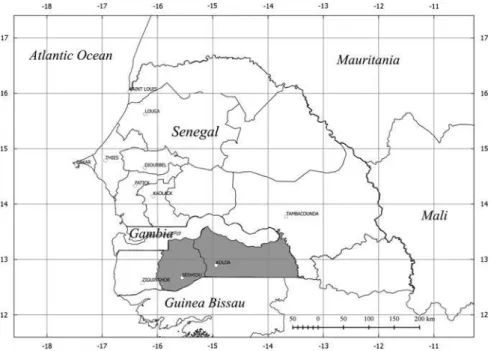
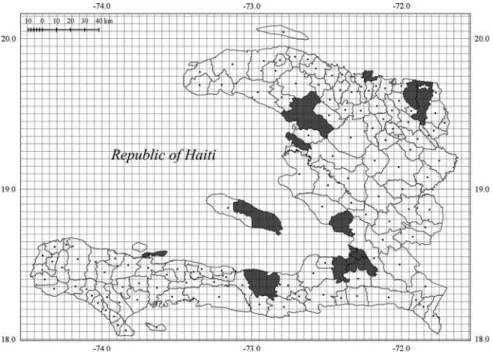
Area of Study
The aim of this work is to analyze the vulnerability and resilience of the population in the Oromia region (Ethiopia) using the database of the NGO LVIA (created with the Food Security Questionnaire) investigated by three students of the University of Turin (Department of Agriculture, Forestry and Food, Department for Culture, Politics and Society and the Department of Territory of the University of Turin) during a three-month phase in Ethiopia in the summer of 2015.
Geographic Description and Social Conditions of the Oromia Region
The Region is located in a drainage basin (the second in the country in terms of size) and has a considerable amount of water. Nevertheless, the area is very vulnerable to the changes in precipitation distribution, because the current management system cannot provide sustainable access to water for the population (LVIA2015).
The Analysed Woredas: Siraro, Shalla and Shashamene
Method and Materials
Interviews
The interview was submitted to at least two of the seven members of the committee. Community maps were followed by interviews with the head of the village, with the water committee and with a group of women.
Analysed Indicators .1 Vulnerability
- Vulnerability and Resilience Macro-Indicators
- Demographic Exposure
- Resilience
- Capacity to React to Vulnerability
The value of the indicator was found as the normalization of the number of cultivated varieties. Thanks to the sale of part of the cattle, households can cope with natural shocks.
Results and Discussion
The areas where the value of the capacity to respond to vulnerability is high show critical conditions for population.
Vulnerability Classes and Maps
Resilience Classes and Maps
However, it should be noted that low resilience indices are also present in the other two Woredas, as confirmed by other authors (Deressa et al.2006, DRMFFS2016). For Shashamene Province, this fact can be attributed to a higher population density in its territory and therefore to a higher social exposure which makes this Woreda more vulnerable than the others.
Capacity to React to the Adversities Classes and Maps
In a normalized scale between 0 and 1, in this study the calculated annual SPI index was 0.83: the area is therefore significantly exposed to the drought risk, which is caused by a high intensity and frequency of lack of rainfall.
Conclusions
If there is no or limited water source in the compound, specify the distance (km) from the main source used by the HH___. Contribution of working groups I, II and III to the Third Assessment Report of the Intergovernmental Panel on Climate Change ed.
Introduction
Sensitivity (S) is "The degree to which a system or species is affected, either adversely or beneficially, by climate variability or change. Adaptive capacity (AC) is "The ability of systems, institutions, people and other organisms to adapt to potential damage, to take advantage of opportunities, or to respond to consequences." (IPCC.
Metodology
- Identi fi cation of the Open Data
- Indicator Performance
- Selection Criteria for the Set of Potential Indicators
- Identi fi cation of the Indicators
- Robustness and Applicability of the Index
Thus, according to the recommendations of the World Meteorological Organization, we calculated the Standardized Precipitation Index (SPI) (WMO 2012). Then these values are normalized on a scale of 0-1 based on the minimum and maximum values.
Results and Discussion
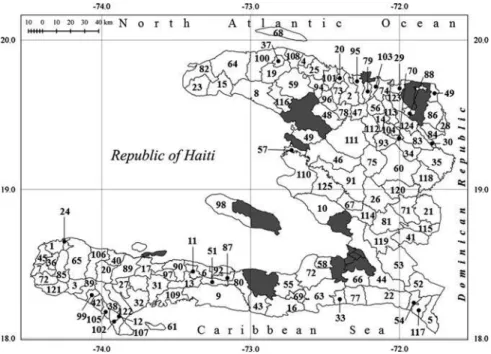
The calculation of the VICC allows for further consideration of individual components, starting with exposure. Table 6.1 Haiti VICC open data compared to other conventional CC vulnerability assessment surveys.
Conclusions
Vulnerability of municipalities to climate change and climate-related events in Mexico. Policy Research Working Paper 6417. Vulnerability of the South African Agricultural Sector to Climate Change and Variability: An Indicator Approach.
Introduction
On the other hand, DRR also includes short- and medium-term actions, such as the implementation of prevention and preparedness actions to reduce damage resulting from approaching hazardous phenomena (Eiser et al.2012). Finally, geospatial information technologies offer the opportunity to effectively reduce costs, both in terms of time and financial resources, required to conduct in situ spatial surveys (Cay et al. 2004).
Data and Method
Hazard Assessment
The first step in assessing the extent of hazardous hydrometeorological events is the calculation of accumulated rainfall over the area of interest. Threshold values must be defined in advance to provide a warning message when a hazardous hydrometeorological event is approaching and/or affecting a specific geographic area.
Integration of Exposure Information
Once the accumulated precipitation has been calculated, the second step is to determine extreme precipitation thresholds, which can be defined as the amount of precipitation that can cause a "disaster" (such as flooding, landslides, etc.). In this methodology, a statistical meteorological approach has been taken to derive national and regional percentile values.
Generation of Risk Warnings
Case Study
Results
The intersection of populated place layers and extreme rainfall alert layers allows immediate identification of villages and towns alerted within each district. An alert level has been attached to the villages contained within each pixel in the extreme precipitation grid layer.
Conclusions
Special Report of Working Groups I and II of the Intergovernmental Panel on Climate Change (IPCC), ed. 2014. Contribution of Working Group II to the Fifth Assessment Report on Climate Change 2013: The Physical Science Basis.
Introduction
The Area of Interest
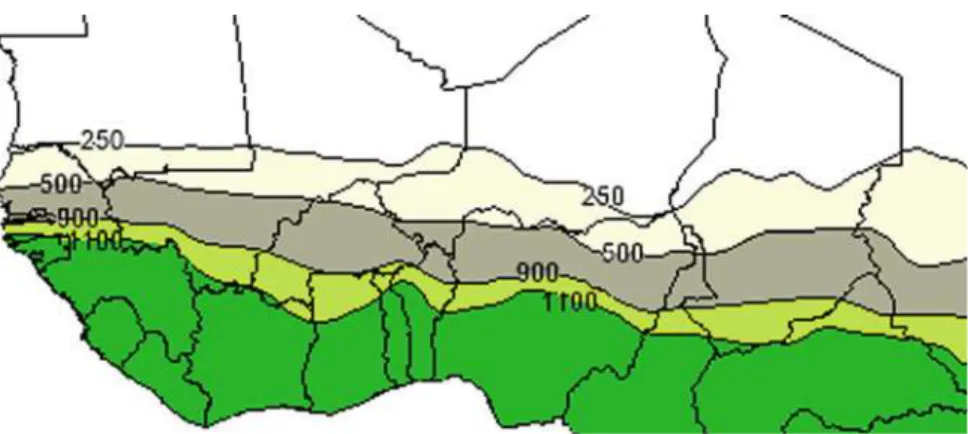
In the northern part of the region, which is very sensitive to climatic variations, millet is the most widespread crop, with a cycle length of between 70 and 90 days, depending on the variety. Even if the drought resistance of this crop is naturally high, the susceptibility to water stress increases sharply in the period just after sowing: interruption of rainfall after the start of the rainy season can cause the death of seedlings (Kleschenko et al., 2004 ).
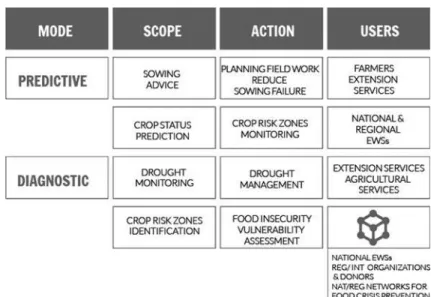
Evolution of Early Warning Systems for Food Security in the Sahel
Multidisciplinary Working Groups (MWGs) led by National Meteorological Services (NMS) play a strategic role in the operation of national EWSs, especially during the rainy season.
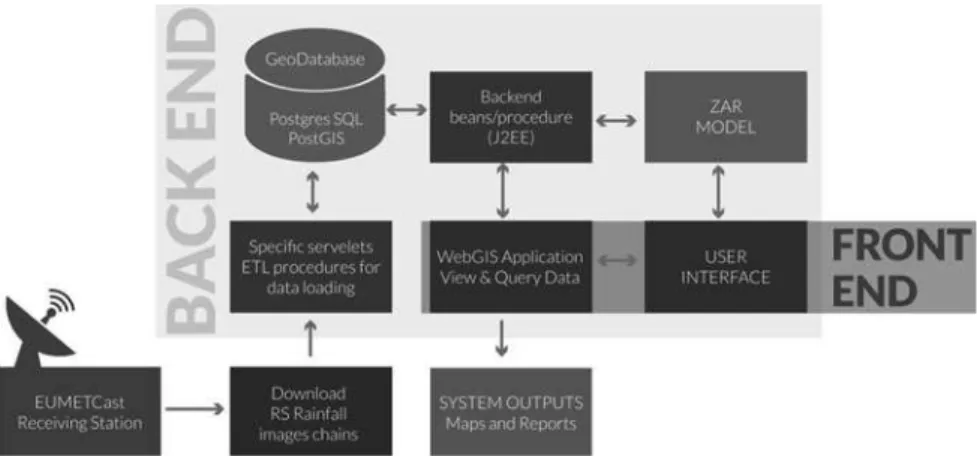
An Open Source Geoprocessing Tool for Drought Monitoring
The accuracy of the ZAR model was validated with field data collected in 2006 and 2007 in Mali, Niger, and Senegal as part of the AMMA2 project supported by the National Meteorological Service (Bacci et al. 2009). It provides an overview of successful sowing dates and shows areas where sowing may have failed due to lack of water.
Results and Discussion
An early identification of crop risk areas represents a key step in providing a preliminary evaluation on the dimension of expected food crises (local, national, regional) in order to alert national and international institutions responsible for their prevention and management (Vignaroli et al. 2009) ). This information is particularly important at this time, which is characterized by high uncertainty and anxiety for farmers (Roudier et al. 2014).
Conclusions
In AARSE 2006: Proceedings of the 6th AARSE International Conference on Earth Observation and Geoinformation Sciences in Support of African Development, 30 October – 2 November 2006, Cairo, Egypt: National Authority for Remote and Space Science (NARSS). . Onset of rainy season and farmers' planting strategy for pearl millet cultivation in South West Niger.
Introduction
The Socio-economical Analysis
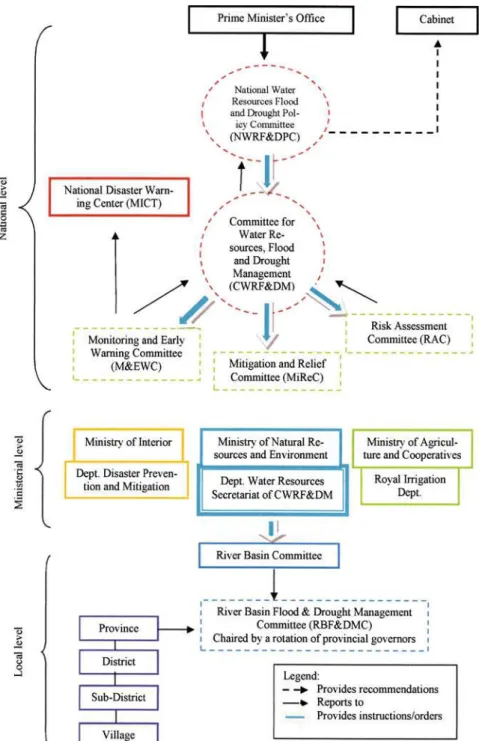
Section 9.3 describes an overview of the institutional framework governing water resources and disaster management at the national level. Ideal institutional and policy adjustments will be proposed for each of the four steps, in particular by analyzing the transition from the national to the local level in the first step.
Thailand and Increasing Threat of Drought
Finally, Section 9.7 will address the potentials and critical challenges of the proposed framework through a critical lens, reflecting on the actual feasibility of its application and also considering the possibility of extending the framework to (but not only) the regional level. The concentration of manufacturing and industrial areas is around Bangkok and in the eastern part of the country.
Method and Materials
In particular, some parts of the country, such as the northeastern region and the central plains, can be considered hotspots for drought issues. Some information was also gathered through participation in international conferences and workshops, such as the ASEAN Drought Workshop and the SUMERNET Regional Assessment Workshop on Water Scarcity and Drought Management in the Mekong Region, and through personal discussions with colleagues and experts who met in Bangkok .
Water Resources and Disaster Management Institutions and Mechanisms in Thailand
The Office of the National Water Resources and Floods Board (ONWF), which acts as the secretariat for both boards and serves as a single command authority (ADB2013). A key success in introducing the integrated water resources management process in Thailand has been the establishment of River Basin Committees (RBCs).
Drought Management in Thailand: Laws, Policies, Strategies, Plans
Climate change is a cross-sectoral issue, well recognized in Thailand's policies as demonstrated by the 2000 Initial Communication under the UNFCCC and by the. According to this Act, a National Disaster Prevention and Mitigation Plan promulgated in 2009 represents the national policy framework for disaster management within which all other lower level plans must be formulated.
An Institutional/Organizational Framework to Include Water-Related Disaster in Ordinary Water Resources
- Establish a Drought Committee and Related Organizational Arrangements
- Ingredients to Develop a National Drought Risk-Based Management Policy
- Drought-Related Data Inventory and Gaps Identi fi cation
- Developement and Update a Drought Management Plan
Since drought is primarily a water resource management issue, we argue that the Ministry of Interior's mandate for drought management should be shared equally. Rather, a reform could be proposed of the current4National Water Resources and Flood Policy Committee (NWRFPC) and the Committee for Water Resources and Flood Management (CWRFM), established by the Water Resources Master Plan following the devastating floods of 2011.
Challenges and Opportunities for Thailand