7] summarized a review of recent worldwide developments in the use of fiber optic sensors (FOS) in asphalt pavement monitoring systems;. Fundamental approaches to predicting moisture damage in asphalt mixtures: a review of the state of the art. Infrastructures 2020, 5, 20.
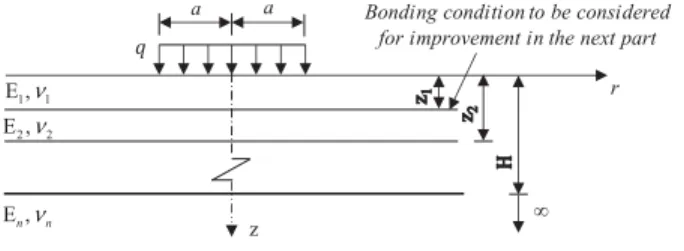
Numerical and Experimental Investigations of Asphalt Pavement Behaviour, Taking into Account
- Introduction
- Analytical Solution Background and Improvement 1. Analytical Solution Background
- Sensitivity Analysis
- Evaluation of Pavement Interface Bonding Condition in an Experimental Case Study
- Conclusions
This is then improved by introducing a shear response modulus to take into account the bond state of the interface between the pavement layers. These investigations, where the bond condition at the interface of the asphalt layers was taken into account, are presented respectively in the following paragraphs 3 and 4.
Fundamental Approaches to Predict Moisture
Damage in Asphalt Mixtures: State-of-the-Art Review
Concepts to Calculate the Bitumen–Aggregate Adhesion
Therefore, twice the surface energy of bitumen is related to the cohesive strength or binding energy of bitumen. The Hamaker equation (equation (11)) consists of two parts: the first part describes the polar contribution and the second part – the dispersive contribution.
Summary of Experimental Studies Based on SFE Approach 1. Overview of Test Procedures to Determine Surface Energies
In the latter study, the effect of the choice of probe fluids on the accuracy of the SFE determination was investigated. 22] noted that differences in the water sensitivity tests could be explained by the water absorption and mineral compositions of the aggregates.
Summary of Experimental Studies Based on the Hamaker Approach
In this paper [32], the ranking of the field performance of some aggregates, extracted from literature data [80], corresponded to the ranking based on the calculation of the Hamaker constant. In the paper, adhesive and cohesive energies were compared, based on the index of refraction of the aggregate.
![Figure 3. High refractive index value for aggregates and minerals classified according to their degree of resistance to stripping (P—poor, F—fair, and G—good) [65,80].](https://thumb-ap.123doks.com/thumbv2/1libvncom/9201538.0/43.723.145.577.462.723/figure-refractive-aggregates-minerals-classified-according-resistance-stripping.webp)
Recycled Waste Powders for Alkali-Activated Paving Blocks for Urban Pavements: A Full
Laboratory Characterization
Materials and Methods
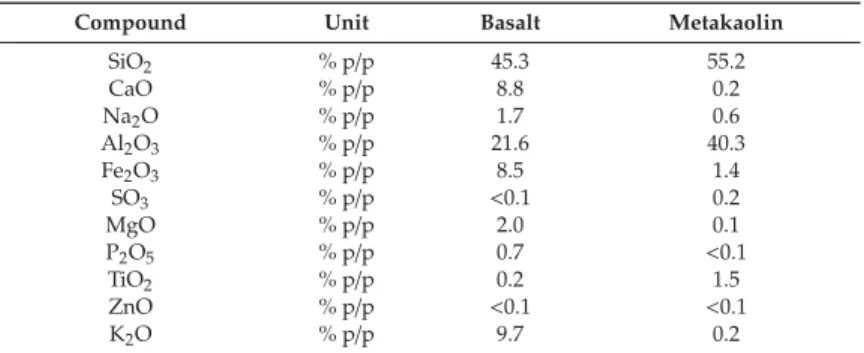
Thus, the properties of the activators and precursors are fundamental to the quality of the final alkali-activated material (AAM). According to the chemical composition of M, it is often used to improve the mechanical and durability properties of the final product [46].
Alkali-Activated Material Characterization
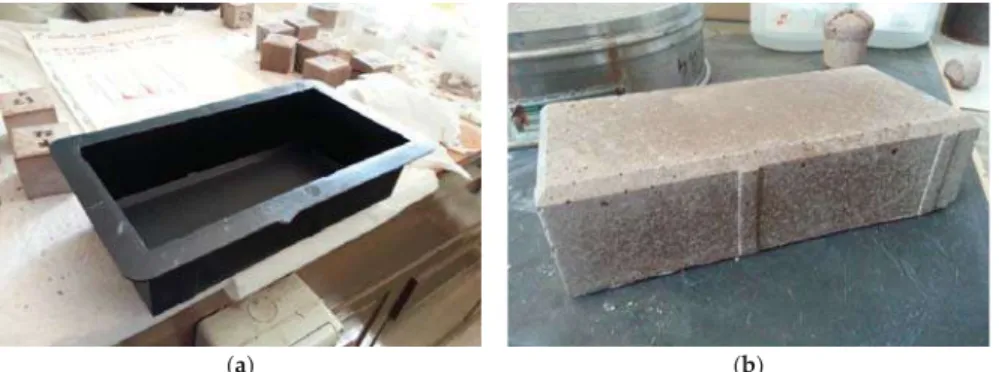
The material is molded in plastic rectangular, specifically for the production of interlocking modular elements. This European Standard identifies the material requirements and the test protocols and methods for concrete paving blocks.
Paving Blocks Characterization
However, visual inspection of the pavers highlighted the presence of a small amount of surface bubbles. Tensile splitting strength is the only test required by the EN 1338 standard (Annex F) for the mechanical characterization of concrete pavers.
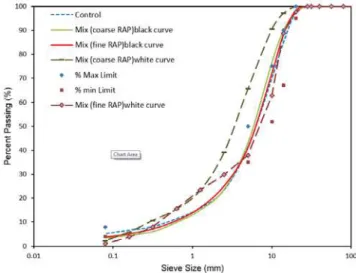
Characterization of Asphalt Mixtures Produced with Coarse and Fine Recycled Asphalt Particles
Research Goal, Scopes, and Objectives
In summary, it can be concluded that the coarse and the fine RAP fractions have relatively similar stiffness, but their contribution to the new mix is different. Previous studies have shown that in high RAP content mixtures, the amount of binder (or mastic) that would disperse into virgin binder from the fine RAP particles is less than that from the coarse RAP particles. This research aims to characterize the mixtures produced using the fine RAP and Coarse RAP in terms of stiffness, fatigue cracking, permanent deformation and thermal cracking resistance.
Materials and Experimental Methods
Table 1 presents the summary of the virgin and aged binder contributions in the fine and coarse RAP mixtures. The preconditioning helps in reducing differences due to the installation of the samples in the mold. 41] assumed transition temperature (Tt) as the temperature where axial stress reaches 50% of the breaking strength.
Results and Discussion
Figure 22 shows the master curve of the phase angle for the mixtures investigated in this study. Investigation of the impact of Rap gradation on the effective binder content in hot mix asphalt. Laboratory Study of the Effect of RAP Conditioning on Thermomechanical Properties of Hot Mix Asphalt Containing RAP.Mater.
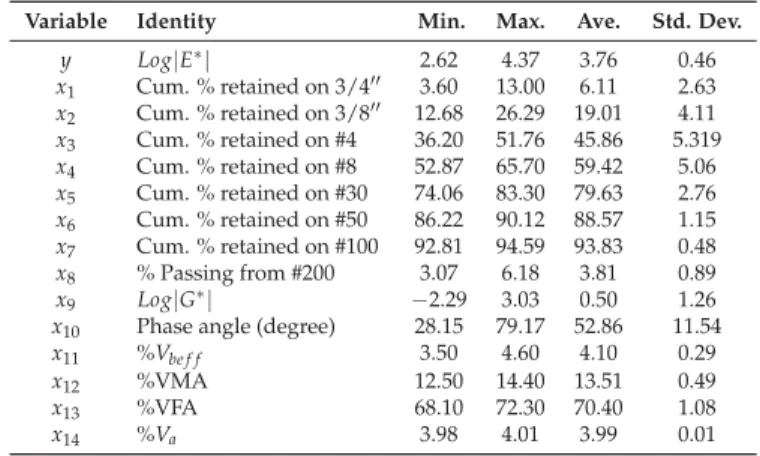
Principal Component Neural Networks for Modeling, Prediction, and Optimization of Hot Mix Asphalt
Material and Methodology
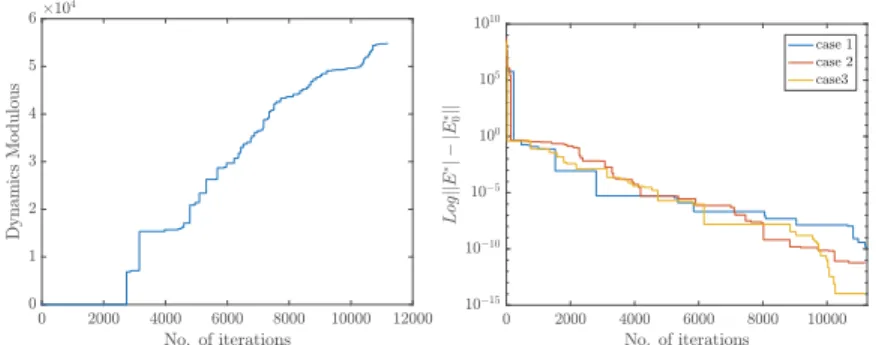
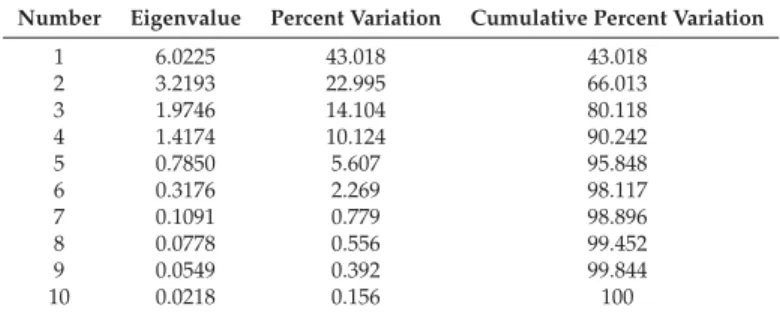
In multivariate statistics, PCA is an orthogonal transformation of a set of (possibly) correlated variables into a set of linearly uncorrelated variables, and the uncorrelated (pseudo) variables, called principal components (PCs), are linear combinations of the original input variables. To perform PCA in this study, we used eigenvalue decomposition of the correlation matrix of the data. This algorithm was used to find two enclosing ellipsoids in the primary space (14-dimensional) and pseudo-space (5-dimensional) of the dataset.
Developed Model Results, Performance, and Validation
Comparisons of PCR and PCNN performance with that of existing predictive models are performed based on three statistics: mean difference (AD), mean absolute difference (AAD), and correlation between measured and fitted response values (rf it). A summary of the definitions of these statistical components and their formulas is presented in Table 5. A graphical comparison of the performance of PCR and PCNN and existing models is presented in the next section.

Application of the Framework: Flexible Pavement Design and Optimization
The performance of the proposed models was compared with existing predictive models using both statistical analysis and ROC analysis. InDevelopment of the 2002 Guide for Design of New and Rehabilitated Pavement 451 Structures; NCHRP: Washington, DC, USA, 1999. Jamrah, A.; Kutay, M.E.; Ozturk, H.I. Characterization of Asphalt Materials Common to Michigan to Support Implementation of the Mechanistic-Empirical Pavement Design Guide; Technical report; Transportation Research Board: Washington, DC, USA, 2014.
Synthetic Aggregates for the Production of Innovative Low Impact Porous Layers for Urban Pavements
Introduction and Objective
It is today well known the improvement in the mechanical properties of the final mixture that is conferred by the presence of metakaolin [31]. The activators are necessary to create a highly alkaline atmosphere to develop the synthesis of the material. As suggested by the well-established literature in the field of alkali-activated material, the assessment of the mechanical properties was based on the assessment of the compressive strength of the alkali-activated mixture.
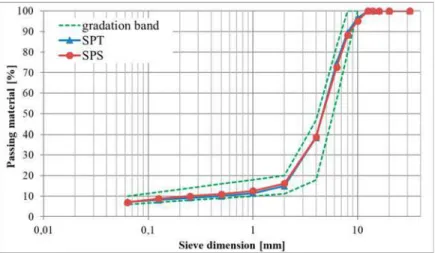
Mixtures Characterization 1. Mixture’s Details
To verify the quality of the mixture design, the air void content (Av) (EN) was evaluated for the two experimental mixtures. The higher Av content for the SPS mixture is probably related to the rounded shape of the handmade artificial aggregates. The most common measure of skid resistance is given in terms of pendulum test value (PTV, EN 13036-4) using the British portable pendulum.
Conclusions
Nevertheless, an optimization of the grading distribution can improve the macro-texture of the material. Nevertheless, considering the significant porosity of the two mixtures, the air void interconnection needs to be improved. State of the art on the development of cool coatings for buildings and cities.Sol.
Fiber Optics Sensors in Asphalt Pavement
State-of-the-Art Review
Testing Methods and Technologies
However, the accuracy of the results (stresses and strains at critical locations in the pavement) depends on the assumptions used for the analysis [30]. Accurate measurement of pavement response distributions (strain and stress) in the pavement structure, combined with temperature, is critical to understanding pavement behavior and modeling pavement failure [ 32 ]. The FBG sensors were placed next to the pavement board, which is usually not easy to compress.
![Figure 2. Strain sensor based on the Fabry-Perot (FP) interferometer (figure is reproduced from OpSens Solutions [36]).](https://thumb-ap.123doks.com/thumbv2/1libvncom/9201538.0/124.723.219.506.447.609/figure-strain-sensor-interferometer-figure-reproduced-opsens-solutions.webp)
Discussion
The tensile stresses induced at the bottom of the asphalt concrete layer were measured with two different fiber optic strain gauges (asphalt concrete cores and slab). Tensile stresses increase near the surface and near the interface, but decrease at the bottom of the layers. The measurements showed that at high temperatures (above 30◦C) high stress levels (150με) are measured at the bottom of the bituminous layers.
Sensitivity of the Flow Number to Mix Factors of Hot-Mix Asphalt
Materials
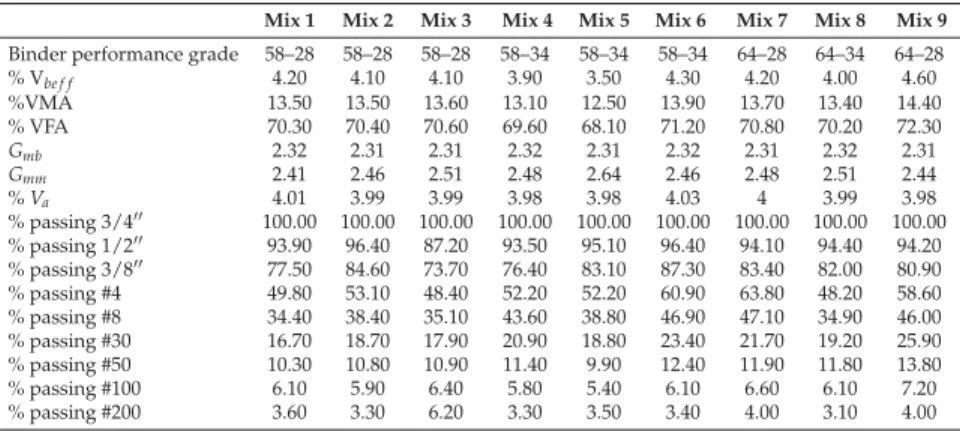
The eleven types of blends examined are listed in Table 2, along with their basic information, such as nominal maximum aggregate size (NMAS), binder type of performance class (PG), and number of turns used in designing the blends. Superpave's performance rating is reported using two numbers: the first is the average seven-day maximum road surface temperature (◦C) and the second is the minimum design surface temperature likely to be experienced (◦C). Thus, a PG 64-22 is intended for use where the average seven-day maximum road surface temperature is 64◦C and the expected minimum road surface temperature is −22◦C.
Effects on the Flow Number 1. Same Mix by the Same Contractor
- SMA PG 76-28
The current mix had an average flow number of 59; therefore, this mix is considered good for traffic between 3 and 10 million ESALs. The current mix had an average flow number of 99; therefore, this mix is considered good for traffic between 3 and 10 million ESALs. The current mix had an average flow number of 112; therefore, this mix is considered good for traffic between 3 and 10 million ESALs.

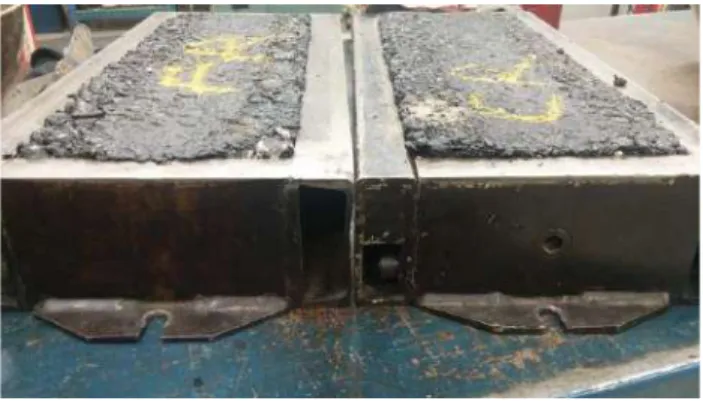
Determination of Layers Responsible for Rutting Failure in a Pavement Structure
Results
This is evident from the pushing and overturning of the asphalt, which is clearly seen in figures 10 and 12. The asphalt profile is almost equivalent to the underlying layers, and there is little or no pushing and/or overturning of the asphalt. After the validation, the profile analysis was carried out on sections of the Chibuluma and Kitwe-Chingola roads.

Discussion
Gradations: An increase in the -75 micron fraction of the mix will tend to stiffen (increase viscosity) the binder. Determining which of the coating layers is responsible for the failure is the first step in correcting the problem. In Proceedings of the 9th Conference on Asphalt Pavements in Southern Africa, Gaborone, Botswana, 2-5 September 2007;.
Characterization of Recovered Bitumen from Coarse and Fine Reclaimed Asphalt Pavement Particles
Results and Discussion 1. Bitumen Performance Grade (PG)
Regarding the coarse and fine RAP before and after mixing with virgin bitumen, there was a big difference from FR to FRM. Figure 5 shows the 2S2P1D Cole-Cole plot of the shear complex modulus at different temperatures and frequencies for all recovered bitumen from CR, CRM, FR, FRM and control mix. This was probably because the microstructure of the bitumen was hardened by aging and the molecular mobility was reduced.

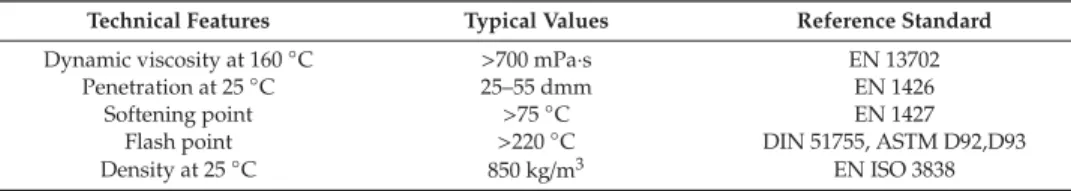
Peat Fibers and Finely Ground Peat Powder for Application in Asphalt
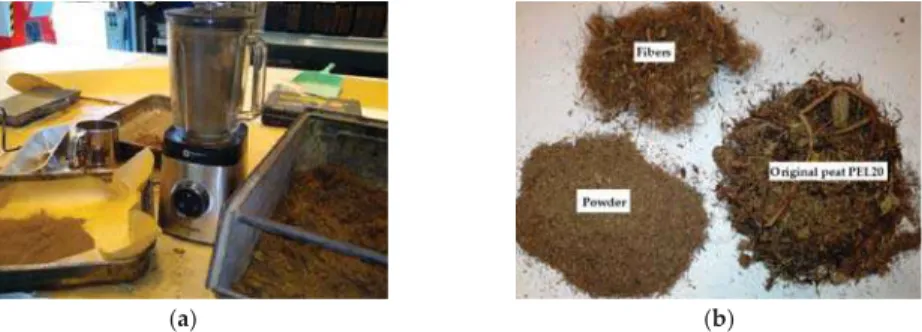
Materials and Methods 1. Materials
The density of peat fibers and powders was determined according to standard NBN EN 15326+A1 [19]. These images give an indication of the variation in the shape and size of particles and fibers. The same mixture composition was used for all measurements as in the drainage tests.
Results and Discussion
Furthermore, there were no differences in the spectra of the dust and fiber fractions, indicating that the two fractions are chemically identical. The formation of a plateau modulus at low frequencies in the fiber-modified samples was further investigated. Direct mixing of peat fibers with hot aggregates and filler before adding bitumen does not ensure a uniform distribution of fibers in the asphalt mixture.
![Figure 7. Weight losses of peat during drying (weight loss compared to the as-received sample) [24].](https://thumb-ap.123doks.com/thumbv2/1libvncom/9201538.0/181.723.175.549.296.487/figure-weight-losses-drying-weight-compared-received-sample.webp)
A Comparative Study of Laser Doppler Vibrometers for Vibration Measurements on Pavement Materials
Then, to compare the noise level of each device for different surfaces, the sensitivity of He–Ne SLDV and infrared LDV was set to 20 and 122.5 mm/s/v, respectively. Figure 4 shows that the He–Ne SLDV noise threshold was higher than the infrared LDV noise threshold regardless of surface conditions. It could also be seen that the trend of each instrument's noise level was similar for all surfaces.
MDPI


![Figure 4. Iterative method to solve the problem of finding minimum volume enclosing ellipsoid [22].](https://thumb-ap.123doks.com/thumbv2/1libvncom/9201538.0/94.723.112.627.540.821/figure-iterative-method-problem-finding-minimum-enclosing-ellipsoid.webp)
