The principle of the SEM was originally demonstrated by Knoll (1935; Knoll and Theile 1939) and the first true SEM was developed by von Ardenne (1938). This threshold contrast depends on the relative size and shape of the feature in question.
Measuring the Crystal Structure
Dual-Beam Platforms: Combined Electron and Ion Beams
Modeling Electron and Ion Interactions
Electron Beam—Specimen Interactions: Interaction
What Happens When the Beam Electrons Encounter Specimen Atoms? – 2Specimen Atoms? – 2
Inelastic Scattering (Energy Loss) Limits Beam Electron Travel in the Specimen – 2Electron Travel in the Specimen – 2
Elastic Scattering: Beam Electrons Change Direction of Flight – 4Direction of Flight – 4
Monte Carlo Calculations – 5
A Range Equation To Estimate the Size of the Interaction Volume – 12Volume – 12
Electrons Encounter Specimen Atoms?
Inelastic Scattering (Energy Loss) Limits Beam Electron Travel
The Bethe range for Au with an incident beam energy of 20 keV is approx. 1200 nm, a linear change in scale of a factor of 1200 over an incident beam diameter of 1 nm. If the beam-sample interactions were confined to a cylindrical column with the circular beam entrance footprint as its.
How Frequently Does Elastic Scattering Occur?
Simulating the Effects of Elastic Scattering: Monte Carlo Calculations
- What Do Individual Monte Carlo Trajectories Look Like?
- Monte Carlo Simulation To Visualize the Electron Interaction Volume
- Using the Monte Carlo Electron Trajectory Simulation to Study
The Monte Carlo simulation can provide detailed information about many aspects of the interaction between electron beam and sample. As the atomic number of the target increases, the linear dimensions of the interaction volume decrease.
A Range Equation To Estimate the Size of the Interaction Volume
It is of course simplistic to use a single numerical value of the area to describe such a complex phenomenon as the electron interaction volume with its varying contours of energy deposition and thus the range equation. Nevertheless, the Kanaya-Okayama area is useful as a means of providing scaling to describe the spatial distributions of the signals produced within the interaction volume: secondary electrons, backscattered electrons, and X-rays.
Backscattered Electrons
Origin – 16
Origin
- The Numerical Measure of Backscattered Electrons
These beam electrons that escape the sample are referred to as “backscattered electrons” (BSE) and constitute an important SEM imaging signal rich in information about the characteristics of the sample. This module describes the properties of backscattered electrons and how these properties are modified by sample characteristics to produce useful information in SEM images.
Critical Properties of Backscattered Electrons
- BSE Response to Specimen
Close inspection of the trajectories in the Monte Carlo simulation of a flat, bulk target of copper at 0° tilt shown in .Fig. The BSE signal can convey information about sample composition, topography, mass thickness and crystallography.
- BSE Response to Specimen Inclination ( η vs. Surface Tilt, θ )
- Angular Distribution of Backscattering Beam Incident Perpendicular to the Specimen
- Spatial Distribution of Backscattering
- Energy Distribution of Backscattered Electrons
- Summary
Model the effect of sample surface inclination angle on incident beam using Monte Carlo simulation. However, even with strongly scattering elements, backscattered electrons appear in a significant proportion of the region.
Secondary Electrons
Origin – 30
Energy Distribution – 30
Escape Depth of Secondary Electrons – 30
Origin
Energy Distribution
Escape Depth of Secondary Electrons
Secondary Electron Yield Versus Atomic Number
The effective secondary electron coefficient of a "true" material under typical SEM or VP-SEM vacuum conditions is unlikely to produce a consistent, predictable response as a function of the composition of the nominal substance under investigation. Thus, while composition-dependent secondary electron signals may occasionally be observed, they are generally not predictable and reproducible, which is the critical basis for establishing a useful contrast mechanism such as that found for backscattered electrons as a function of atomic number.
Secondary Electron Yield Versus Specimen Tilt
Angular Distribution of Secondary Electrons
Even when the surface is highly inclined with respect to the beam, the escape path length situation of a secondary electron generated below the surface is identical to the case of normal beam incidence, as shown in .Fig. The secondary electron trajectories thus follow a cosine distribution in relation to the local surface normal, regardless of the slope of the sample.
Secondary Electron Yield Versus Beam Energy
Behavior close to a cosine relationship is seen in the Monte Carlo simulation of Koshikawa and Shimizu (1974) in .Fig.
Spatial Characteristics of Secondary Electrons
The appearance of the SE image of a structure depends on the details of the secondary electron emission and the characteristics of the secondary electron detector used to capture the signal, as discussed in detail in the imaging module. Reimer L, Tolkamp C (1980) Measurement of the backscatter coefficient and secondary electron yield inside a scanning electron microscope.
Rays
- Overview – 40
- Characteristic X-Rays – 40 .1 Origin – 40.1 Origin – 40
- X-Ray Fluorescence – 59 References – 63References – 63
- Overview
- Characteristic X-Rays
- Origin
- Fluorescence Yield
- X-Ray Families
- X-Ray Nomenclature
- X-Ray Weights of Lines
- Characteristic X-Ray Intensity Isolated Atoms
The total kinetic energy transferred to the K-shell atomic electron can be up to half the energy of the incident electron. For a carbon atom, characteristic X-ray emission only occurs for about 0.26 % of the K-shell ionizations.
Ray Production in Thin Foils
The behavior of the ionization cross-section for the silicon K shell as a function of the energy of the energetic beam electron is shown in. The critical excitation energy is a strong function of the atomic number of the element and of the shell of interest, as shown in.
Ray Intensity Emitted from Thick, Solid Specimens
- X-Ray Continuum (bremsstrahlung)
- X-Ray Continuum Intensity
- The Electron-Excited X-Ray Spectrum, As-Generated
- Range of X-ray Production
- Monte Carlo Simulation of X-Ray Generation
- X-ray Depth Distribution Function, ϕ ( ρ z)
- X-Ray Absorption
- X-Ray Fluorescence
The intensity of the X-ray continuum, Icm , at an energy Eν is described by Kramers (1923) as. However, there is a significant difference in the spatial distribution of the primary and secondary X-rays.
Scanning Electron Microscope (SEM) Instrumentation
Electron Beam Parameters
As we mentioned in the book's introduction, the main goal of the text is to help users understand how to use the SEM and its accessories, and how to be effective in using these powerful tools for the characterization and analysis of materials. It is a fair question, then, to ask why a microscope operator needs to understand electron optics and beam optical parameters.
Electron Optical Parameters
- Beam Energy
- Beam Diameter
- Beam Current
- Beam Current Density
- Beam Convergence Angle, α
- Beam Solid Angle
- Electron Optical Brightness, β
- Focus
As mentioned above with the definition of the beam diameter, this notion is a hard edge. In the case shown here, as the beam moves down the optical axis of the SEM, the.
SEM Imaging Modes
- High Depth-of-Field Mode
- High-Current Mode
- Resolution Mode
- Low-Voltage Mode
These two changes decrease the convergence angle of the electron beam and therefore increase the DoF. The basic idea behind low-voltage mode is simple: reduce beam down energy.
Electron Detectors
- Important Properties of BSE and SE for Detector Design and Operation
- Detector Characteristics
- Common Types of Electron Detectors Backscattered Electrons
- Secondary Electron Detectors Everhart–Thornley Detector
- Specimen Current: The Specimen as Its Own Detector
- A Useful, Practical Measure of a Detector: Detective Quantum
Note the strong dependence of Ω on the distance of the detector from the beam impingement on the sample. In SEM, where the magnetic field of the objective lens is projected into the sample chamber, "through the lens".
Making Measurements on Surfaces With Arbitrary Topography: Stereomicroscopy – 102Topography: Stereomicroscopy – 102
- Image Construction by Scanning Action
- Magnification
- Magnification, Image Dimensions, and Scale Bars
- Making Dimensional Measurements With the SEM: How Big Is That Feature?
- Calibrating the Image
- Image Defects
- Projection Distortion (Foreshortening)
- Image Defocusing (Blurring)
- Making Measurements on Surfaces With Arbitrary Topography
Ij of the relevant signal(s) generates a digital stream of data packets (x, y, Ij), where the index j represents the different signals available: backscattered electrons (BSE), secondary electrons (SE), absorbed current, X-rays , cathodoluminescence, etc. However, this scanning transformation is only correct for objects lying in the plane of the specimen.
Stereomicroscopy
Qualitative Stereomicroscopy
Parallax”: the shift between the separate views of the same object provided by each eye. Record an image of the area of interest at the low tilt angle, for example stage tilt = 0°.
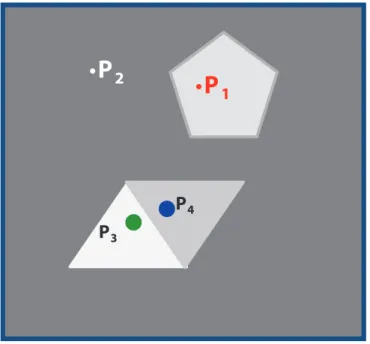
Quantitative Stereomicroscopy
For the feature of interest, the (X, Y) coordinates are measured in the left (XL, YL) and right (XR, YR) members of the stereopair using a calibrated distance marker. Note that the sign of the parallax is negative, meaning that the green circle feature is below the yellow circle feature, a result confirmed by qualitative inspection of the stereopair in .Fig.
SEM Image Interpretation
Information in SEM Images – 112
Interpretation of SEM Images of Compositional Microstructure – 112Microstructure – 112
Interpretation of SEM Images of Specimen Topography – 114Topography – 114
Information in SEM Images
The resulting differences in the backscattered and secondary electron signals (S) convey information about the properties of the sample through a variety of contrast mechanisms. Path effects refer to contrast that results from differences in the paths the electrons take after leaving the sample.
Interpretation of SEM Images of Compositional Microstructure
- Atomic Number Contrast With Backscattered Electrons
- Calculating Atomic Number Contrast
- BSE Atomic Number Contrast
Energy effects occur when the contrast is carried by some portion of the backscattered electron or secondary electron energy distribution. Note that for mixtures that are uniform at the atomic level (e.g., alloy solid solutions, compounds, glasses, etc.), the backscattered electron coefficient can be calculated from the mass fraction average of the atomic number inserted in Eq.
With the Everhart–Thornley Detector
Interpretation of SEM Images of Specimen Topography
- Imaging Specimen Topography With the Everhart–Thornley Detector
- The Light-Optical Analogy to the SEM/
The apparent main source of illumination of the stage comes from the position of the electron detector. The E–T detector is mounted on the wall of the SEM sample chamber asymmetrically from the beam axis, as shown schematically in .Fig.
E–T (Positive Bias) Image
Imaging Specimen Topography With a Semiconductor BSE Detector
But note the strong effect of the apparent inversion of the sense of topography in. Note that when the signals are subtracted, the order of the segments in the subtraction has a profound effect on the appearance of the final image.
The Visibility of Features in SEM Images
Signal Quality: Threshold Contrast and Threshold Current – 124Current – 124
Signal Quality: Threshold Contrast and Threshold Current
8.4 (threshold contrast vs. image time for different values of the beam current) and .fig. frame time for different values. The effect of the size of a feature on the visibility of real features can be seen in .Fig.
Charging – 134
Moiré Effects: Imaging What Isn’t Actually There – 144 References – 146References – 146
Image defects are very dependent on the specific nature of the sample, and often they are anecdotal, experienced but not reported in the SEM literature. The examples described below are not a complete catalog, but are presented to alert the microscopist to the possibility of such image defects to avoid interpreting artifacts as facts.
Charging
- What Is Specimen Charging?
- Recognizing Charging Phenomena in SEM Images
- Techniques to Control Charging Artifacts (High Vacuum Instruments)
Thus, depending on the details of the local electric field, SE collection by an E–T detector can be increased or decreased. 9.12 (bottom plot), as well as a sharp difference in the shape of the X-ray continuum at higher photon energy.
Radiation Damage
However, the energy deposited per unit volume increases significantly as the beam energy is reduced. Thus, the volume density of energy deposition increases by a factor of 104 as the beam energy decreases from E0 = 10 keV to E0 = 1 keV.
Contamination
After the image is recorded using the shortest possible frame time consistent with the visibility setting, the beam must be emptied (ideally in a Faraday cup) to stop further electron bombardment while the stored image is reviewed before proceeding. Intuitively, it would seem logical to lower the beam energy to reduce radiation damage, and depending on the particular material and the exact mechanism of radiation damage, a lower beam energy may be beneficial.
Moiré Effects: Imaging What Isn’t Actually There
The shape of the moiré interference fringes depends on the spacing and orientation of the periodic pattern of the sample and the scanning pattern. 9.18, are moiré patterns created when the fine-scale structure approaches the periodicity of the scanning grating.
High Resolution Imaging
- What Is “High Resolution SEM Imaging“? – 148 10.2 Instrumentation Considerations – 14810.2 Instrumentation Considerations – 148
- What Is “High Resolution SEM Imaging”?
- Instrumentation Considerations
- Pixel Size, Beam Footprint, and Delocalized Signals
- Secondary Electron Contrast at High Spatial Resolution
- SE Range Effects Produce Bright Edges (Isolated Edges)
- Even More Localized Signal: Edges Which Are Thin Relative to the Beam
- Too Much of a Good Thing: The Bright Edge Effect Can Hinder
Fortunately for achieving useful high resolution SEM, the E–T (positive bias) detector also collects the SE1 component (about 15 % of the total SE signal for copper) emitted from the footprint of the incident beam. The edges of an object will appear very bright relative to the interior of the object, as shown in
Distinguishing Shape
Too Much of a Good Thing: The Bright Edge Effect Hinders Locating the True
Dimension Metrology
Achieving High Resolution with Secondary Electrons
- Beam Energy Strategies
- Improving the SE 1 Signal
- Eliminate the Use of SEs Altogether
Strategies to improve high-resolution imaging with SEs seek to alter the spatial characteristics and/or relative abundance of SE2 and SE3 compared to SE1. As the beam energy increases, the electron range increases rapidly as E01.67, broadening the spatial distribution of the BSE-SE2-SE3 signals, while the SE1 distribution remains fixed on the beam footprint.
Low Loss BSEs“
Factors That Hinder Achieving High Resolution
- Achieving Visibility: The Threshold Contrast
- Pathological Specimen Behavior
- Pathological Specimen and Instrumentation Behavior
The inevitable consequence of low beam current operation is the problem of determining the visibility of features of interest due to the constraints imposed by the Threshold Equation. Another possibility is to explore the susceptibility of the specimen to damage over a wide range of beam energy.
Low Beam Energy SEM
Sampling of Imaging Signals – 169
What Constitutes “Low” Beam Energy SEM Imaging?
That is, what value of E0 constitutes the upper limit of low-beam energy microscopy. Low Energy X-ray Microanalysis Module", where it is found that E0 = 5 keV is the lowest beam energy for which a useful characteristic X-ray peak can be excited for all elements of the periodic table, except for H and He, which do not produce characteristic X-rays.
Secondary Electron and Backscattered Electron Signal Characteristics
The upper limit for E0 is arbitrary, but a reasonable limit is the value discussed in
Selecting the Beam Energy to Control the Spatial Sampling of Imaging
- Low Beam Energy for High Lateral Resolution SEM
- Low Beam Energy for High Depth Resolution SEM
- Extremely Low Beam Energy Imaging
Observing the sample as the beam energy is gradually lowered to record systematic changes can reveal lateral heterogeneities in the surface composition. The C-Al contrast increases sharply as the beam energy decreases below 5 keV, reaches a maximum at E0 = 2 keV, and then decreases below this energy.
Variable Pressure Scanning Electron Microscopy (VPSEM)
Review: The Conventional SEM High Vacuum Environment – 174Environment – 174
How Does VPSEM Differ From the Conventional SEM Vacuum Environment? – 174SEM Vacuum Environment? – 174
Benefits of Scanning Electron Microscopy at Elevated Pressures – 175Elevated Pressures – 175
- Controlling the Water Environment of a Specimen – 176 12.4 Gas Scattering Modification of the Focused 12.4 Gas Scattering Modification of the Focused
Electron Beam – 177
VPSEM Image Resolution – 181
Review: The Conventional SEM High Vacuum Environment
- Stable Electron Source Operation
- Maintaining Beam Integrity
- Stable Operation of the Everhart–
Although a separate pumping system is typically dedicated to the electron source to maintain the proper vacuum, if the sample chamber pressure in a conventional SEM is allowed to rise, gas molecules will diffuse to the gun, increasing the pressure and causing unstable operation and early failure. An electron emitted from the source that encounters a gas atom along the path to the sample will be elastically scattered, changing the path and causing the electron to deviate from the focused beam.
Thornley Secondary Electron Detector
Minimizing Contamination
The pressure in the electron gun should be kept below 10−4 Pa (~10−6 torr) for stable operation of a conventional thermal emission tungsten filament and below 10−7 Pa (~10−9 torr) for a thermally assisted field emission source. To maintain the integrity of the beam, the column and chamber pressure must be reduced to the point that the number of collisions between the beam electrons and the remaining gas molecules is negligible along the entire path, which typically extends to 25 cm or more.
How Does VPSEM Differ
From the Conventional SEM Vacuum Environment?
Benefits of Scanning Electron Microscopy at Elevated Pressures
- Control of Specimen Charging
- Controlling the Water Environment of a Specimen
Depending on the beam energy, the properties of the material and the local inclination of the sample to the beam, negative or positive charging can occur. Furthermore, when the partial pressure of water vapor in the sample chamber is controlled to maintain liquid water in equilibrium with the gas phase, it becomes possible to observe chemical reactions mediated by water.
Gas Scattering Modification of the Focused Electron Beam
For these conditions, the unscattered beam retains approx. 0.70 of the radiation intensity entering the sample chamber. The skirt out to a radius of 30 μm contains a cumulative intensity of 0.84 of the incident beam.
VPSEM Image Resolution
Backscattered Electrons—Passive Scintillator Detector
Secondary Electrons–Gas Amplification Detector
