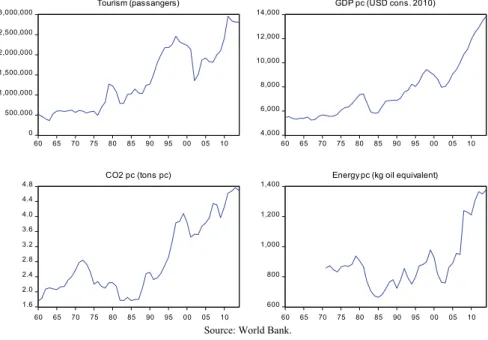
Her main research activities are focused on energy economics, energy innovation, economic growth and sustainable tourism. The impact of tourism and the use of renewable energy on economic growth in the top 10 tourist destinations.
Literature Review
A lack of tourism development can also have adverse effects on local businesses and the environment (Long et al. 1990). This additional cost would arise from changes in the mix of energy sources and the promotion of energy innovation processes (Álvarez et al. 2017).
Empirical Methodology
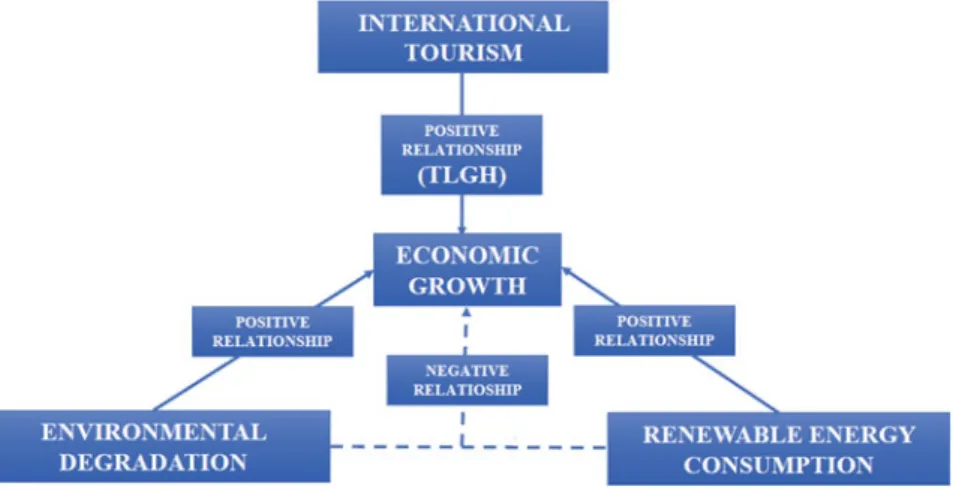
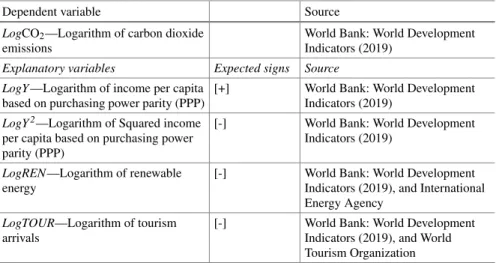
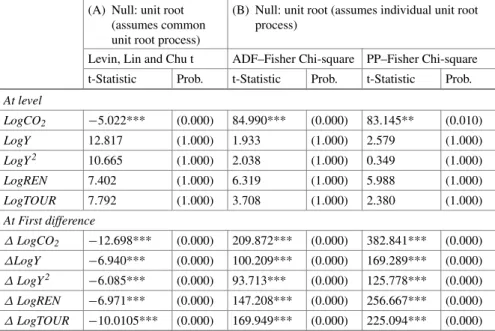
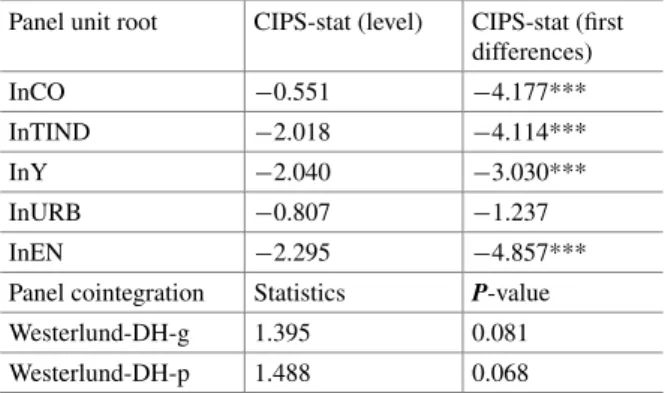
Recent studies have shown that international tourism boosts economic growth and increases energy consumption and carbon emissions (Scott et al. 2016; Lee et al. 2018). First, a traditional LLC (Levin et al. 2002), ADF-Fisher and PP-Fisher (Choi 2001) panel unit root test is used to check whether the variables (LGDPi t,LGDPi t,LITi t,LRNWi t,LCO2i t ) are cointegrated I (1) based on the presence of unit roots I(1) in the panel variables (Apergis and Payne2009a,b).
Empirical Results
While LLC (2002) assumes that ρ is constant across the panel, individual time series regressions are performed via ADF and PP tests through each cross-section, and the p-value for each series from their unit root test is combined rather than averaging individual test statistics (Im et al. 2003). If these tests confirm that the variables are cointegrated I(1), then all the series are non-stationary at levels and the null hypothesis will be accepted.
Discussion of Empirical Results
As such, economic growth in the first phase of renewable energy promotion may be reduced due to budgetary/investment efforts, but it is expected to regain the rhythm of economic growth in the next phase.
Final Conclusions
Economic impacts caused by climate change in tourism destinations: The case of Australia.Journal of Sustainable Tourism. Revisiting the tourism-led economic growth hypothesis: The case of China.Journal of Travel Research.
The Possible Influence of the Tourism Sector on Climate Change in the US
Introduction
Third, empirical studies of tourism provide a temporal pattern of the relationship between tourism indicators and climate change. In this context, this study presents different scenarios for the dynamics of climate change measurements and tourism development in the United States.
Literature Review
An application of the Panel Granger causality by Al-Mulali et al. 2015) revealed a significant impact of tourist arrivals on CO2 emissions from the transport sector during 1995–2009 in 48 top international tourism destinations. However, results reported using Panel DOLS and FMOLS mostly confirm that tourism sector improves environmental quality by reducing CO2 emissions (Zhang and Gao2016; Deens and Wang2018; Ben Jebli and Hadhri2018).
Estimation Methodology: MS-VAR
Modeling of these time series may be necessary to accept the discontinued changes in uncertain time. This uncertainty and instability reflects the dynamic nature of the time series (Shumway and Stoffer1991).
MS-VAR Estimation Output
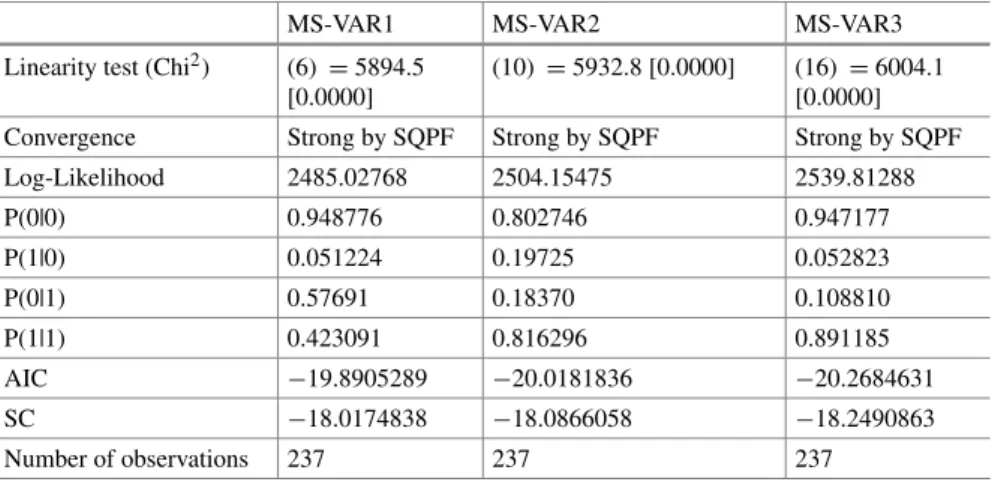
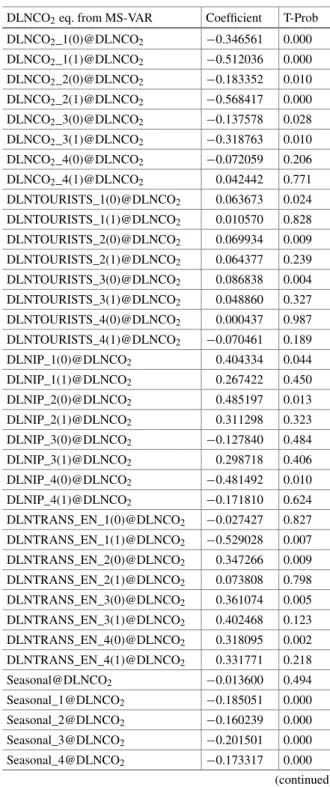
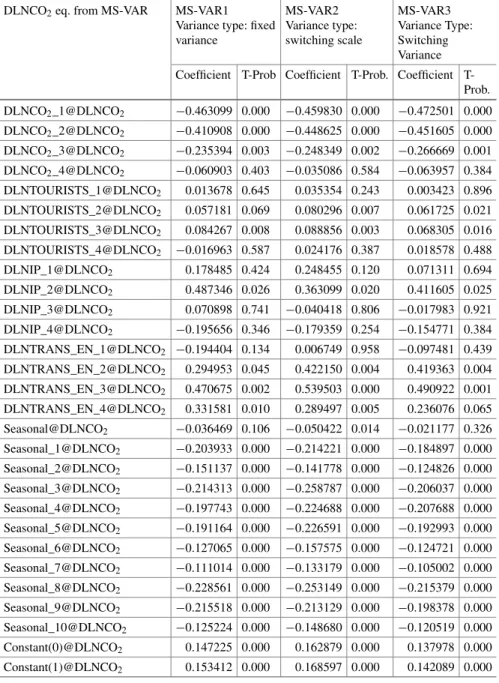
Convergence Strong by SQPF Strong by SQPF Strong by SQPF. a) The current DLNCO2 in the US is negatively affected by the 1st, 2nd and 3rd delayed values of DLNCO2. In table 2.5 the constant terms at regimes 0 and 1 and all seasonal terms except seasonal influences at time t were found to be significant. i) The 1st, 2nd and 3rd delayed values of DLNCO2 have significant negative influences on the current DLNCO2 during both regimen 1 and regimen 0.
Summary and Conclusion
The Effects of Tourism on Economic Growth and Carbon Emissions: A Comparison Between Developed and Emerging Economies. Journal of Travel Research. Impact of tourism on CO2 emissions: evidence from Pakistan. Asia Pacific Journal of Tourism Research.
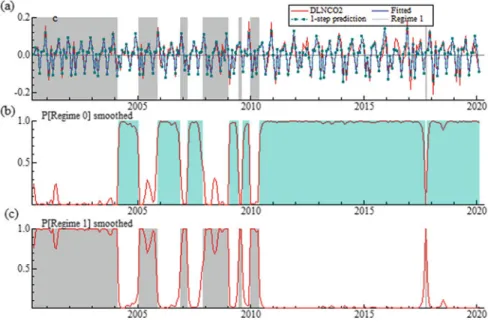
![Fig. 2.2 The P [Regime 0] smoothed and the P [Regime 1] smoothed of MS-VAR4. (a) Actual, Fitted, Prediction, and Regime 1 area of DLNCO 2 , (b) Probability of smoothed regime 0, and (c) Probability of smoothed regime 1](https://thumb-ap.123doks.com/thumbv2/1libvncom/9116512.0/41.659.90.574.89.411/regime-smoothed-smoothed-prediction-probability-smoothed-probability-smoothed.webp)
Tourism Sector and Environmental Quality: Evidence from Top 20 Tourist
Introduction
The expansion of the tourist sector causes pollution such as air emissions, noise, solid waste or even architectural/visual pollution. In this context, the tourism sector has attracted considerable attention and has been accepted as the engine of the 'tourism-induced EKC hypothesis'.
Literature Review
However, globalization has a negligible influence on CO2 emissions. 2020) investigated the causal relationship between economic growth, globalization, tourism and CO2 emissions in the territories of tourism islands. Bella and Bella (2018) tested for the tourism-induced EKC in France using the error correction model.
Data and Model .1 Data
- Model
Tourism data is obtained from the Tourism Statistics Database of the United Nations World Tourism Organization9. In the framework of the EKC, an inverted U-shaped relationship between environmental degradation and economic growth is assumed.
Methodology and Empirical Results .1 Methodology
- Panel Unit Root Tests
- Pedroni’s Residual-Based Cointegration Tests
- Pedroni’s FMOLS Estimator
- Results for Panel FMOLS Estimation
The specification of the number of lags and the deterministic component for each cross-sectional ADF equation should be defined. Finally, three of the four tourism variables indicate that tourism development reduces air pollution in the panel set as a whole.
Conclusion and Policy Implications
Tourist arrivals, energy consumption and pollutant emissions in a developing economy – Implications for sustainable tourism. Tourism management. The impact of tourism development on CO2 emissions: an advanced assessment of panel data. Perspectives of Tourism Management, 33 (2019). Tourism development, energy consumption and the environmental Kuznets curve: a trivariate analysis in a panel of developed and developing countries. Tourism management.
The Effects of Tourism, Economic Growth and Renewable Energy
Introduction
The empirical studies have been an interest in evaluating the determinants of tourism demand (Tavares and Leitão 2017; Harb and Bassil2018; Gallego et al. 2019), the impact of tourist arrivals on economic growth, i.e. Etokakpanet al. 2019; Balsalobre-Lorente et al.2020a,b) tourism sector encourages climate change and stimulates greenhouse gas. Moreover, several studies have supported a negative relationship between the tourism industry and environmental degradation (Paramati et al.2018).
Literature Review
- The Effects of Tourism Arrivals on Carbon Dioxide Emissions
- The Effects of the Kuznets Environmental Curve on Carbon Dioxide Emissions
- The Effects of Renewable Energy on Carbon Dioxide Emissions
Furthermore, Tiwari (2011) also showed that per capita income has a positive effect on carbon dioxide emissions. But per capita income has a positive effect on CO2 emissions, and renewable energy is negatively associated with CO2 emissions. of carbon dioxide. The empirical study of Vasylieva et al. 2019) using a panel cointegration (FMOLS, DOLS) also shows that per capita income has a positive effect on CO2 emissions and per capita income squared has a negative effect on carbon dioxide emissions.
Methodology
Another perspective has the study by Adams and Nsiah (2019), who show that renewable energy and non-renewable energy have a positive effect on carbon dioxide emissions. Yet in the long term only non-renewable energy has a positive effect on CO2 emissions. Consequently, the impact of renewable and non-renewable energy applied to Pakistan was studied by Zaidi et al.
Econometric Results
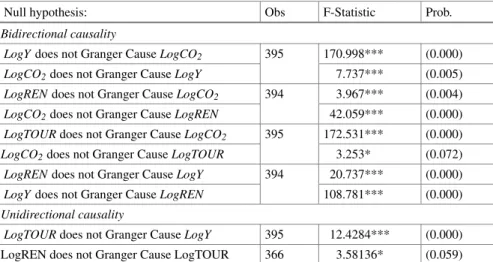
The coefficients for income per per capita (LogY) and renewable energy (LogREN) are statistically significant at the 1% level, and the variable income squared per capita (LogY2) is statistically significant at the 10% level. Furthermore, the empirical studies of Acheampong et al. 2019) also found a negative correlation between renewable energy and carbon dioxide emissions (β4<0); our result is according to these studies. Our results with the panel Granger causality test prove that there is bidirectional causality between tourism arrivals (LogTOUR) and carbon dioxide emissions (LogCO2) in accordance with (Ben Jebli et al.2014).
Conclusions
The relationship between tourism, CO2 emissions and economic growth: a case of Mediterranean countries. Asia Pacific Journal of Tourism Research. Impact of renewable energy and agriculture on carbon dioxide emissions: Examining the environmental Kuznets curve in four selected ASEAN countries. Journal of Cleaner Production. Testing the Environmental Kuznets Curve Hypothesis in Portugal.International Journal of Energy Economics and Policy.
Clean India Mission and Its Impact on Cities of Tourist Importance in India
- Introduction
- Clean India Mission
- Literature Review
- Tourism’s Economic Impact
- Tourism, Environment and Sustainability
- International Tourism and Environment
- Indian Cities, Clean India Mission and Tourism
- Indian Cities of Tourist Attraction
- Methods
- Results
- Findings and Conclusion
In 2019, several news articles themselves took a critical look at the Clean India Mission's impact on the cleanliness and hygiene of the city. Improving air quality should be the prime concern of the government through the Clean India Mission. It was also found that the Clean India Mission was not found to have a holistic approach, according to survey respondents.
The Effects of Globalization
- Introduction
- Literature Review
- Model, Data, and Methodology
- Results and Discussions
- Conclusion
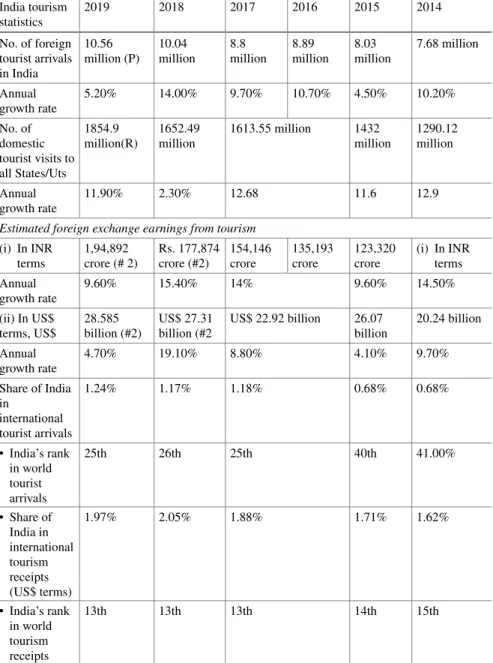
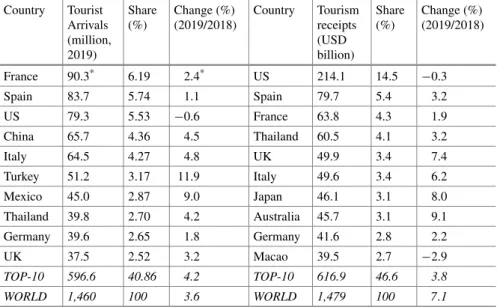
Table 6.1 presents the world's top ten countries in the number of international tourist arrivals and tourism receipts. Nine out of the top ten countries enjoyed favorable growth rates in the number of tourist arrivals. The main finding of the study indicates that terrorist incidents have a significant impact on tourist arrivals.
Testing the Dynamic Relationship Among CO 2 Emissions, Economic Growth,
Energy Consumption and Tourism Development. Evidence for Uruguay
- Introduction
- Methodological Framework
- Nonparametric Unit Root Test
- Rank Test for Cointegration
- Rank Test for (Neglected) Nonlinearity
- Causality Rank Test
- Data
- Results
- Concluding Remarks
- Causality Test (Holmes and Hutton)
Nevertheless, these indicators represent only a small part of the environmental degradation caused by tourism. the tourism-induced EKC hypothesis in the case of Singapore. The sign of the effect is positive in the regression of the ranked variables (see Appendix 1). A non-linear approach to the tourism-led growth hypothesis: The case of the MERCOSUR. Current Issues in Tourism.
Analyzing the Tourism Development and Ecological Footprint Nexus
Evidence From the Countries With Fastest-Growing Rate of Tourism GDP
- Introduction
- Literature Review
- Model, Data, Methodology and Empirical Results .1 Model and Data
- Methodology
- Empirical Results
- Conclusion
Therefore, it is crucial to research the sustainability of the tourism sector for a more livable world. Considering the potential effects of the tourism sector on the environmental components, it can be said that there is a need for a holistic approach to the study of the ecological effects of tourism. To examine the effect of tourism investment on environmental degradation within the framework of the EKC hypothesis in the six countries that are in the top 20 fastest growing countries in terms of tourism GDP, countries for the period from 1995 to 2014.
Investigating the Tourism Originating CO 2 Emissions in Top 10
Tourism-Induced Countries: Evidence from Tourism Index
Introduction
The continued increase in the negative effects of environmental pollution is forcing governments around the world to take more stringent measures for the environment. On the other hand, the development of the tourism sector, the increase in the number of international tourists or incomes not only affects the economic growth, but also increases the increase in energy demand. There are studies that focus on the relationship between tourism and environmental pollution, which is relatively less in the literature (Katircioglu2014b).
Literature Review
- Economic Growth, Urbanization, Energy Density, and Environmental Pollution
- Tourism and Environmental Pollution
In addition, urbanization increases energy consumption and carbon emissions in the middle and high income groups. According to the results of the study, there was an insignificant relationship between urbanization and carbon emissions. On the other hand, there was a positive relationship between tourism inflows and carbon emissions in both high- and low-income countries.
Empirical Strategy
In the model, the time dimension of the panel; Nis represents the cross-sectional dimension of the panel, and ρi j∧ is the binary OLS correlation sample estimate of the residuals (Pesaran2004: 1–7). After determining the cross-sectional dependence and homogeneity, the stationarity of the variables was examined using CIPS unit root analysis developed by Pesaran (2007). The test can be estimated in the presence of heterogeneity and cross-sectional dependence between countries.
Empirical Results and Discussions
When the literature is examined, it appears that there is no consensus on the relationship between tourism and environmental pollution. According to the results of the study, it can be said that energy consumption and transport are increasing. According to the results presented in Table 9.5, there is a bidirectional causality between tourism index, urbanization and CO2 emissions, and a unidirectional causality from GDP per capita to CO2 emissions.
Conclusions
Sustainable Development in Pakistan in the Context of Energy Demand and Environmental Degradation. Journal of Asian Economics. Tourism Development and Economic Growth: A Panel Granger Causality Analysis in the Frequency Domain. Current issues in tourism, 1–6. Exploring the Impact of Tourism on Economic Growth and Carbon Emissions: Evidence from a European Union Panel Analysis. Tourism Management, 38,69–76.
Sustainable Tourism Production and Consumption as Constituents
- Introduction
- Some Stylized Facts for High-Income Countries .1 More on Sustainable Wealth Indexes
- The Value of Statistical Life
- The Methodology of the Tourism ISEW Based on the Conventional ISEW
- A Simplified ISEW Version Upon Data Availability
- Conclusion
This should also be taken into account when we come to the calculation of sustainable GDP for tourism. Formula: (greenhouse gas emissions)×(marginal abatement cyst) + Net capital growth Change in the budget's net capital stock. Costs (environmental) (−) Mineral depletion It is the ratio of the stock of mineral resources to the life of the remaining reserve (limited to 25 years) (−) Energy depletion It is the ratio of the stock of minerals.

Developments and Challenges in the Greek Hospitality Sector
Introduction