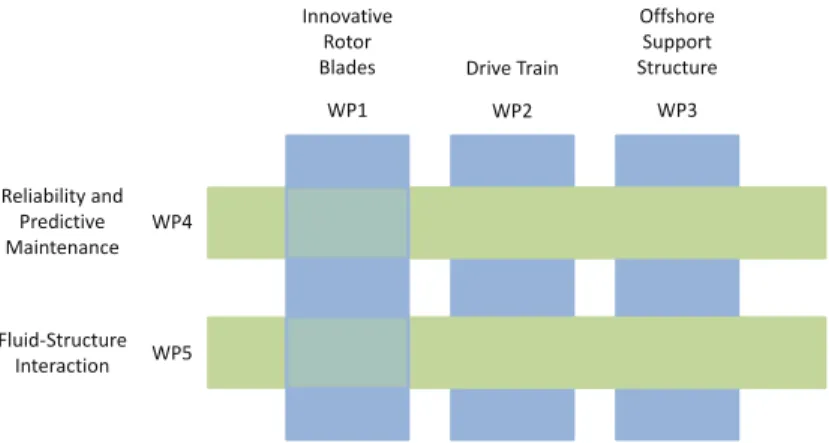
The first three research work packages focus on the main structural components of the offshore wind turbine; Blades, drive train and support structure. In work package 5, the structural description of the various offshore wind turbine components is combined with flow models in a fluid-structure interaction description of the complete system.
Introduction
Various countries have announced plans to invest in wind energy in the coming years; such as the USA, which will produce 20% of the country's electricity from wind energy by 2030, or Denmark, which has set itself the goal of producing 50% of its electricity from wind by 2020 and completely freeing Denmark from dependence on fossil fuels fuels by 2050. Therefore, the introduction of structural health monitoring (SHM) techniques becomes essential for remote structural integrity assessment.
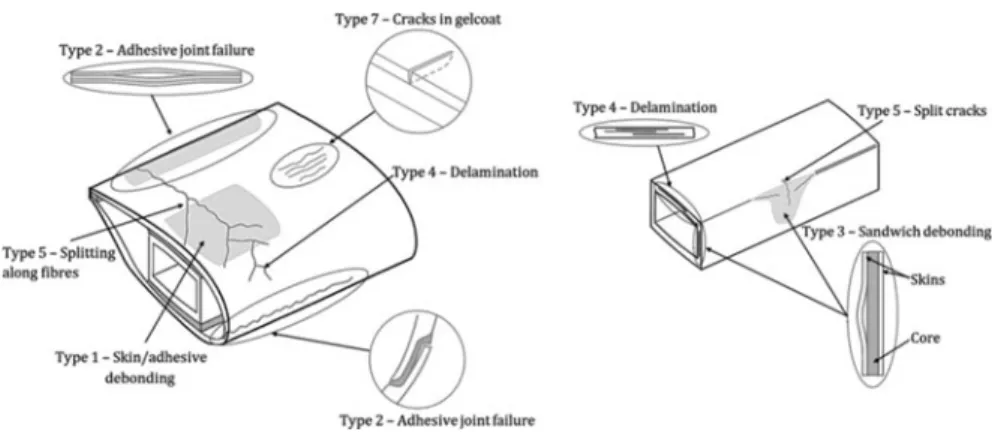
Structural Damages in Wind Turbine Blades
SHM on Wind Turbine Blades
- Modal Analysis
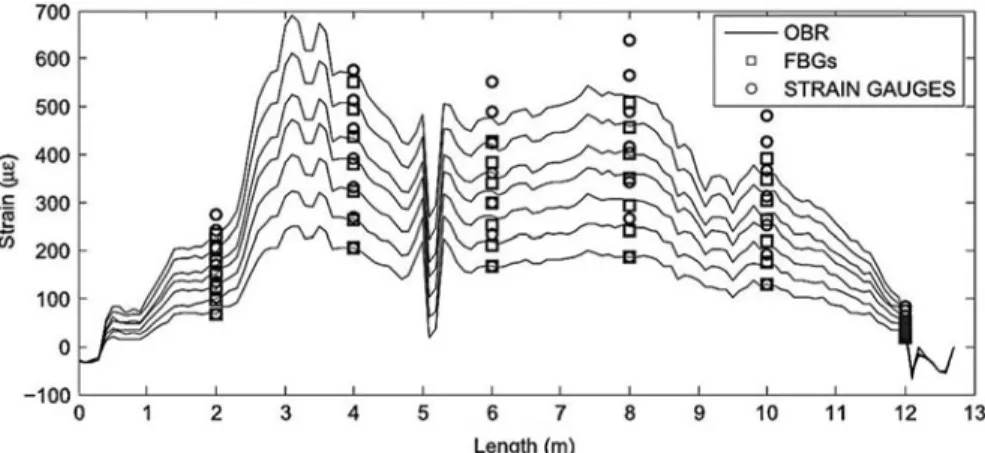
- Fibre Optics
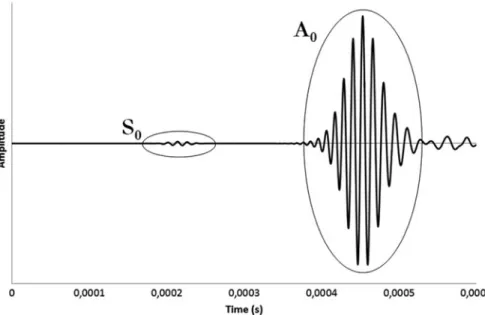
- Guided Wave Technology
- Acoustic Emission
- Thermography
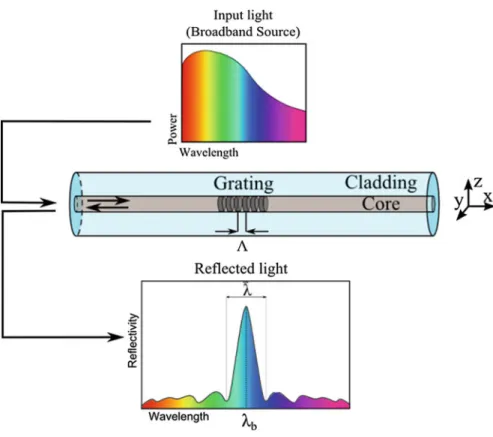
FBGs are periodic changes in the refractive index of an optical fiber core. However, more advanced signal processing techniques such as wavelet transform, pattern recognition, or classification methods are needed to better assess structural integrity (Chacon et al. 2015).
Guided Wave Technology in Composites
- Fundamentals of Guided Waves
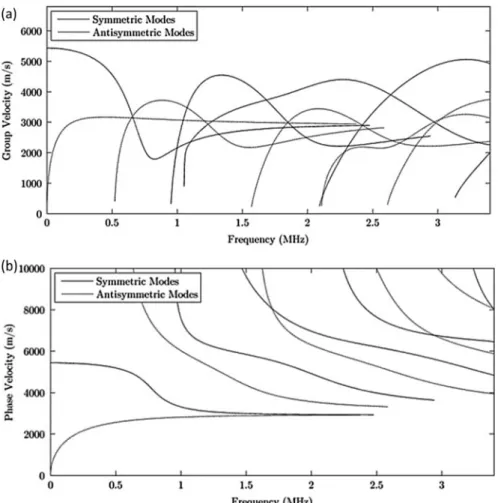
- Phase Velocity and Group Velocity
- Dispersion Curves
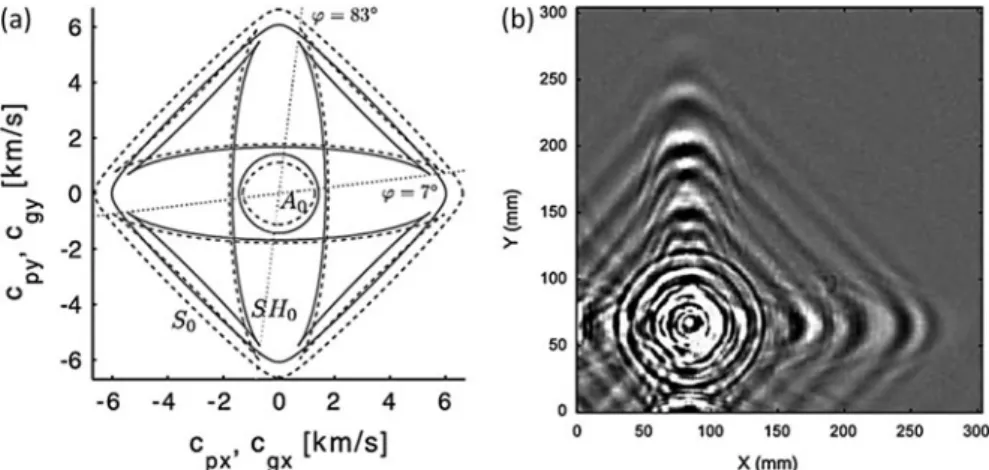
- Guided Waves in Composites
- Simulation
- Damage Detection
Another important consequence of wave propagation in composites is the absence of pure propagation modes. Zhou W, Li Y, Li Z et al (2015) Interlaminar shear properties and acoustic emission monitoring of the delaminated composites for wind turbine blades.
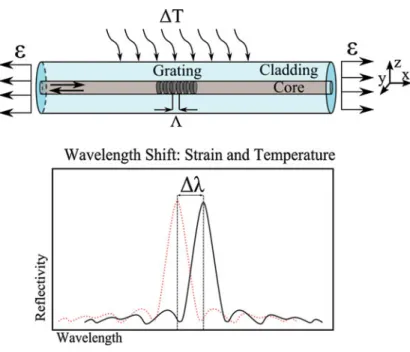
Fibre Bragg Grating Sensors
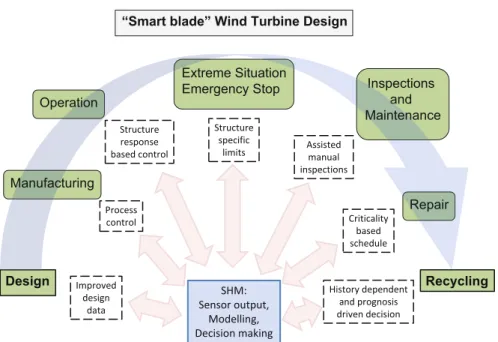
Summary There is a clear need to implement models and measurement systems throughout the life of the wind turbine blade. This chapter presents some work carried out to implement optical fibers as a multi-stage sensor, capable of measuring different structural properties, linking them to all different life stages and supporting better design of the wind turbine blades. In the production phase, where the sensors can measure various parameters of infusion and curing, sensor feedback can help control the process, prevent residual stress and contribute to product certification; and then in operation where cracks can be detected and monitored.
Models can then be developed to implement these results in a damage detection system for a wind turbine blade.
Manufacturing Stage: Residual Stress Induced by Resin Shrinkage and Curing Process Control
- Embedded FBG Response to Strain and Temperature Variation
- Residual Stress Measurement
- Crack/Delamination Detection by Embedded Fibre Bragg Gratings
- Embedded FBG Response: Strain
- Embedded FBG Response: Transverse Stress
- Embedded FBG Response: Non-Uniform Strain
- Delamination Detection in Fibre Reinforced Polymer Specimen Using Embedded FBG Sensor: Material
- Experimental Results
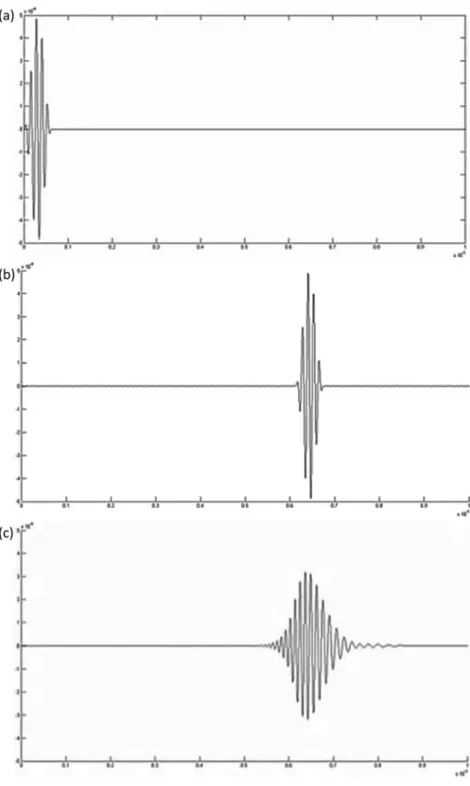
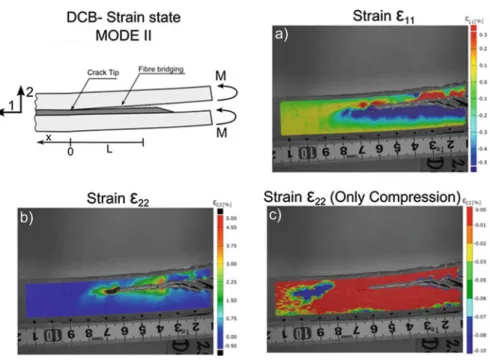
The three different stages of the FBG responses during a crack growth event are presented in Fig.4.5. First, before the crack reaches the vicinity of the grating (Fig. 4.5a), the material will build up strain, which will create a uniform wavelength shift in the FBG reflected peak. Next, a compression field is formed in front of the crack tip due to the formation of a crack bridging zone (Fig. 4.5b).
The compression field formed in front of the crack tip will reach the grating region, creating a split of the peak of the reflected FBG signal (Figure 4.5b).
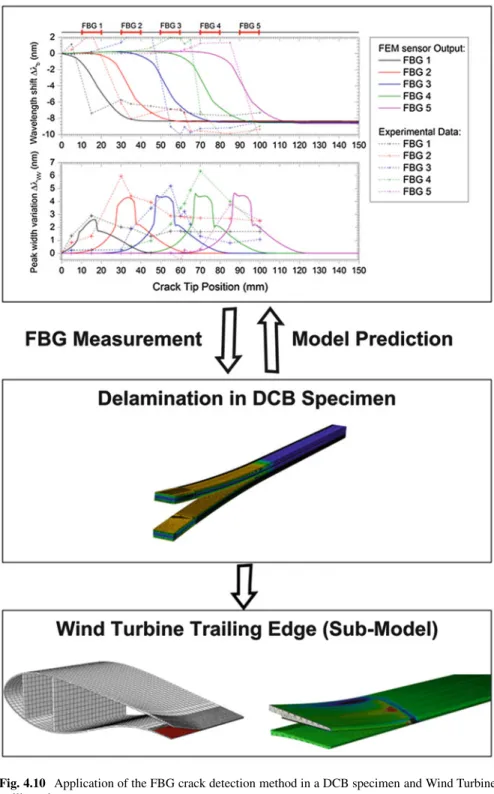
Application of the FBG Crack Detection Method
Pereira G, Mikkelsen LP, McGugan M (in preparation) A fiber Bragg grating sensor signal post-processing algorithm: Crack growth monitoring in fiber reinforced plastic structures. Pereira G, Mikkelsen LP, McGugan M (2015) Bragg grating fiber-embedded sensor response model: crack growth detection in fiber-reinforced plastic materials. Pereira G, Mikkelsen LP, McGugan M (2015), A Wind Turbine Trailing Edge Structural Health Monitoring Method: Crack Growth Detection Using a Fiber Bragg Grating Sensor Embedded in Composite Materials.
Pereira G, Mikkelsen LP, McGugan M (2015) Embedded fiber Bragg grating sensor response model: detection of crack growth in fiber reinforced plastics, 2015 In: DAMAS 2015.
Introduction
If the coupling is introduced by changing the fiber direction of the anisotropic sheet material, the assumptions of classical beam theory are not necessarily valid. A framework suitable for structural analysis of wind turbine blades is proposed, and guidance is provided for the design of bend-twist coupled blades. The change in fiber direction results in coupling of the normal and shear stresses at the lamina level, which can be used to induce bending-twist coupling in the beam cross-section.
The following section provides guidelines for the design of coupled blades with bending and twisting and presents a pre-twisting procedure to reduce the strength loss associated with coupled blades.
Analysis of Anisotropic Beams
- Structural Properties of Anisotropic Beams
- Shear Deformations
- Torsional Warping
- General Warping
- Large Displacements
- Wind Turbine Blade Analysis
- Anisotropic Cross-Sectional Properties
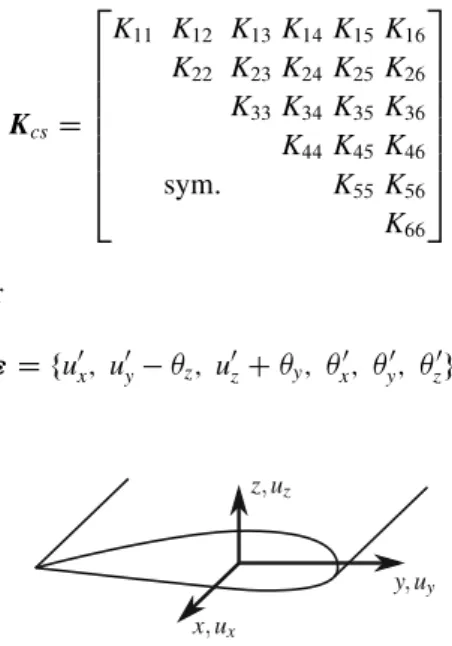
- Timoshenko Beam Element with Anisotropic Cross-Sectional Properties
It allows bending around the two main axes of the cross-section and stretching along the axis of the beam. It assumes that the cross-sectional plane after deformation remains flat (i.e. no twisting) and perpendicular to the elastic axis of the beam (no shear deformation). FD fFx; Fy; Fz; Mx; mine; MzgT; (5.3) the cross-sectional constitutive relation can be written as
The lateral displacements along the beam axisux and in the cross-sectional plane are expressed as functions of the coordinatex along the beamlengthL.
Design of Bend-Twist Coupled Blades
- Pre-Twisting Procedure
- Coupling Distribution
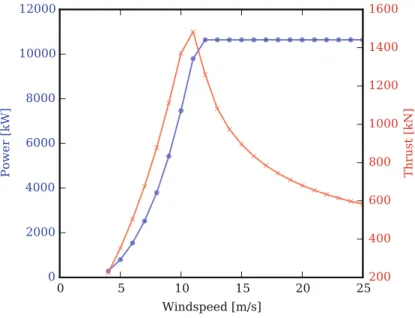
Choose a reference wind speed at which the torque distribution of the coupled blade should be optimal. The reference speed for pre-running is chosen to maximize annual energy production, which depends on the wind speed distribution at the site. The angle of attack is chosen as a reference because it results in the same aerodynamic condition regardless of blade twist, which is not uniquely defined for large displacements and rotations.
Previous studies (Fedorov and Berggreen 2014) have shown that coupling reduces the bending stiffness of the blade by 30–.
Summary
Bottasso CL, Campagnolo F, Croce A, Tibaldi C (2013) Optimization-based study of twist-twist coupled rotor blades for passive and integrated passive/active load damping. Kim T, Hansen AM, Branner K (2013) Development of an anisotropic beam finite element for composite wind turbine blades in multibody system. Lobitz DW, Veers PS (2003) Load damping with flexural/rotationally coupled blades in rotors using modern control strategies.
Stäblein AR, Tibaldi C, Hansen MH (2016) Using intertwisting to reduce power losses of bend-twist coupled blades.
Generators
Introduction
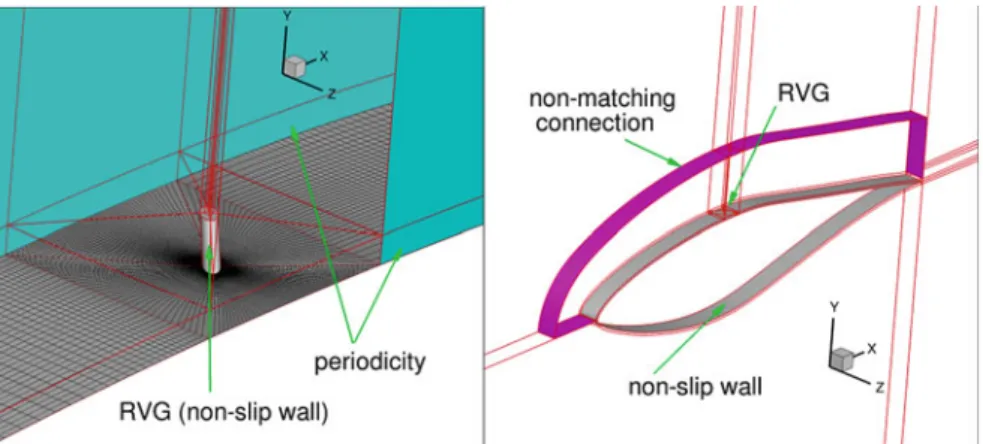
To reduce flow separation, various flow control devices have been developed and implemented on the blades in recent decades (Van Dam et al. 2008). This chapter focuses on the research and application of a new type of VG, called Rod Vortex Generator (RVG) (Doerffer et al.2009), on wind turbine blades. Optimized RVGs have demonstrated the ability to generate a similar flow-wise vortex intensity to that generated by the AJVGs (Tejero et al. 2015).
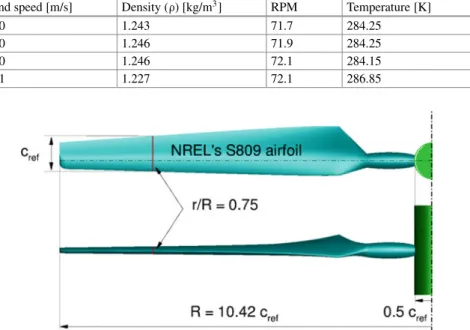
The NREL turbine was chosen because of the large amount of experimental data available (Hand et al. 2001) and the detailed description of the geometry (Lindenburg 2003), which is very favorable for the validation step.
Flow Solver
The chordwise location of the RVG along the blade (xRVG/c) is also a crucial parameter to consider. The application of RVGs to wind turbine blades, as a flow control device to improve aerodynamic performance, is analyzed for the NREL Phase VI wind turbine rotor.
The NREL Phase VI Wind Turbine Rotor .1 Experimental Set-Up
- Numerical Modelling
- Numerical Results
The dimensionless distance of the first cell layer near the wall is of the order of yC1. Numerical simulations for an NREL wind turbine rotor show good agreement with total thrust and torque measurements. An example of wake prediction with a numerical model described in more detail in Martinez et al.
For validation purposes, a more detailed analysis of the flow characteristics (in particular, flow attachment condition and local blade loading) is needed.
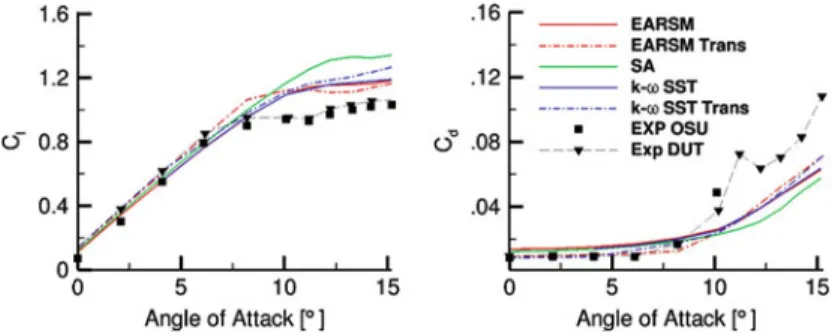
The S809 Aerofoil (Clean Case)
This model is based on two transport equations, one for intermittency,” and the other for the transition momentum thickness Reynolds number, Re™. A pressure overestimation is given on the suction side by the SA model for the 13.3ı angle of attack, while the other two fully turbulent models give a good agreement. For the angle of attack of 4.1ı, both transition models are able to accurately predict the laminar separation bubble located just aft of the center chord on the suction side of the aerofoil.
Simulations for RVGs applied to the blade are computationally intensive and only one turbulence model has been selected for further analysis.
The S809 Aerofoil (Flow Control Case) .1 Basic Configuration
- RVGs Chordwise Location
- RVGs Spanwise Separation
RVGs are initially located slightly upstream of the separation onset for an angle of attack of 13.9ı, at the chordwise positionxRVG=cD 0:50, and designed according to the local boundary layer height using the parametric values summarized in Table 6.2. Further increasing the angle of attack to 13.9ı results in a more modest gain with the RVG inclusion. 6.17, contour maps of skin friction coefficientcf on the suction side of the S809 airfoil, at the angle of attack 11.2ı, are shown.
However, the implementation of the span distance10 allows a further reduction of drag at the studied incident angles.
Conclusions
Furthermore, for this RVG configuration, the trailing edge separation was only partially eliminated, and elongated regions of detached flow in the vicinity of the trailing edge still exist. In: Exhibit Abstracts of the 36th AIAA Aerospace Sciences Meeting, Reno, 12–15 January 1998 Andersen PB, Henriksen L, Gaunaa M et al (2010) Deformable edge sheet for modern. Lindenburg C (2003) Investigation into rotor blade aerodynamics: analysis of stationary measurements on the UAE phase VI rotor at NASA-AMES wind tunnel ECN-C-03-025.
The trailing edge flap was at 75% R and the leading edge flap was at 60% R, where R is the radius of the blade.
Numerical Methods
The comparison of the flap performance is performed using non-dimensional parameters, and conclusions are drawn at the end of the chapter. Depending on the purposes of the simulations, steady and unsteady wind turbine CFD simulations can be performed in HMB3 using single or full rotor meshes generated with the ICEM-Hexa tool. The HMB3 CFD solver has been validated for several wind turbine cases so far, including the NREL Annex XX experiments (Gómez-Iradi et al.2009), where the effect of the blades moving in front of the tower is captured.
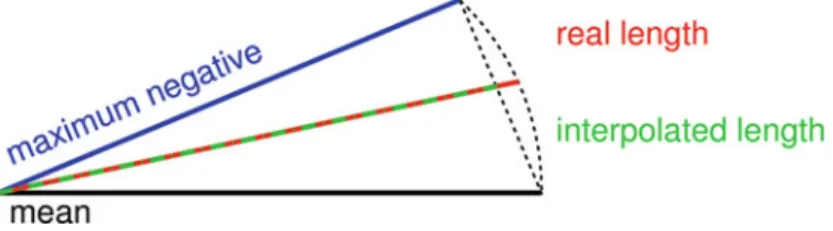
Then the linear interpolation is used for each point on the surface between the mean and deflected shape of the flap.
Numerical Parameters
The TFI interpolates the block face distortion from the edge distortions and then the full block distortion from the block face distortion. The raster deformation uses a weighted approximation to interpolate a face/block respectively from the boundary vertices/surfaces.
Mesh Convergence Study
Computational Grid
Definition of the Flaps
By denoting the point where the valve begins with x0, the process for calculating the valve deflection is as follows: For each point x > x0, define D .x/ based on the length along the chord line; calculate the point displacement˛based on the maximum deflection angleˇand time; compute shape function(); apply shape function and get distorted flap shape.
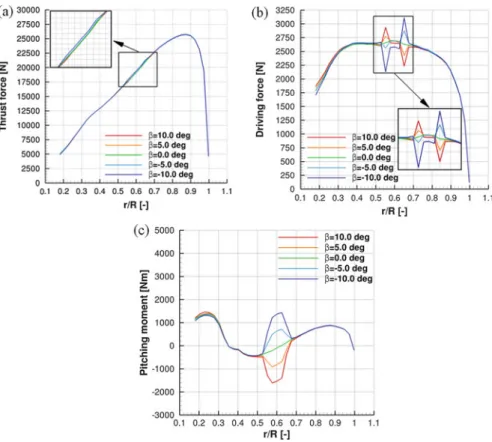
Results for the TE Flap
Results for the LE Flap
Comparison of the Performance
7.11, and were obtained from the integration of the surface pressure in the middle of the flap with the length of the section in the radial direction D 2:15m. The obtained coefficients for both flaps as a function of the flap angle ˇ are compared in Figure 7.12. On the other hand, the leading edge flap has the most pronounced effect on the pitching moment coefficient and an almost negligible (compared to the TE flap) effect on the normal force coefficient.
In addition, the relative change and slope of the pitching moment coefficient are higher at the trailing edge flap.
Summary
Carrión M, Woodgate M, Steijl et al (2013) Implementation of All-Mach Roe-type schemes in fully implicit CFD solvers - a presentation for wind turbine flows. Carrión M, Steijl R, Woodgate M et al (2014) Computational fluid dynamics analysis behind a MEXICO rotor under axial flow conditions. In Abstracts of the 10th Computational Fluid Dynamics Conference, Fluid Dynamics and Collaborative Conferences, AIAA, Honolulu, 24–26 June 1991.
Spalart P, Jou W, Strelets M et al (1997) Comments on the feasibility of LES for wings and on a hybrid RANS/LES approach.