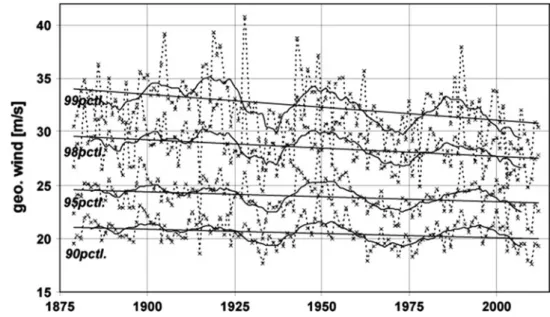
The main driver of atmospheric variability in the North Sea region is the North Atlantic Oscillation (NAO). There are signs of an increase in the number of deep cyclones (but not the total number of cyclones).
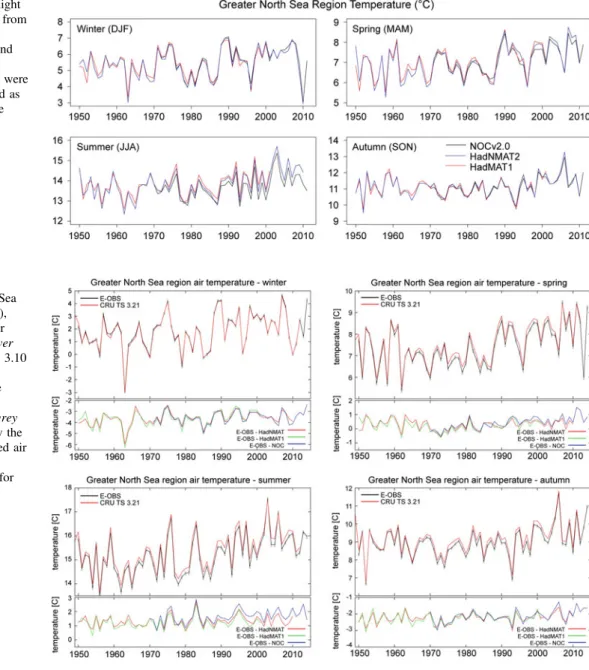
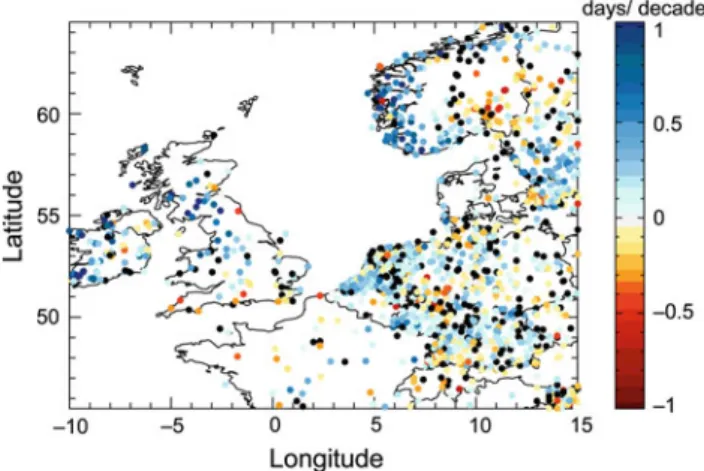
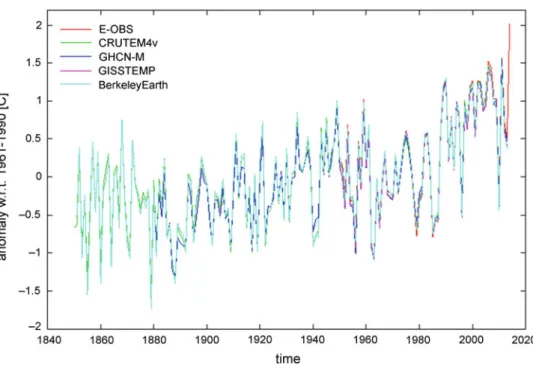
Surface Air Temperature
Due to the much larger heat capacity of water, the series of the difference between land and sea air temperature shows a residual positive trend during the last decades of records. Furthermore, due to the large heat capacity of water it takes much longer to warm the ocean than the land.
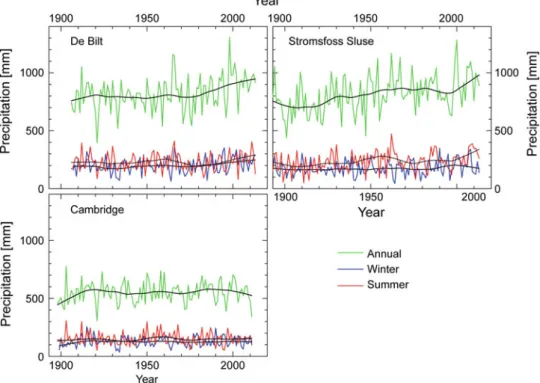
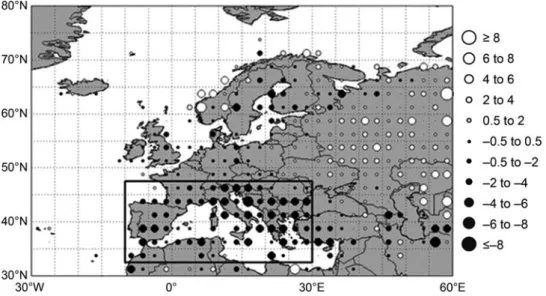
Precipitation
An insignificant increase in the contribution of extreme precipitation to total precipitation (R95pTOT) is also observed over Great Britain and Scandinavia. The trend is most pronounced in the 5-day precipitation amount in northern Europe in spring. No clear spatial pattern was discernible in the trends in the index. 2005) studied total precipitation and frequency of intense precipitation in several regions of the world, including Fennoscandia.
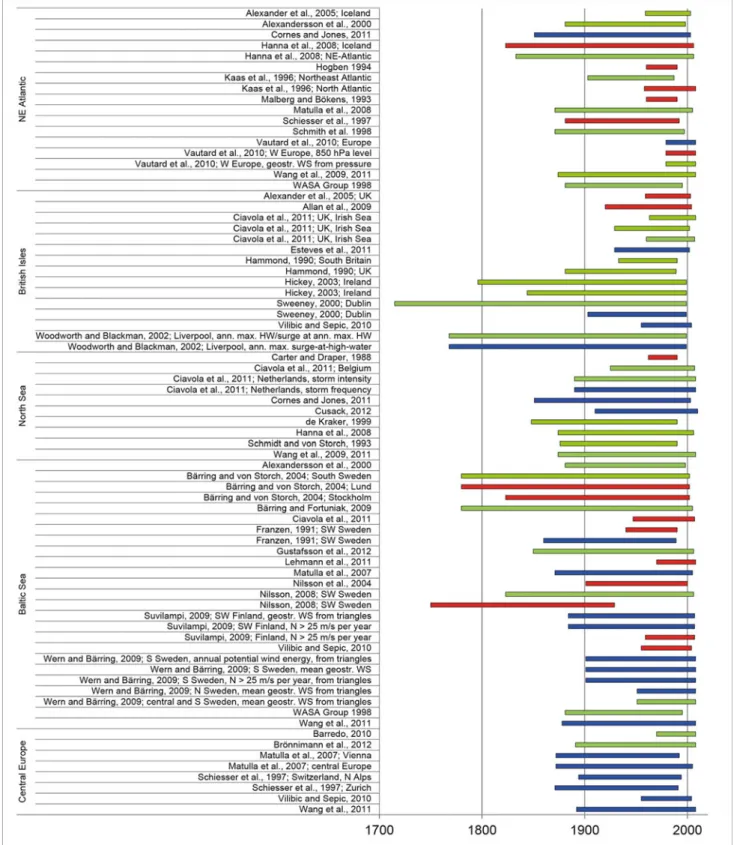
Trends in the station records for the period are shown in Fig.2.16, which indicates that most of the stations in the North Sea region show a slight increase. Fig. A similar map for trends in the maximum number of consecutive dry days (CDD) ) does not indicate a coherent change in the region. An example of interaction between North Sea waters and coastal climate was documented by Lenderink et al. 2009) for a month with extreme precipitation in the coastal region of the Netherlands (August 2006), where precipitation amounts were four times higher than the climatological average.
Nevertheless, there are indications of an increase in precipitation north of the North Sea area and a decrease in the south, consistent with the expected northeasterly shift of the storm tracks.
Radiative Properties
Winters with strong positive NAO anomalies show distinct precipitation peaks and amounts up to twice the average in the North Sea region (Andersson et al. 2010). The Extended Edited Cloud Report Archive (EECRA; Warren et al.) consists of quality-controlled climatologies of total cloud cover and cloud-type amounts over land and ocean, respectively, based on surface-based synoptic cloud observations. Further south in the North Sea Region (Thompson et al. 2000; Hense and Glowienka-Hense 2008).
Time series of measured solar irradiance data at various sites around the globe show irradiance decreases of the order of 6–9 W m−2 (corresponding to a decrease of 4–6% over 30 years) after the mid-1950s ( 'global darkening Gilgen et al. 1998;. Since the 1980s, air quality regulations have led to a decline in air pollution, as can be seen from optical depth time series (Mishchenko et al. 2007; Ruckstuhl et al. .2008).Shindell et al.2013) corroborate these findings. Declining trends for the period 1971–1986 and then increasing trends for 1987–2002 are found for coastal areas of the North Sea region (not shown), but these are mostly not statistically significant (Ruckstuhl et al. 2008, Ruckstuhl and Norris 2009). .
TNR, the balance between downward and upward fluxes at the surface representing the energy available for sensible and latent energy fluxes increases mainly due to increased water vapor in the atmosphere (Philipona et al.2009).
Summary and Open Questions
Budikova D (2012) Northern Hemisphere climate variability: Character, forcing mechanisms and significance of the North Atlantic/. Geng Q, Sugi M (2001) Variability of North Atlantic cyclone activity in winter analyzed from NCEP-NCAR reanalysis data. Hogben N (1994) Increasing wave height over the North Atlantic: a review of the evidence and some implications for the naval architect.
Luo D, Cha J, Feldstein SB (2012) Weather regime transitions and interannual variability of the North Atlantic Oscillation. Rodwell MJ, Rowell DP, Folland CK (1999) Oceanic forcing of the winter North Atlantic Oscillation and European climate. Woollings TJ, Hoskins BJ, Blackburn M, Berrisford P (2008) A new interpretation of the North Atlantic Oscillation breaking Rossby waves.
Woollings TJ, Hannachi A, Hoskins B, Turner A (2010) A regime picture of the North Atlantic Oscillation and its response anthropogenic forcing.
Introduction
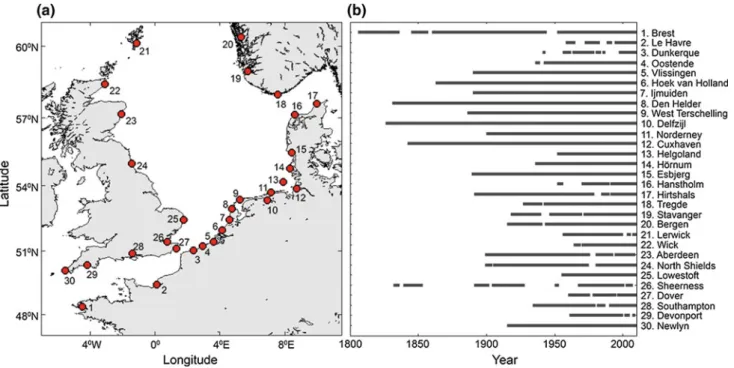
This chapter discusses past and ongoing changes in the following physical variables in the North Sea: temperature, salinity and stratification; currents and circulation; mean sea level; and extreme sea levels. The distinctive features of the Wadden Sea are treated with a special focus on nutrients and sediments. This chapter covers the past 200 years and focuses on the historical development of evidence (measurements, process understanding and models), the form, duration and accuracy of the available evidence and what the evidence shows in relation to the state and trends of the respective variables.
Much work has focused on detecting long-term changes in the North Sea region, either from measurements or models. Attempts to attribute such changes to, for example, anthropogenic forcings are still lacking for the North Sea.
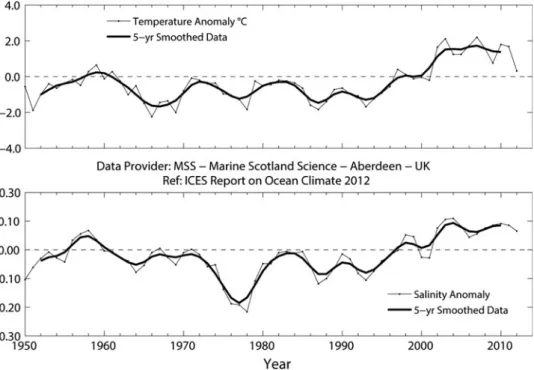
Temperature, Salinity and Stratification
Meyer et al. 2011) and in all seasons (Fig. 3.4), even though the variability between winter and spring is greater than the variability in summer and autumn. On ten-year time scales, the salinity of the upper layer is also positively correlated with the winter NAO, especially in the eastern part of the spine (Holliday et al. 2011). Adjacent Atlantic waters in the period Hughes et al. 2011) show positive salinity anomalies of more than two (one) standard deviation in Rockall Trough (Faroe-Shetland Channel), while the North Sea has no comparable clear signal.
The configuration of stratified regions in summer controls much of the mean flow in shelf seas (Hill et al. 2008). The warmest summer in the simulated period (2003) hardly appears in any thermocline characteristics (Lorkowski et al. 2012). The multi-decadal follow-up by Meyer et al. 2011) for the North Sea confirmed that the variability in stratification is mainly interannual.
The timing of spring stratification in the north-west North Sea was modeled for the period and compared to the variability observed by Sharples et al.
Currents and Circulation
Long-term trends have not yet been determined (Cunningham et al. 2010), although Smeed et al. While the subpolar gyre was relatively weak during the period, warmer, saltier waters in the Mediterranean and eastern North Atlantic Oceans flowed poleward around Great Britain (Lozier and Stewart 2008; Hughes et al. 2012). However, observations show no significant long-term trend in the transport of Atlantic water to the northeast past Scotland and Norway (Orvik and Skagseth 2005; Mork and Skagseth 2010; Berx et al. 2013).
Inflow of oceanic waters into the North Sea from the Atlantic, primarily in the north driven by prevailing southwesterly winds, is modeled by Hjøllo et al. Strong currents to the North Sea (and North Sea) often correspond to high salinity events (Sundby and Drinkwater 2007). Offshelf flow is persistent in the Norwegian Trough and in a bottom layer below the poleward along-slope (Holt et al. 2009; Huthnance et al. 2009).
When the zone of freshwater influence (ROFI) is stratified, transboundary tidal currents can develop; for example, according to de Boer et al. 2009) surface currents rotate clockwise and bottom currents counterclockwise in Reno ROFI when it is stratified.
Mean Sea Level
On longer time scales, the variability of the North Sea circulation and hence the transport is linked to variations in the large-scale atmospheric circulation. 2015) reported the results of an EOF analysis (see von Storch and Zwiers 1999) of monthly mean fields of vertically integrated volume transports derived from a multi-decadal posterior model (Fig.3.14; see also Mathis et al.2015) . MSL is sea level averaged to monthly or annual mean values, which are the parameters of most interest to climate researchers (Woodworth et al. 2011).
Vectors indicate directions of transport anomalies, while colors indicate magnitudes (leftEmeis. et al.2015); Corresponding coefficient time series (red) and NAO index (blue) (rightHurrell et al.2013). Since then, many other studies of MSL changes for specific stretches of the North Sea coastline have been carried out, mostly on a country-by-country basis, such as by Araújo (2005), Araújo and Pugh (2008), Wöppelmann et al . The most detailed analysis of 20th century geocentric MSL changes was made by Woodworth et al.
Using correlation analyses, Wahl et al. 2013) showed that some of the variability was consistent throughout the region, with some differences between the inner North Sea (number 4 clockwise to 26 in Fig.3.15) and the English Channel.
Extreme Sea Levels
In summary, the observed long-term changes in sea level rise (SLR) in the North Sea do not differ significantly from global rates over the same period. In general, and consistent with the results obtained from observations, such studies do not show any long-term trend, but pronounced decadal and interannual variability consistent with observed changes in storm activity (e.g., Langenberg et al. 1999; Weisse and Pluess 2006). In the analysis of von Storch and Reichardt (1997), annual mean high water is used as a proxy to describe changes in the mean.
Climatically induced changes in mean annual high water statistics are primarily due to two different contributions: (i) corresponding changes in MSL and/or (ii) changes in tidal dynamics. Separating the two papers, Mudersbach et al. 2013) found for Cuxhaven since 1953 that, in addition to changes in MSL, extreme sea levels have also increased due to changing tidal dynamics. Woodworth (2010) and Müller (2012) suggested other possible reasons for changes in tidal components, but were not investigated for the North Sea.
As far as storm surges are concerned, numerical models are therefore often used to draw conclusions about long-term changes in the past gulf climate.
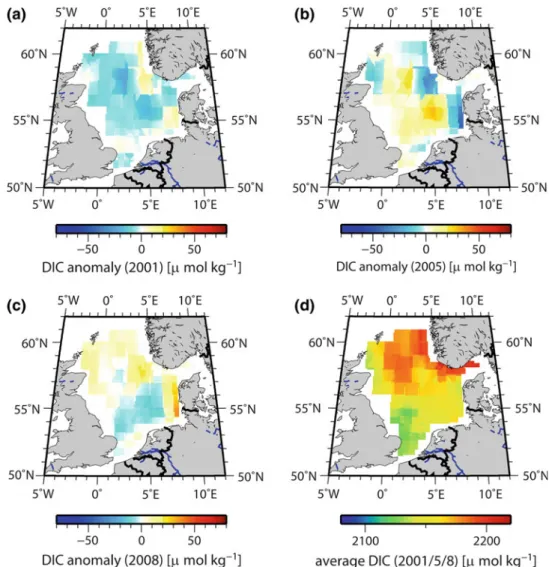
Carbon Dioxide, pH, and Nutrients
Many processes in the North Sea are reported to be associated with the winter NAO, even if they occur in later seasons. An example of preconditioning is the water mass exchange between the North Atlantic Ocean and the North Sea. Weaker winds and circulation in the North Sea are associated with negative NAO (see Sects.1.4.3 and 3.3.2) and reduce the upward mixing of cold winter water (Salt et al. 2013).
Strong NAO-driven counterclockwise circulation in the North Sea in 2008 also strengthened the distinct features of the southern and northern North Sea and sharpened the transition between them (e.g., high to low pH, see Salt et al. 2013: their Fig. 2). These factors can be considered key to regulating the North Sea's response to climate change and more direct anthropogenic influences. According to this simulation, the net heterotrophic state of the North Sea in 1996 (with extremely negative winter NAO) was stronger than in 1995.
Climate, CO2 and more direct anthropogenic drivers also determine the variability of carbon fluxes in the North Sea.