Yet the poorest half of the world - roughly speaking the low-income countries (LICs) and lower middle-income countries (LMICs) - lack market access to capital on acceptable terms. We reaffirm our commitment to a global response to accelerate progress on the implementation of the SDGs and to support a sustainable, inclusive and resilient recovery worldwide." Lower-middle-income countries (LMICs) account for 42.9% of the world's population, but accounts for only 15% of investment expenditure.
Together, LICs and LMICs account for about 10% of global fiscal expenditure, while UMICs and HICs account for about 90%.
Education and social protection to achieve universal secondary education (SDG 4) and poverty reduction
There is generally a positive and statistically significant correlation between total government expenditure per capita per year (in USD PPP) and the SDG index score (Figure 1.1). Based on this simple correlation analysis, the relationship between government spending and SDG outcomes is particularly strong among relatively low-spending countries.
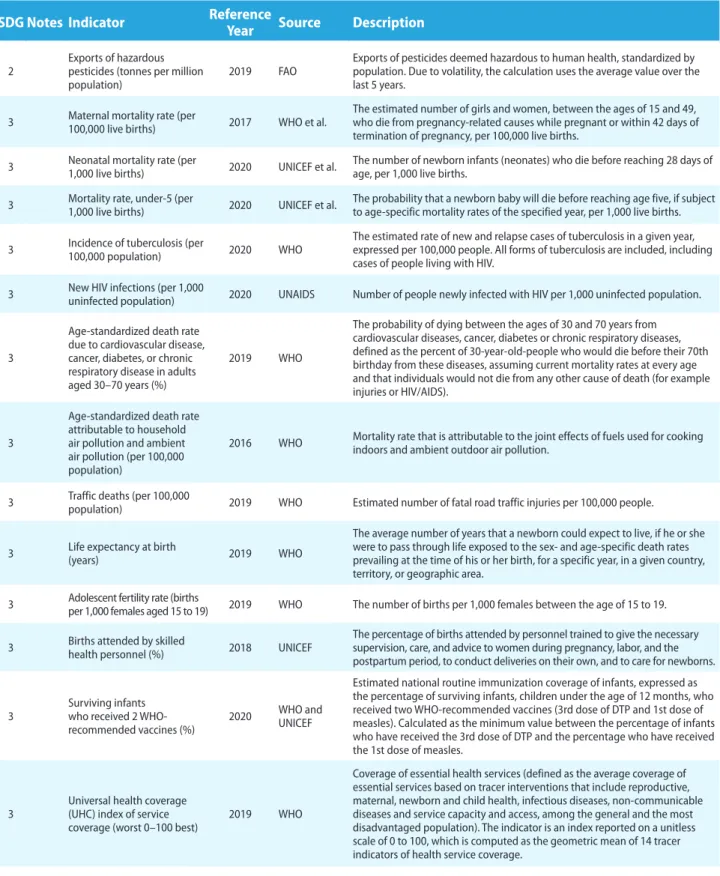
Health systems to end the pandemic and to achieve Universal Health Coverage (SDG 3)
Zero-carbon energy and circular economy to decarbonize and slash pollution (SDG 7, SDG 12,
Sustainable food, land use, and protection of biodi- versity and ecosystems (SDG 2, SDG 13, SDG 15)
Global trends and rankings
The decline in the SDG Index score since 2019 is mainly caused by a reversal in progress on socio-economic targets. Due to delays in data reporting, the full impact of the multiple crises, including the COVID-19 pandemic, is not fully reflected in this year's SDG index. This year's SDG index also does not yet provide a picture of the war in Ukraine and its impact.
The top ten countries in the SDG Index are all in Europe, eight of them members of the European Union.
Regional editionsGlobal editions
For more detailed regional and sub-national analyzes of SDG data and policies, see SDSN's special editions of the SDR for Africa, the Arab Region, Europe, Latin America and the Caribbean (2019) and also for national and sub-national entities in Benin, Bolivia, Brazil , Italy, Paraguay, Spain, United States and Uruguay (among others) on our website (www.sdgindex.org). These are developed and prepared in close cooperation with global, regional and national networks of experts and research institutions and other local SDSN partners.
Subnational editions
SDG dashboards and trends by income groups and major world
Overall, high-income countries (HICs) and OECD countries are closer to achieving the goals than other country groups, but none are on track to achieve all 17 SDGs. Further efforts are also needed to reduce the gender pay gap in order to achieve SDG 5 (gender equality) in many OECD countries. All HICs and OECD countries generate significant negative socio-economic and environmental impacts outside their borders (spillovers) through trade and consumption, hampering other countries' efforts to achieve the SDGs.
Tax havens and profit shifting in some OECD countries continue to undermine the ability of other countries to leverage resources to achieve the SDGs.
Major challenges for high-income countries
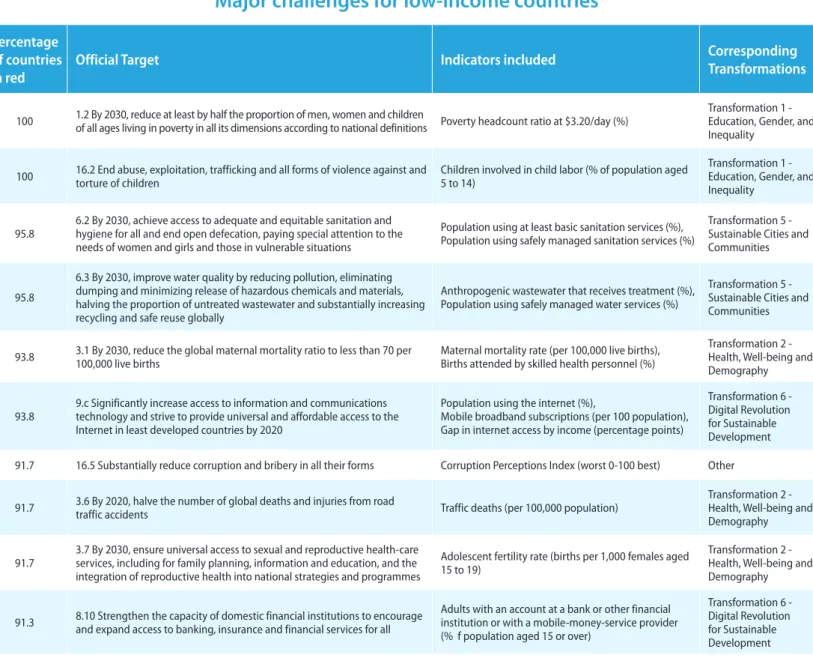
Major challenges for low-income countries
- International spillovers
- SDG Financing: Rich countries bear a special respon- sibility when it comes to climate adaptation and mit-
- Technical Cooperation and SDG diplomacy
- National targets and instruments: In 2022, Sweden became the first country to commit to setting a
- Accountability, data, and statistics: Robust data systems are paramount at the international, national,
- Political leadership and policy environment: results from the
Countries cannot achieve the SDGs if such negative externalities from other countries negate their efforts (Schmidt-Traub et al., 2019). The 2030 Agenda and the SDGs recognize the importance of international spillovers in several crucial ways. These spillovers are particularly linked to SDG 16 (Peace, Security and Strong Institutions) and SDG 17 (Partnerships for the Goals), but are also indirectly linked to most SDGs – including poverty, hunger and health, as well as other socio-economic goals.
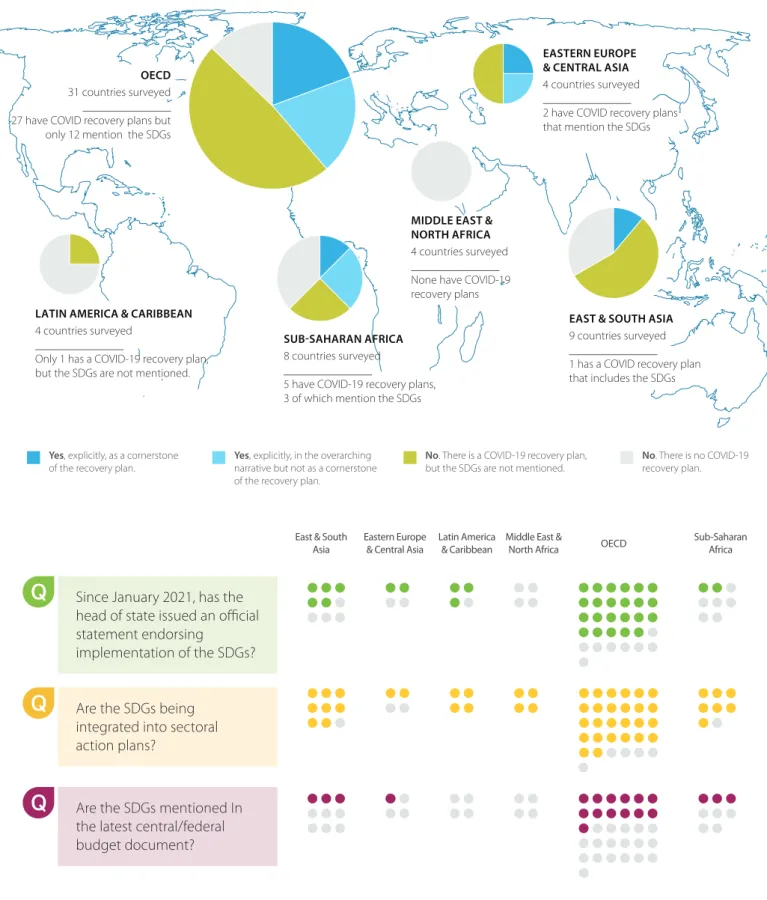
Rich countries tend to create the largest negative spillover effects, undermining other countries' efforts to achieve the SDGs. For the first time, we are also presenting a prototype of the results of government commitments and efforts in support of sustainable development goals. Every year, SDSN mobilizes its global network of experts to monitor the public statements of governments and the strategic use of public practices in support of the goals of sustainable development.
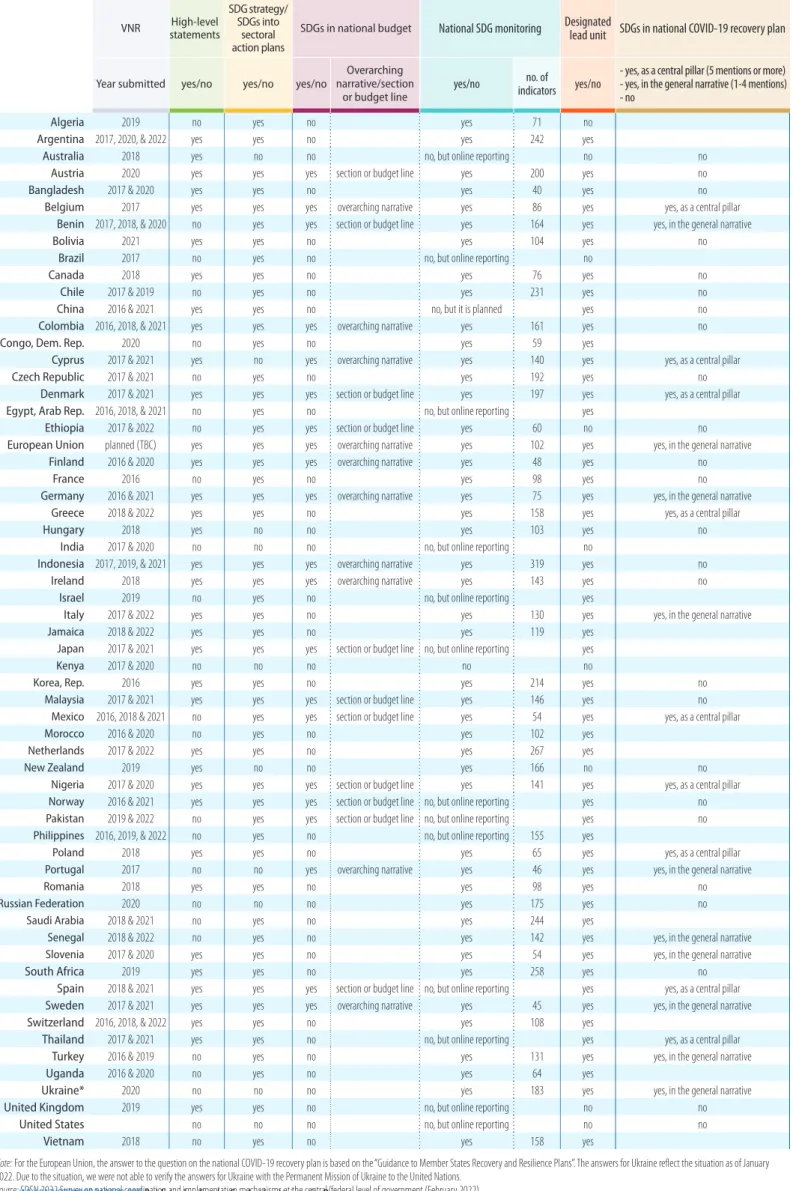
Six years after the adoption of the 2030 Agenda and SDGs in 2015, a majority of governments had developed strategies and action plans by 2021 to achieve the goals. With regard to SDG coordination units and mechanisms, we note that most countries have appointed a lead unit or body responsible for coordinating the implementation of the SDGs (Figure 3.1). In the past 12 months, just over half of the countries surveyed have reaffirmed their commitment to the SDGs in the context of an official speech or statement by the head of state (president or prime minister).
The other half refers only to the SDGs in the general narrative, providing fewer SDG-specific budget allocations. Several countries surveyed do specifically refer to the SDGs in their national budget to support both domestic SDG implementation (including national health, education, social protection or economic development reforms) and SDG implementation abroad (for example aid allocation or foreign policy ).
The six SDG Transformations scorecards
The six SDG transformations provide a detailed framework for constructing integrated strategies for the SDGs (Sachs et al., 2019). They can be implemented in all countries to help manage trade-offs and synergies across the SDGs. At the heart of the Six Transformations is the recognition that all 17 SDGs can be achieved through six major societal transformations, focused on: (1) education and skills, (2) health and well-being, (3) clean energy and industry, ( 4 ) sustainable land use, (5) sustainable cities and (6) digital technologies.
Building on last year's work, in this section we present an updated and improved version of the SDG transformation indicators. Each indicator consists of a collection of main policy measures to monitor the implementation of the Sustainable Development Goals. At the international level, results data tend to present significant time lags: they may not adequately reflect the impact of transformative policies and investments introduced by governments since the adoption of the SDGs, as these often only produce results in the medium or long term.
The scorecards instead focus on the enabling legal, regulatory and investment conditions needed to achieve the SDGs and the. Firstly, internationally comparable policy trackers and measures (such as laws, regulations, investments and subsidies) are generally less available than international outcome data. Second, policy efforts should be interpreted with an understanding of national challenges and contexts (e.g. the absence of sophisticated cybersecurity policies is less important in a country with little internet access and poor digital infrastructure).
The remainder of this section provides a brief overview of countries' policy efforts and commitments to achieving the six SDG transformations, highlighting where more research and policy follow-up is needed to broaden our understanding of national SDG efforts. Education builds human capital, which in turn promotes economic growth, innovation, decent work and the eradication of extreme poverty, and helps overcome gender and other inequalities.
Education, Gender and Inequality
Countries must also ensure that any economic stimulus from COVID-19 recovery packages is consistent with the Paris climate goals and supports the transition to net-zero emissions by 2050. They account for a quarter of greenhouse gas emissions, over 90 percent of scarcity-weighted water use, the majority of loss of biodiversity, overexploitation of fisheries, eutrophication through nutrient overload and the pollution of our water and air. Debate continues over the "30x30" biodiversity target: a proposal to have at least 30 percent of the Earth's surface under conservation status by 2030.
It closely aligns with SDG target 3.8 of achieving universal health coverage and ensuring that all people have access to the health services they need. In the SDGs, QSU is considered an objective in itself, but for the purposes of the SDG Transformation scorecards we consider UHC as an enabler (input) for greater health outcomes. Compared to the rest of the world, a higher proportion of people in OECD countries tend to be covered by public or compulsory private health insurance and the incidence rate of catastrophic out-of-pocket health expenditure is lower - although there are exceptions, including Mexico. , Costa Rica, Poland and the United States.
The SDGs also call on all countries to strengthen their capacity for early warning, risk reduction and management of national and global health risks (SDG target 3.d). The Global Health Security Index, a measure of pandemic preparedness, was found to be a fairly poor predictor of effective early response to COVID-19, as measured by number of cases and deaths (Lafortune, 2020), indicating that there are important factors at play , which is not yet adequately captured by existing policy trackers. Going forward, it will be important to define solid international measures and monitoring systems to better measure countries' preparedness against global threats to health.
This transformation aims to ensure universal access to modern energy sources, decarbonise the energy system by mid-century (in line with the Paris Agreement), and reduce industrial pollution of soil, water and air. More than 130 countries have signed the UN Climate Ambition Alliance and more than 50 have enshrined their net zero commitment in a law or policy document (Net Zero Tracker, 2022;.
Health, Well-being and Demography
Energy Decarbonization and Sustainable Industry
- Governments’ SDG commitments versus SDG Index gaps
- Data innovations during the COVID-19 pandemic
- Emerging lessons for data systems
- Interpreting the SDG Index and Dashboards results
- Changes to the 2022 edition and main limitations
- Methodology (overview)
- Data selection
- Missing data and imputations
- Method for constructing the SDG Index and Dashboards
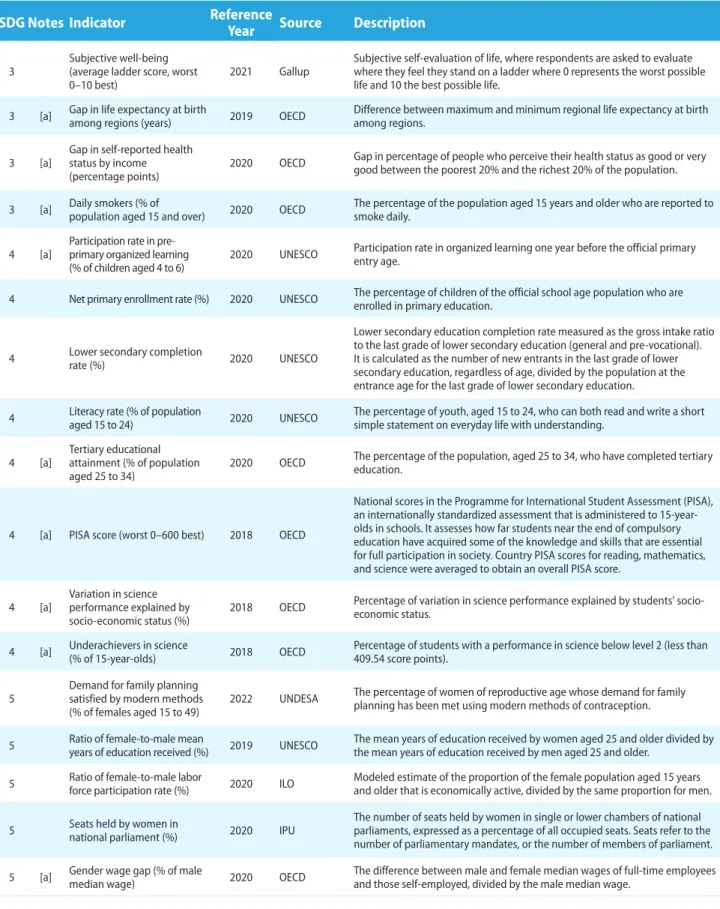
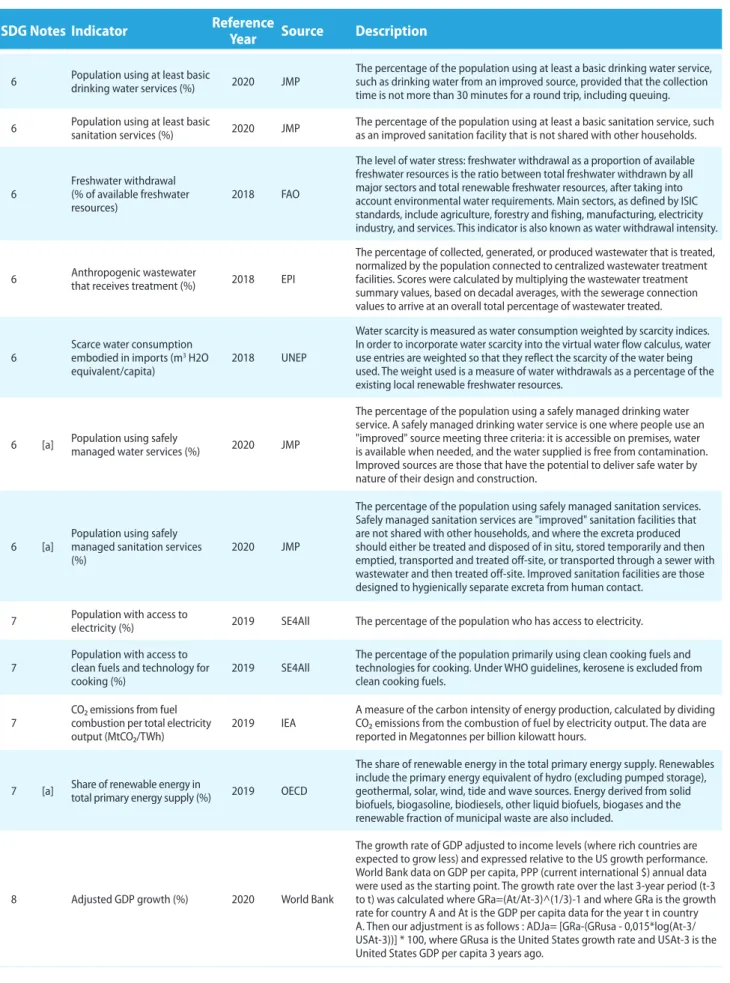
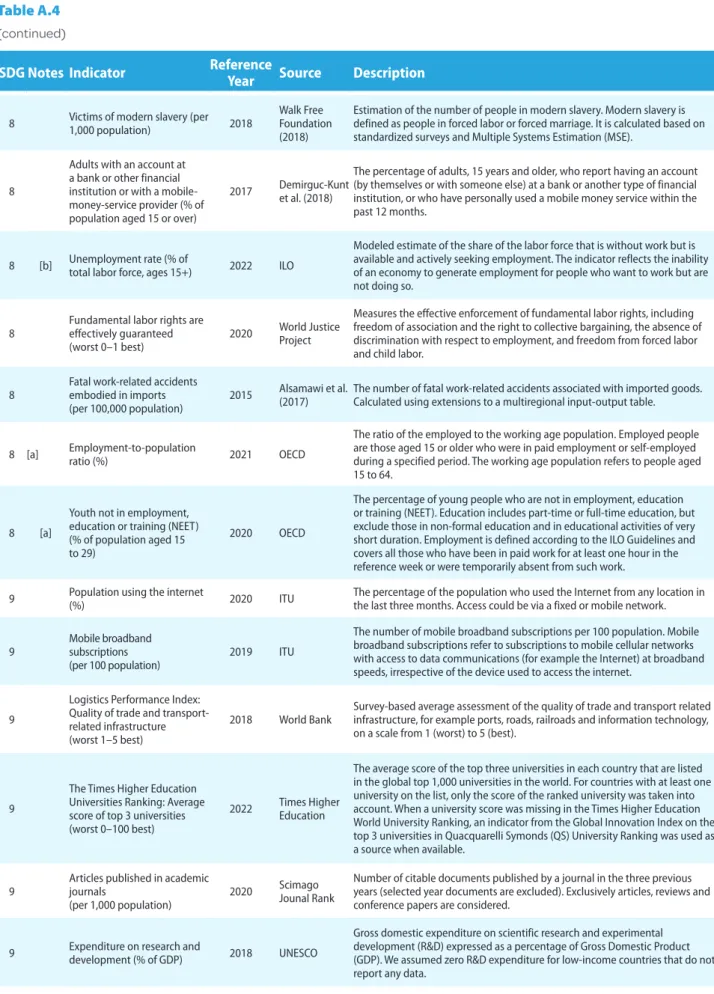
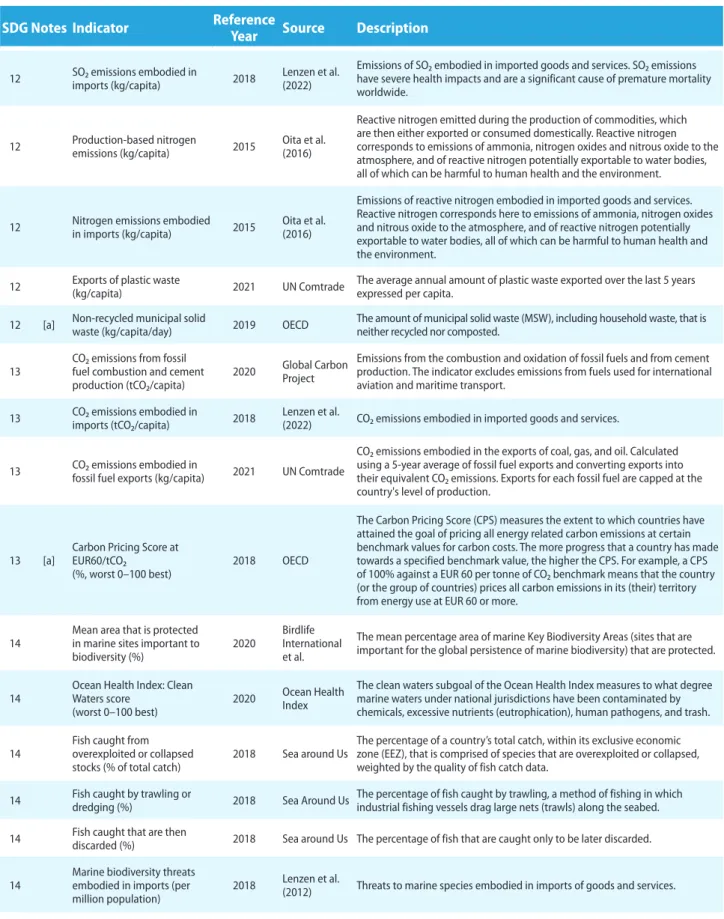
This section provides a brief overview of the methods used to calculate the SDG Index and the dashboards. Most of the data (about two-thirds) comes from international organizations (including FAO, ILO, OECD, UNICEF, WHO and the World Bank), which have extensive and rigorous data validation processes. The estimated percentage of the population living below the poverty line is $1.90 per day.
Estimated percentage of the population living below the poverty threshold of US$3.20 per day. Relative poverty is measured as the share of the population whose income falls below half of the median disposable income for the entire population. The percentage of the population whose food intake is insufficient to meet dietary energy requirements for a minimum of one year.
4 Net primary enrollment rate (%) 2020 UNESCO Percentage of children of the official school-age population who are enrolled in primary education. The weight used is a measure of water withdrawal as a percentage of existing local renewable freshwater resources. Slum population is the percentage of the urban population living in slum households.
The percentage of the urban population with access to improved drinking water through on-site piping. The percentage of children aged 5 to 14 who were involved in child labor at the time of the survey. COVID-19 Data and Innovation Center: Visualize the effects of the pandemic and the possible solutions.
Updated estimates of the impact of COVID-19 on global poverty: reversing the pandemic in 2021.