1
© Inter-American Development Bank 2016
M. Grazzi and C. Pietrobelli (eds.), Firm Innovation and Productivity in Latin America and the Caribbean, DOI 10.1057/978-1-349-58151-1_1
CHAPTER 1
After a decade of relatively strong performance, growth in Latin America and the Caribbean (LAC) has begun to taper. This slowdown is even more worrisome considering the long-run economic performance of the region, where it is evident that there is diffi culty in catching up with developed econ- omies and even just keeping pace with other emerging regions. Over the last half-century, per capita income in Latin America has stagnated relative to the United States, while in East Asian countries 1 it has grown steadily since 1960, reaching a level that is almost half of current US levels. The expected fall in commodity prices may further hinder LAC’s economic performance.
Determinants of Enterprise Performance in Latin America and the Caribbean:
What Does the Micro-Evidence Tell Us?
Matteo Grazzi , Carlo Pietrobelli , and Adam Szirmai
M. Grazzi
Inter-American Development Bank e-mail: [email protected]
C. Pietrobelli
Inter-American Development Bank and University Roma Tre e-mail: [email protected]
A. Szirmai UNU-MERIT
e-mail: [email protected]
This tapering raises various questions. For example, what is behind LAC’s disappointing performance? And, why have other regions developed so much more rapidly than LAC? The central argument of this book is that answering such questions requires going beyond analyzing macroeconomic trends to analyzing the micro-dynamics of development. The chapters focus on fi rm- level sources of productivity growth. How are they related to the characteris- tics and strategies of fi rms? To what extent are productivity gains determined by better production methods, organizational improvements, fi rm-level innovation, learning, and capability development? Finally, what are the impli- cations of microeconomic analysis for industrial and innovation policy?
Following the logic of the aggregate production function, factors of accumulation (capital and labor) and productivity (taken as a measure of technological progress) explain economic growth. A simple growth accounting exercise confi rms recent economic research: despite years of ris- ing factor accumulation, slow productivity growth is at the root of LAC’s weak overall performance (Fernández-Arias 2014 ; Crespi et al. 2014 ; Pagés 2010 ). Between 1960 and 2011, GDP per capita in LAC grew at 1.79 %, just below the rate for the United States over the same time period.
The region was also able to outpace the United States in terms of fac- tor accumulation. However, in the USA, total factor productivity (TFP) grew at 1.21 %, while it stagnated in LAC, more than compensating for the lower factor accumulation. Thus, TFP can clearly be blamed for the LAC region’s inability to catch up with US GDP per capita (Table 1.1 ). 2 Table 1.1 Growth accounting: LAC vs. comparison countries (1960–2011) (%) Country/ region ∆ GDP per capita ∆ Factor accumulation ∆ TFP % share
Average ( a ) ( b ) ( a − b = c ) ( c / a ) Latin America and the
Caribbean
1.79 1.80 −0.01 −0.6 % East Asia and Pacifi c 3.69 2.85 0.83 22.5 % United States 1.99 1.21 0.78 39.2 % China 6.04 4.21 1.83 30.3 % Finland 2.74 1.44 1.30 47.4 %
Source : Authors’ elaboration on data from Feenstra et al. ( 2015 )
Notes : The LAC countries are Antigua and Barbuda, Argentina, Bahamas, Barbados, Belize, Bolivia, Brazil, Chile, Colombia, Costa Rica, Dominica, Dominican Republic, Ecuador, El Salvador, Grenada, Guatemala, Honduras, Jamaica, Mexico, Panama, Paraguay, Peru, St. Kitts & Nevis, St. Lucia, St. Vincent &
the Grenadines, Suriname, Trinidad & Tobago, Uruguay, and Venezuela. The East Asia and Pacifi c countries are Australia, Brunei, Cambodia, China, Fiji, Hong Kong, Indonesia, Japan, Laos, Macao, Malaysia, Mongolia, New Zealand, Philippines, Singapore, South Korea, Thailand, and Vietnam. Physical capital and human capital are considered productive factors in the production function
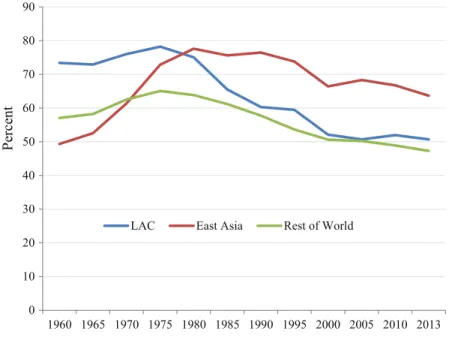
The LAC region’s weak TFP performance is a stark contrast to other countries that were at similar development levels in 1960 but have since been able to converge toward US levels. For example, in Finland, TFP increased to 69 from 50 % of the US level over the past 54 years, while in South Korea it went to 63 from 20 % over the same period. In fact, the East Asian countries successfully boosted TFP relative to the United States from 49 % in 1960 to 78 % in 1980 and, after some decline, they were at 64 % in 2013 (Fig. 1.1 ). The story for LAC is the opposite: between 1960 and 2011, GDP per capita growth in LAC was only sustained by factor accumulation, not by TFP growth, and productivity declined from 73 % of US TFP in 1960 to only 51 % in 2013.
While the aggregate picture of LAC reveals overall weak performance in terms of productivity, analysis by country shows remarkable heterogeneity.
Figure 1.2 plots the annual TFP growth of LAC countries between 2000 and 2011 against the productivity (TFP) gap relative to the United States in 2011. On the whole, since 2000, average productivity growth in the LAC region has declined by 0.04 percent per year. However, not all LAC
0 10 20 30 40 50 60 70 80 90
1960 1965 1970 1975 1980 1985 1990 1995 2000 2005 2010 2013
Percent
LAC East Asia Rest of World
Fig. 1.1 TFP relative to the United States (1960–2013) ( Source : Fernández- Arias 2014 )
countries have followed this pattern. Honduras, for example, has seen a dramatic decline in absolute productivity growth (1.6 percent per year) since 2000 relative to a high productivity gap with the United States (69 percent in 2011). Other Central American countries, such as Costa Rica and Guatemala, recorded similar negative productivity growth, although with much narrower productivity gaps (40 percent relative to the United States). In contrast, South American countries tended to see more posi- tive productivity growth, with the exception of Brazil and Uruguay where productivity declines over 1 percent per year.
The macro-evidence presented so far clearly indicates that LAC coun- tries have been growing at lower rates than some other emerging regions and that they are failing to effi ciently combine production inputs. If eco- nomic growth based on factor accumulation is subject to diminishing returns and successful catch-up requires fast productivity growth (Easterly and Levine 2001 ; Hall and Jones 1999 ; Klenow and Rodriguez-Clare
Argentina
Bolivia
Brazil
Chile
Colombia
Costa Rica Dominican Republic Ecuador
Guatemala Honduras
Jamaica
Mexico Panama
Paraguay Peru
Uruguay
Venezuela
LAC
0.0%
1.0%
2.0%
3.0%
4.0%
-0.8 -0.6 -0.4 -0.2
-2.0%
-1.0%
0.0
Annual Productivity Growth. (2000–2011)
Productivity Gap Relative to the United States (2011)
Fig. 1.2 Productivity performance by country (2000−2011) ( Source : Fernández- Arias 2014 )
1997 ), the fact that LAC countries have not been able to signifi cantly increase their productivity is particularly worrisome. Indeed, this led us to investigate the reasons. In summary, what explains productivity and its evolution over time?
The research on this key issue is vast and has expanded in recent years (Syverson 2011 ). Many studies use macroeconomic data to estimate aggregate production functions and obtain the results we have described.
However, the economic performance of a country or sector ultimately depends on decisions made at the fi rm level and this should explicitly be taken into account. Therefore, a disaggregated enterprise-level approach is necessary to obtain a deeper and more complete understanding of the dynamics of productivity growth (Foster et al. 2001 ). When the microeconomic dimension is introduced into the analysis, the economic literature has shown that fi rm productivity growth is essentially driven by two factors: reallocation of resources across fi rms; and within-fi rm effi - ciency improvements (Dollar et al. 2005 ; Bergoeing and Repetto 2006 ). 3
The fi rst factor, reallocation across fi rms, is only possible when resources can be easily allocated to different activities in the presence of smoothly functioning markets (Busso et al. 2013 ). In this context, the competi- tion generates Schumpeterian creation and destruction processes, both within the same sector and across sectors. In the latter case, the process is expected to reshape economies toward more productive structures by shifting resources from less to more productive sectors. However, this shift does not appear to have happened in LAC in recent years, which led McMillan et al. ( 2014 ) to conclude that, during 1990–2005, the LAC region experienced signifi cant productivity gains within the same sectors, but that displaced workers from the least productive fi rms ended up in less productive activities. “In other words, rationalization of manufacturing industries may have come at the expense of inducing growth-reducing structural change” (McMillan et al. 2014 : 19).
The focus of this book is the second source of productivity growth:
within-fi rm improvements that result from fi rm-specifi c characteristics, behaviors, and strategies. Here, effi ciency gains can be explained as the result of improvements in management, internal organization, strategies, or technological capabilities as reactions to market incentives.
The interaction between fi rm-specifi c factors leads to high heterogene- ity in fi rm productivity growth over time and, consequently, fi rms with disparate productivity levels can coexist, even within the same sectors. 4 For example, Syverson ( 2011 ) found that, within four-digit Standard Industrial Classifi cation industries in the US manufacturing sector, the
plant at the 90th percentile of productivity distribution had almost twice as much output as that at the 10th percentile with the same measured inputs. Even larger productivity differences were recorded in China and India, with average 90:10 TFP ratios over 5:1 (Hsieh and Klenow 2009 ).
Evidence from LAC confi rms this situation: overall, the region is charac- terized by large disparities in productivity (Busso et al. 2013 ; Pagés 2010 ), with many low-productivity fi rms coexisting with few high-productivity fi rms (Lavopa 2015 ). Using World Bank Enterprise Survey (WBES) data for LAC, we found that the difference between the 90th and 10th per- centiles of labor productivity distribution in the manufacturing sector is around 10:1. In Fig. 1.3 , this trend is apparent for both the manufactur- ing and services sectors. Most fi rms are clustered at very low levels of pro- ductivity, but there are some highly productive fi rms. It is interesting to note that the distribution for the manufacturing sector appears to be more skewed than for the services sector, 5 extending much further to the right.
Dualism is a phenomenon that is frequently encountered in developing countries, and LAC is no exception. From a theoretical point of view, dual- ism has been explained differently by scholars belonging to various schools of thought. On the one hand, the neoclassical approach stresses the role of mar- ket incentives and generally the macroeconomic context that induces fi rms to behave differently in response to different prices. Heterogeneity is the upshot of market imperfections, as a result of which ineffi cient fi rms are not forced to exit the market (e.g. Busso et al. 2013 ). On the other hand, evo- lutionary and managerial approaches refer to: the intrinsic characteristics of fi rms; their internal organization, routines, and practices; and specifi c strate- gies to accumulate technological capabilities, learn, and innovate (Williamson
Density
Labor productivity Services Sector
Density
Labor productivity Manufacturing Sector
Fig. 1.3 LAC productivity distributions, 2010 ( Source : Authors’ elaboration using WBES data)
1973 , 1985 ; Dosi 1988 ; Katz 1987 ; Lundvall 1992 ; Malerba 2002 ; Nelson and Winter 1982 ; Nelson 1991 ). Lall ( 1992 ) suggested, for example, that the development of fi rm capabilities is the result of the interplay between a
“complex interaction of incentive structures with human resources, techno- logical effort and institutional factors.” Meanwhile, the dynamic capabilities approach advanced by Teece and Pisano ( 1994 ) argues that the strategic dimensions at the disposal of a fi rm range from managerial and organiza- tional processes, their present position, and the paths available to them.
These approaches attribute fi rm performance to the unique characteristics embedded within fi rm-specifi c decision-making, organization, and processes.
Foster et al. ( 2001 ) asserted that the magnitude of within-sector heteroge- neity implies that fi rm-specifi c factors determine whether they achieve rapid productivity growth or suffer declines. They cited such factors as uncertainty of demand for the fi rm’s products, managerial ability, the nature of installed capital, upgrading capabilities, location, and the diffusion of knowledge con- cerning new technologies. For example, uncertainty over market demand and profi tability may lead fi rms to experiment to discover which technolo- gies or processes best meet local market conditions (Jovanovic 1982 ; Ericson and A. Pakes 1989 ). Firm-level productivity will be affected by the success of such experimentation, and fi rms that have developed or acquired effi cient technologies and know-how can put them to work, with immediate effects on productivity levels. Those fi rms still experimenting with how to most effi ciently use their inputs may suffer from low productivity.
The substantial heterogeneity in fi rm performance provides the analyti- cal foundation for this book, raising the question why some fi rms perform well while others fail. The core of the book seeks to empirically analyze the drivers of this heterogeneity, such as training, access to information and communication technologies (ICTs), international linkages, innova- tion, and access to fi nance. The heterogeneity present among fi rms in the region suggests the need to go beyond one-size-fi ts-all fi rm growth policies. There is an important challenge here for policymakers to devise policies that refl ect the diverse nature of enterprises in LAC.
M
OTIVATIONFORT
HISB
OOKDepending on the objective of the intervention, policies to promote enterprise development can assume very different forms. Thus, for exam- ple, policies may address the two different sets of factors that in principle affect fi rm performance: (i) internal factors, which at least in principle are within a business’s control, and (ii) external factors, which are aspects
of the operating environment (Syverson 2011 ). Among the former are a host of elements that range from internal fi rm characteristics, technologi- cal capabilities, organizational structure, and linkages between fi rms and within networks, to sector-specifi c factors. Among the latter are the exter- nal pressures that infl uence fi rm behavior and success, including competi- tion, the business environment, and the institutional framework.
Over the past 20 years in LAC, priority has been given to macroeco- nomic reforms that typically address the external factors, preventing an effi cient allocation of resources across sectors and fi rms by improving the business and investment climate and market functioning. However, despite their relative success, these policies alone constitute a broad brush effort to address the needs of fi rms. In fact, although a sound institu- tional and regulatory framework is a necessary condition for sustained fi rm growth, once these barriers are reduced, fi rms respond to the same frame- work in different ways, depending on their characteristics and strategies.
Once the basic framework is set in place, achieving effi ciency improve- ments within fi rms requires detailed microeconomic policies that also address the internal factors that are hindering fi rm-level productivity. 6
Moreover, macroeconomic reforms bring about once-and-for-all static gains. Once market fl exibility is achieved (or restored) and the benefi ts from reallocation have materialized, these gains cannot be repeated. In contrast, the advantages from within-fi rm effi ciency improvements can be pursued continuously through efforts and investments in innovation, human capital, and increasing credit access, among others. Despite this, macroeconomic conditions are often cited as playing the most signifi cant role in shaping fi rms’ trajectories. While important, these factors do not adequately take into account the specifi c characteristics, strategy, and behavior that are equally, if not more, responsible for sustained fi rm development. But the priority given to macroeconomic reforms has shifted interest away from the microeco- nomic dimension, leading many LAC governments to place microeconomic concerns further down the policy agenda (Solimano and Soto 2006 ).
This book contributes to bringing the microeconomic agenda back to the forefront by presenting and critically discussing new evidence about the drivers of within-fi rm productivity improvement across the region. A better understanding of the factors that foster or hinder fi rm performance is increas- ingly important from the perspective of economic policies. In fact, while there is widespread consensus on appropriate macroeconomic policies, the variety and ongoing experimentation with many different microeconomic policies in the region reveals that the policy debate is far from being settled.
As a consequence, this variety is not mirrored by volume, and the size and scope of government programs aimed at directly supporting enterprise
development across LAC remain limited. For example, Brazil, the Latin American country that devotes the largest amount of resources to fi rm development, is reported to use 0.085 % of its GDP to support small and medium-sized enterprises (SMEs). In the United States, this fi gure is nearly fi ve times higher (ECLAC 2014 ). WBES data for LAC allow us to assess the diffusion of such instruments and the actual level of fi rm participation. 7 Overall, approximately 10.7 % of all fi rms report having received some type of public support over the previous three years. But large differences emerge when the responses are broken down by fi rm size. Only 6.6 % of micro-fi rms and 9.4 % of small fi rms report receiving support, compared to 14.4 % of medium-sized fi rms and 15.8 % of large fi rms (Table 1.2 ). Most fi rms use only one publicly funded instrument and only a small fraction par- ticipate in two or more programs (2.9 %). Again, larger fi rms tend to partic- ipate more often in various programs at the same time, and evidence shows that it is often important to participate in different programs to obtain their full benefi ts (Álvarez et al. 2012 ). If we consider that many public pro- grams in the region are designed to support SMEs, the fact that large fi rms are using them disproportionately raises some doubts about the targeting capacity of the institutions in charge of such programs in the region.
Disaggregating fi rm participation by typology of intervention, innovation support turns out to be the most frequently used instrument, with 5 % of fi rms using it. This is followed by quality certifi cation and business development services (3.8 %) (Table 1.3 ). At the other extreme, only 1.5 % of the fi rms use instruments that facilitate business alliances with suppliers and clients, and 2.1 % participate in export promotion programs. In all these cases, participa- tion rates increase with fi rm size. On the whole, this evidence alludes that fi rms in Latin America tend to participate very modestly in public programs.
In the Caribbean, this number is even lower, as public support for innova-
Participation in:
At least one program (%)
Only one program (%)
Two or more programs (%)
All fi rms 10.7 7.7 2.9
Micro fi rms 6.6 5.1 1.4 Small fi rms 9.4 6.6 2.8 Medium fi rms 14.4 10.4 4.0 Large fi rms 15.8 11.7 4.1
Source : World Bank ( 2010 )
Notes : Includes both partially or entirely government funded programs
Table 1.2 LAC fi rms participating in publicly supported programs
tion is still sporadic. According to WBES data, only 1.5 % of Caribbean fi rms declared they had participated in innovation-related programs in 2010. This low percentage is confi rmed by the data of the Productivity, Technology, and Innovation in the Caribbean (PROTEQin) Survey. In 2014, only 2.7 % of fi rms received public support for innovation activities.
This book uses a series of econometric models with microeconomic data primarily from the WBES to address specifi c research questions. The ques- tions were chosen based on their relevance for the region and the avail- ability of the necessary data for the analysis. Each chapter is dedicated to analyzing a different factor affecting fi rm productivity in LAC: innovation, ICT usage, on-the-job-training, fi rm age, fi rm size, access to credit, and international linkages. Two chapters explicitly analyze Caribbean fi rms.
The cross-country comparability of the results provides fi rst-hand evidence of how these factors affect fi rm performance, providing read- ers a richer understanding of fi rm dynamics in LAC. The fi ndings update understanding of the business drivers in the region, which helps inform the design and development of policies to promote business performance.
D
ATA ANDM
ETHODOLOGYThe WBES are the primary datasets used in this book. WBES data is avail- able for over 130,000 fi rms in 135 countries. 8 The World Bank collects survey information through face-to-face interviews with fi rm managers and owners regarding the business environment in their countries and Table 1.3 LAC fi rms participating in publicly supported programs by fi rm size In the last three years, fi rm used
services to:
All Micro fi rms (%)
Small fi rms (%)
Medium fi rms (%)
Large fi rms (%) fi rms (%)
Improve quality control/train to obtain quality certifi cation
3.8 2.2 3.5 5.2 5.0 Make business alliances with other
suppliers/clients
1.5 1.2 1.6 1.6 1.9 Support innovation 5.0 2.5 4.3 6.8 9.4 Support exports 2.1 1.1 1.9 3.2 2.7 Business development services
(e.g., support training or technical assistance)
2.4 1.5 2.4 3.2 2.7
Source : World Bank ( 2010 )
Notes : Includes both partially or entirely government funded programs
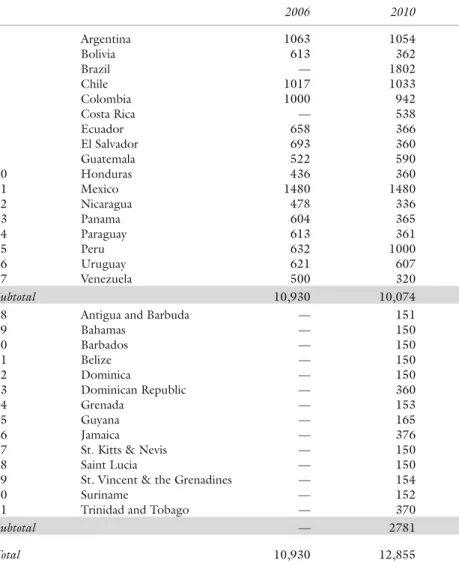
2006 2010 1 Argentina 1063 1054 2 Bolivia 613 362 3 Brazil — 1802 4 Chile 1017 1033 5 Colombia 1000 942 6 Costa Rica — 538 7 Ecuador 658 366 8 El Salvador 693 360 9 Guatemala 522 590 10 Honduras 436 360 11 Mexico 1480 1480 12 Nicaragua 478 336 13 Panama 604 365 14 Paraguay 613 361 15 Peru 632 1000 16 Uruguay 621 607 17 Venezuela 500 320
Subtotal 10,930 10,074
18 Antigua and Barbuda — 151 19 Bahamas — 150 20 Barbados — 150 21 Belize — 150 22 Dominica — 150 23 Dominican Republic — 360 24 Grenada — 153 25 Guyana — 165 26 Jamaica — 376 27 St. Kitts & Nevis — 150 28 Saint Lucia — 150 29 St. Vincent & the Grenadines — 154 30 Suriname — 152 31 Trinidad and Tobago — 370
Subtotal — 2781
Total 10,930 12,855
Source : Authors’ elaboration based on WBES data
Note : Data for Brazil is from 2009
Table 1.4 WBES: number of LAC fi rms surveyed
the productivity of their fi rms, including questions relating to infrastruc- ture, sales and supplies, competition, crime, fi nance, business development services, business–government relations, labor, and fi rm performance.
Table 1.4 lists the countries and the number of companies surveyed in
2006 and 2010 that are included in the dataset. The population of the survey is consistently defi ned in all countries as non-agricultural, non- extracting, formal, privately owned fi rms. 9 Both the manufacturing and services sectors are covered by the survey.
The Inter-American Development Bank (IDB) fi nanced the 2010 WBES in 14 Caribbean countries, the fi rst time it was conducted there.
Furthermore, the IDB fi nanced the inclusion of additional questions on key issues facing the fi rms of the region, including questions on innovation, business development services, and workforce training for human capital. 10 The global methodology for most enterprise surveys implemented since 2006 is based on a core questionnaire with a uniform universe and meth- odology of implementation. The most recent survey in LAC was con- ducted in 2010 and, in some cases, the previous WBES conducted in Latin America in 2006 allows authors to create panel datasets for participating countries. The WBES uses stratifi ed random sampling by location, size, and sector. This method guarantees that precise inferences can be made for each level of stratifi cation. The standardization of enterprise surveys across all countries strengthens the level of external validity and provides a basis for comparisons across countries in the region and with other devel- oping regions. This is especially crucial for the Caribbean, which had very little comparable fi rm-level data available before the 2010 surveys.
Despite the benefi ts of enterprise surveys, there are limitations that should be addressed. First and foremost, the surveys are administered to a representative sample of fi rms in the non-agricultural, formal, private economy. Consequently, by defi nition, the informal sector is excluded from the analysis. The effect of this limitation varies because the size of the informal economy differs by country. In countries like Paraguay and Nicaragua, the informal sector accounts for an estimated 70 % of total GDP; in Caribbean economies like the Bahamas, Grenada, St. Kitts &
Nevis, Trinidad and Tobago, and Barbados, the informal share is esti- mated to hover below 25 % of GDP (Vuletin 2008 ). Regardless of the country, the exclusion of informal fi rms requires a cautious interpretation of the empirical results.
Another data limitation is the relatively low representation of services fi rms in the survey population. This is unfortunate given that services make up 60 % of employment in the region. While both the manufacturing and services sectors are included, services fi rms were excluded from some of the key modules of the questionnaire, such as the innovation module in the 2010 survey and the labor module in the 2006 survey. When the data
allow, the authors use observations from both sectors. However, this is not possible in those chapters where services fi rms are excluded from ques- tionnaire modules, creating an unintended focus on manufacturing fi rms.
Other limitations of the data create some methodological issues that are addressed in a uniform way throughout the book. The fi rst method- ological decision was made in response to the low response rates in certain countries. The low number of observations for some of the key variables prohibits analysis at a country level. Therefore, the authors aggregate countries together for the empirical analyses, allowing for interpretations at a regional level only. All authors use country-level dummies to take into account cross-country heterogeneity.
The second issue is the conversion of fi nancial variables. The WBES follow the World Bank methodology that fi rst converts local currency vari- ables to US dollars using market exchange rates and then subsequently defl ates them to the reference year, 2009. An alternative methodology would be to use a measure of purchasing power parity (PPP) or the rate at which the currency of one country would have to be converted into that of another country to buy the same amount of goods and services in each country. Free of price and exchange rate distortions, the PPP methodology is often considered a better measure when making cross- country comparisons, especially for developing or emerging markets. 11 Despite these limitations, we follow the World Bank methodology, using market exchange rates for our analysis, for a number of reasons. First, to make accurate PPP comparisons, ideally, inputs and outputs need to be converted separately using different PPP converters; however, this was not feasible because of data limitations. Second, the greatest distortions between the two measures tend to occur when emerging country fi gures are converted into US dollars at market exchange rates and used for com- parisons with developed countries. The LAC WBES are all developing economies within the same region, so we expected the distortions to be smaller than those found between LAC and other developing or advanced economies. Last, as already mentioned, country fi xed effects are used in the regressions in all chapters to partly capture any persistent discrepancies between PPPs and exchange rates.
Another methodological issue is the decision about which measures of performance to use. Sales, employment, and productivity growth are just a few of the methods available to gauge fi rm performance. With the macroeconomic evidence of low productivity growth well established, this book uses fi rm-level productivity as the primary measurement of
fi rm performance. It relies on labor productivity, calculated as sales per employee, as a measure of fi rm effi ciency and performance. Where the data allows, authors also estimate the TFP. Both measures aim to proxy fi rm effi ciency in using production inputs, thereby providing a basis to compare performance across fi rms.
Finally, while the main dataset is the WBES, the authors also use additional data sources to create another level of analysis when possible.
Two relatively new micro-datasets are particularly interesting. Chapter 5 uses the IDB-fi nanced Survey of Productivity and Human Resources in Establishments (Encuesta sobre Productividad y Formación de Recursos Humanos en Establecimientos, or EPFE), which includes detailed ques- tions about on-the-job training that are not included in the WBES or other traditional business surveys. 12 For the Caribbean region, Chap. 7 uses the Productivity, Technology, and Innovation in the Caribbean (PROTEQin) Survey in tandem with the 2010 WBES. The PROTEQin expands the scope of WBES and incorporates more detailed questions related to labor, technology and innovation, commercial victimization, and productivity for 727 Caribbean fi rms. 13 Furthermore, Chap. 9 uses the new Organisation for Economic Co-operation and Development (OECD) and World Trade Organization (WTO) Trade in Value Added (TiVA) database.
O
VERVIEW OFTHE
B
OOKThe fi rst three chapters of this book focus on innovation dynamics in LAC fi rms. They are followed by chapters dealing with specifi c factors affect- ing enterprise performance, such as on-the-job training, performance of young fi rms, access to credit, and international linkages. Two of the eight chapters—Chaps. 3 and 7 —focus specifi cally on Caribbean economies, with new data sources for many of these small economies allowing for comparisons with larger mainland economies in Latin America.
I
NNOVATIOND
YNAMICSANDP
RODUCTIVITY: E
VIDENCE FORL
ATINA
MERICAChapter 2 , co-authored by Gustavo Crespi, Ezequiel Tacsir, and Fernando Vargas, focuses on the key relationships between innovation efforts, innovation outputs, and productivity. This chapter analyzes the links between fi rm characteristics and decisions about investments in inno- vation, between investment in innovation and innovative performance,
and between innovative performance and economic performance. It also examines the role of spillovers between fi rms. All the empirical analyses use a cross-sectional dataset for 17 countries in Latin America, constructed from the 2010 round of WBES.
In a review of the fi rm-level literature on innovation, the chapter fi nds that, in general, innovation leads to more effi cient use of resources and sustainable competitive advantage. Investment in research and develop- ment (R&D) tends to increase absorptive capacity, assimilation of knowl- edge, and catch up. Innovation and application of new ideas lead to the emergence of new sectors (structural change). In turn, changes in the production structure result in more complex chains of production, specialization, productivity growth, and a gradual expansion of more knowledge- intensive activities. At the macro-level, R&D, innovation, pro- ductivity growth, and per capita growth in GDP can reinforce each other in virtuous (or vicious) cycles.
The review also identifi es some important differences between the fi nd- ings of studies in Europe and studies in developing countries. First and fore- most, the productivity gaps between innovative and non-innovative fi rms are much larger in developing (70 %) than in advanced economies (20 %).
The productivity gaps highlight the shortcomings of ineffective innovation systems, where knowledge does not fl ow suffi ciently easily from actor to actor. But they also indicate substantial potential for improvement through public policy measures intended to promote investment in innovation by lagging fi rms as well as more effective knowledge fl ow and improved condi- tions for knowledge absorption. A second important difference is that the strong links between innovation investment and innovation performance and between innovation performance and economic performance found in Europe are more ambiguous in Latin America, where the results of differ- ent studies have been inconclusive. According to the authors, the hetero- geneity of fi ndings may have to do with the very different circumstances in developing countries and emerging economies. Many fi rms are far from the technological frontier, incentives to invest in innovation are absent or weak, and it may take longer for effects to materialize (which makes the relation- ships more diffi cult to measure in a cross-section framework). Also, many innovations consist of incremental changes based on imitation and technol- ogy transfer, with little impact on competitiveness in international markets.
The authors build on a model fi rst developed by Crépon et al. ( 1998 ), referred to as the Crépon–Duguet–Mairesse (CDM) model, that includes three steps. In the fi rst step, the analysis focuses on the decision to spend
on innovation. Next, an innovation function is estimated, relating subjec- tive indicators of product and process innovation to innovation expendi- tures and other explanatory variables. Finally, the analysis focuses on the key relationship between innovation performance and labor productivity.
This relationship is assessed in the context of a standard Cobb–Douglas production function with constant returns to scale, where innovation per- formance is added to capital and labor inputs, allowing the returns on innovation to be estimated.
In the various regression equations, fi ve groups of variables are distin- guished: (1) performance variables (e.g. labor productivity, employment, investment, and R&D); (2) innovation variables (e.g. product innovation, process innovation, innovative sales, and intellectual property rights); (3) fi rm capabilities (e.g. fi rm age, foreign ownership, human capital, knowl- edge stocks, and diversifi cation); (4) degree of access to external knowl- edge (e.g. cooperation with other fi rms, urban location, use of licenses, and broadband access); and (5) market conditions (e.g. degree of com- petition and whether or not a fi rm exports to international markets). The variables on market conditions relate to policy, which includes the per- centage of fi rms receiving public support for innovation activities by sector and country. Many of the variables described here are also used in subse- quent chapters of this book.
The following summarizes the most striking fi ndings in this chapter.
The decision to invest in innovation (R&D) is strongly correlated with fi rm size and fi rm capabilities and is signifi cantly and positively affected by public support. The intensity (amount) of investment is positively affected by fi rm capabilities (human capital and previous knowledge stock), access to external knowledge via licenses and connections, and public support.
Surprisingly, the intensity of competition has no effect on the decision to invest and there are even signifi cant negative effects of foreign control.
Multinationals do not seem to invest in technology development locally.
What is the effect of R&D investment on innovative performance? Here the answer is straightforward and positive. A 10 % increase in R&D spend- ing results in a 1.7 % increase in the probability of innovating. Most of the relationship between expenditure and innovation is through product innovation rather than process innovation. Some fi rm capabilities, such as size, diversifi cation, and fi xed investment, are important determinants of innovation outputs beyond their infl uence on R&D investment. Again there are some interesting results related to factors that negatively affect innovation. There are no signifi cant effects on the stock of knowledge,
but human capital is negatively correlated with innovative performance, and being a multinational has negative or non-signifi cant effects. The effect of human capital is puzzling. Perhaps fi rms do not really require highly skilled workers because the product innovations are not very com- plex. But this still begs the question as to why the effect is negative.
One of the chapter’s most powerful fi ndings is that the effects of innova- tion on productivity are positive and large. Total factor productivity of inno- vative fi rms is 50 % higher than that of non-innovative fi rms. In this respect, our research fi ndings differ from the ambiguous fi ndings for Latin America discussed in the literature review and the relationships are unambiguous.
The last two questions addressed in the chapter have to do with spill- overs and heterogeneity. The authors conclude that there are positive and signifi cant spillover relationships between R&D performed by other fi rms in the same sector and country, and a fi rm’s economic performance.
Unfortunately, a cross-sectional analysis does not provide enough infor- mation to discuss clearly the magnitude and importance of these spillover effects. In the fi nal part of the chapter, the authors present some very interesting and quite novel fi ndings about differences (heterogeneity) in the relationships between innovation performance and productivity across fi rms. On average, productivity increases when innovation occurs, shifting the whole productivity distribution to the right, but not equally. At the upper end of the productivity distribution, the increase in productivity is much higher than at the lower end.
The authors refl ect on the policy implications of this heterogeneity.
They argue that the lower returns on innovation in low-productivity fi rms suggest that the constraints on productivity improvement are not primar- ily fi nancial since these fi rms are indeed innovating. The authors believe the lower returns have to do with some fi rm characteristics, such as the lack of complementary assets or the lack of appropriability of innovation.
The importance of access to fi nance is discussed again in Chap. 8 .
I
NNOVATIVEA
CTIVITY INTHE
C
ARIBBEAN: D
RIVERS, B
ENEFITS,
ANDO
BSTACLESIn Chap. 3 , Preeya Mohan, Eric Strobl, and Patrick Watson examine the impact of innovation on fi rm productivity in the Caribbean, discuss- ing questions and models similar to those in Chap. 2 . So far, not much is known about fi rm performance in Caribbean countries and even less about their innovative behavior. This is mainly due to a lack of reliable
data for the region, which is usually lumped together with Latin America.
The availability of the 2010 WBES covering 14 Caribbean countries (and 2771 fi rms) for the fi rst time makes it possible to address these issues empirically. Along similar lines as Chap. 2 , the authors analyze the decision to invest in innovation, the impact of such investment on technological innovation (knowledge production), and the relationship between inno- vation and productivity. The few studies available for the Caribbean tend to use R&D expenditures as their measure of innovative activity and fi nd that both innovation and productivity are low. However, excessive empha- sis on R&D expenditures may underestimate the role of other forms of innovation that may be more important in small island developing states, where the cost of R&D is high and fi rms are too far from the technologi- cal frontier to have strong incentives to invest in R&D. This chapter uses a broader concept of innovation investment. In line with results obtained for many Latin American countries (Crespi and Zúñiga 2012 ; Chap. 2 of this book), innovative fi rms tend to be more productive than non-innova- tive fi rms; innovation matters for fi rm productivity performance.
The chapter starts with a descriptive analysis which reveals that in the manufacturing sector, the only one for which innovation data is available, innovative fi rms in the Caribbean tend to be medium-sized, domestic enterprises, half of which export a product. Moreover, there appear to be systematic differences in productivity between innovative and non- innovative fi rms (i.e. fi rms that do not spend any funds on R&D and/
or technological innovation activities). The results are robust to differ- ent non- and semi-parametric specifi cations of the estimates and to differ- ent measures of productivity (i.e. labor productivity and TFP). However, when analyzing the counterfactual—that is isolating the innovation behav- ior from other fi rm characteristics—the study suggests that differences in performance between the innovating and non-innovating fi rms are due more to underlying fi rm characteristics such as export status, foreign own- ership, patent possession, government support, and size than to being or not being innovative.
The authors search for causality in the relationship between innova- tive performance and productivity. Firm innovation involves any action that aims to increase the fi rm’s knowledge, including R&D expenditures, but also efforts to acquire external knowledge, such as expenditures on product design, marketing, staff training, new machinery, and patents and other trademark licensing.
The econometric estimates are run on a pooled dataset across coun- tries and follow the CDM three-stage approach described above and in Chap. 2 . The results show that fi rms that export and are larger are more likely to invest in innovation, while having patent protection or foreign ownership does not signifi cantly predict the decision to invest in innova- tion. The positive effect of size and export status on the decision to inno- vate is not surprising. The lack of signifi cance of the foreign ownership variable appears to signal that foreign fi rms develop their technologies abroad and only use Caribbean countries as an outlet for their products.
This is a frequent fi nding in studies of foreign direct investment (FDI) in developing countries.
Public fi nancial support is not a signifi cant predictor of the inten- sity of investing in innovation, suggesting that, in contrast to mainland Latin America, public funds do not effectively promote innovation in the Caribbean. Having patents or cooperating with other fi rms also do not appear to encourage investment, perhaps indicating limited inter-fi rm knowledge spillover. Other results for the Caribbean countries are simi- lar to those obtained for Latin America, but generally with larger effects.
Caribbean fi rms are more likely to introduce product or process inno- vation if they spend more on innovation: the probability of innovation increases by 56 % per unit increase in the log of innovation expenditure per employee.
The authors also estimate the causal impact of innovation on produc- tivity in an econometric framework. The results suggest that product and process innovation increase productivity in the Caribbean with an estimated elasticity that is larger than for Latin America. Small fi rm size appears to be less of an obstacle for innovation to improve productivity.
ICT, I
NNOVATION,
ANDP
RODUCTIVITY: E
VIDENCE FROMF
IRMS INL
ATINA
MERICANANDTHE
C
ARIBBEANIn Chap. 4 , Matteo Grazzi and Juan Jung single out ICTs as one of the important factors infl uencing fi rm performance. They analyze the deter- minants of broadband adoption in a large sample of LAC countries, and study their relationship with innovation and productivity.
Recently the economic literature has progressively recognized the role of ICTs as a key driver of economic growth. At the fi rm level, adopt- ing ICTs can infl uence performance in various ways, such as faster communication and information processing, easier internal coordination,
lower capital requirements, and better communication with suppliers and customers. However, in the absence of complementary investments in, for example, human capital or organizational improvements, simple diffusion of ICTs may not be suffi cient to fully exploit their benefi ts. This chapter adds to the still limited evidence regarding these relationships for develop- ing countries.
In the fi rst part of the chapter, the authors empirically test the validity of various models of ICT diffusion, both at the inter-fi rm and the intra- fi rm levels. The latter part of the analysis is original because the processes by which ICTs diffuse within organizations have been little studied. In particular, the authors test propositions from rank and epidemic models.
Rank models focus on the scores of fi rms on various characteristics, such as age, size, or human capital. Epidemic models predict that the greater the number of fi rms adopting broadband in a sector or a country, the greater the chance that a given fi rm will adopt broadband. The authors apply a probit model, and then a bivariate probit model, to control for multicol- linearity. The results are robust to all the specifi cations and consistent with previous analyses in the literature. Firm size appears to affect the probabil- ity of broadband adoption, while the quality of human capital (percentage of workers with at least a bachelor’s degree) and fi rm age affect adoption positively. These results hold for the entire sample, as well as separately for fi rms in the manufacturing and services sectors. Openness to foreign mar- kets through participation in foreign trade—but not foreign ownership—
increases the probability of broadband adoption.
The expected epidemic effects are confi rmed. In non-technical lan- guage, fi rms operating in countries and sectors with larger shares of fi rms using ICTs have a higher probability of adopting them. Moreover, fi rms located in urban agglomerations with more than one million inhabitants are also more likely to adopt broadband.
To tackle the important issue of factors affecting ICT diffusion from fi rm to fi rm and within a fi rm itself, the authors construct an indicator based on the availability of broadband in a fi rm and the number of activi- ties performed with it. The results show a similar pattern to those for inter- fi rm diffusion, with a signifi cant positive effect of fi rm size. It appears, however, that there is a threshold, above which size no longer matters for intra-fi rm diffusion of ICTs. This threshold turns out to be lower for manufacturing fi rms than for services fi rms. Location in an urban agglomeration positively infl uences the decision to adopt broadband by the fi rm, but not how extensively it is used within the fi rm.
In the second part of the chapter, the authors empirically examine the effects of ICT adoption on innovation performance and labor pro- ductivity. The analysis shows that the impact of ICTs on innovation may be conditioned by several characteristics internal to the fi rm as well as external, such as the linkages with strong external organizations and network externalities. The authors show that using broadband is posi- tively and signifi cantly correlated with the probability of product and process innovation in fi rms. However, when they single out the differ- ent possible uses that a fi rm can make of broadband, the results begin to differ. First, using the internet to perform research is positively and signifi cantly related to innovation, but no other uses are related to inno- vation. Second, the combined use of broadband for different activities matters and has a signifi cant impact on innovation on top of the effects of using the internet for research. This is to say that simple access to ICTs is not enough to foster fi rm innovation. Technology needs to be used adequately to exploit its full potential. In addition, other variables are associated with a higher probability of innovation, such as fi rm size, human capital, and openness to export markets. This latter result confi rms the evidence obtained in different contexts by Crespi et al.
(Chap. 2 ) and Montalbano et al. (Chap. 9 ).
Using a Cobb–Douglas production function, the authors show that using broadband also has a positive effect on labor productivity, and that this result is robust when controlling for endogeneity. When testing for the effect of the different kinds of internet uses, research loses its signifi - cance, perhaps due to the time lags between investments in broadband and the related research and the ensuing productivity effects. However, the simultaneous use of the internet for various activities and overall broadband adoption retain their positive infl uence on productivity. The lesson to be derived from this chapter is that ICT adoption and diffusion should receive special attention within the broader perspective of innova- tion and innovation policy.
O
N-
THE-J
OB-T
RAINING INL
ATINA
MERICA ANDTHE
C
ARIBBEAN: R
ECENTE
VIDENCEIn Chap. 5 , Carolina González-Velosa, David Rosas, and Roberto Flores focus on an important but neglected aspect of human capital forma- tion: on-the-job training. The secondary literature indicates that up to a quarter of human capital is obtained after formal schooling has ended
(Heckman et al. 1998 ). Also, the type of training provided on the job may be more relevant to the production process than the skills learned in formal education.
The chapter opens with a brief review of theories of on-the-job training.
Labor market theory assumes that, under perfect market conditions, the benefi ts of general training will accrue to the worker. As generalized train- ing increases the productivity of workers, they will be able to increase their wages or leave the fi rm to work elsewhere. Therefore fi rms have no incen- tive to fi nance generalized training. Firm-specifi c training may increase a worker’s productivity, but it does not increase the worker’s employability.
The benefi ts of productivity increases accrue to the fi rm, which thus has an incentive to invest in such training. The authors also provide a brief but useful overview of fi ve barriers to investment in on-the-job training.
The fi rst is the lack of appropriability: if the fi rm cannot capture the ben- efi ts of training, it will have no incentive to invest in on-the-job training.
The second is imperfect information about the advantages of training. The third is credit constraints. These three barriers affect the supply side. The last two barriers affect the demand side. If fi rms are facing limits to adopt- ing skill-intensive technologies or modern managerial practices, there may simply be no demand for skilled labor and accordingly little incentive to invest in on-the-job training.
The chapter draws on two different data sources. The fi rst is the WBES, which is the common source for all chapters of this book. The second is a Latin America-specifi c survey of human capital formation, the EPFE, which provides more detailed information about on-the-job train- ing in fi ve countries (the Bahamas, Colombia, Honduras, Panama, and Uruguay). The authors use a panel dataset of the WBES for 11 countries that participated in both the 2006 and 2010 waves of the survey for the regression analysis, though only for manufacturing.
Compared to other developing regions, fi rms in the 26 Latin American countries for which the authors have data offer quite a lot of on-the-job training, ranging from 26 % of the fi rms in Jamaica to 60 % in El Salvador (incidence of training). In the fi rms that offer training, the proportion of workers trained (intensity of training) is also quite high, ranging from 38 % in Uruguay to 79 % in Colombia. Skilled workers receive much more training than unskilled workers, so existing skill gaps tend to be amplifi ed. Training is specifi c and does not involve general socio-emotional or behavioral skills.
The employers pay most of the training-related costs and provide most of the training themselves. Governments provide some training
opportunities, but these are not used much, not even by small fi rms.
When fi rms turn to external providers, they choose private companies.
The authors speculate on the reasons for the unimportance of public fund- ing and provision, and argue that this could be due to lack of coverage in rolling out programs or irrelevance of their content.
However, there are clear differences between more innovative and less innovative fi rms: more innovative fi rms (i.e. higher R&D expenditures, improved processes, ISO certifi cates, and new products) often decide to train their workers. The surveys provide some interesting information about the reasons why many fi rms do not choose to train their work- ers. The main reason is that they do not see it as necessary. Skills are not perceived as a major constraint to operations. This is consistent with the theoretical argument that absence of innovative skill-intensive technolo- gies limits the demand for more training of skilled labor. Many fi rms fi nd their workers to be adequately trained. The policy implication is that it does not make much sense to subsidize on-the-job training in the absence of demand.
The fi nal section of the chapter provides estimates of the effects of on-the- job training on TFP. When country fi xed effects and control variables are added, the effects of training are not signifi cant in general.
However, in large fi rms (with more than 100 workers) there is a clear, signifi cant, and positive effect of training: a 1 % increase in the proportion of trained employees would raise productivity by 0.7 %.
The authors emphasize that the fi ndings of this study should be treated with caution. However, what comes out rather clearly is that many fi rms do not see training their employees as a high priority. Only when fi rms become more innovative does demand for training emerge. As Crespi et al. show in Chap. 2 , public policies have a signifi cant effect on fi rms’
investments in innovation. Thus, rather than subsidizing on-the-job train- ing directly, public policy should promote increased innovativeness of fi rms. Indirectly this would result in greater demand for skilled labor and on-the-job training.
B
USINESSP
ERFORMANCEINY
OUNGL
ATINA
MERICANF
IRMSIn the Schumpeterian literature, there are periods of economic devel- opment in which dynamic small fi rms are the agents of innovation and economic development. In other periods, referred to as Schumpeter II
regimes, mature incumbent fi rms are much more important. In Chap. 6 , Hugo Kantis, Juan Federico, Pablo Angelelli, and Sabrina Ibarra García discuss the performance and characteristics of small, young manufactur- ing fi rms in Latin America. While most of the literature on young fi rms focuses on startups, the authors examine the potential of young fi rms that have survived four years but are still younger than ten years. They study whether such young fi rms are a potential source of innovation, rejuvena- tion, and renewal of the economy. The analysis is based on a sample of 1074 young fi rms in 12 Latin American countries drawn from the WBES.
In the sample, almost 20 % of all fi rms are young (i.e. four to ten years old), and in several countries young fi rms have a larger presence in knowledge- based sectors than mature companies (e.g. technology services and engineering-intensive manufacturing). They contribute to diversifi ca- tion of regional industrial structures by embarking on new activities. The entrepreneurs have previous experience as employees, often in managerial positions in mature companies, and only 3 % of the entrepreneurs were previously unemployed. So there are few ‘necessity entrepreneurs’ in this category, although informal micro-enterprises are excluded from the sur- veys used in this book, and that is where survival entrepreneurship is gen- erally found. Half of the young fi rms employ between 10 and 49 workers.
They are mainly focused on domestic markets and only 16 % export. Quite a few fi rms performed R&D (43 %), a percentage similar to that for mature fi rms, and introduced new products or processes in the period analyzed.
In terms of their growth performance, whether measured as sales growth or employment growth, young fi rms are quite dynamic. Most start as micro-enterprises with no more than fi ve employees, but they can survive, grow, and develop into SMEs. Of course most startup failures occur in the fi rst four years, and the fi rms in the sample are those that survived the so- called ‘valley of death.’ Sales growth slows down in the last two years but is still fairly high. The authors conclude that three-quarters of the young fi rms tend to achieve sales growth, 40 % of them growing very rapidly at more than 20 % per annum. One interesting feature of the high-growth SME segment is their stronger specialization in knowledge-intensive sec- tors, such as engineering-intensive manufacturing or technology sectors (29 % of young fi rms and 21 % of mature fi rms), suggesting their role is propelling a structural transformation.
Though young fi rms tend to have dynamic growth performance, their average labor productivity in 2009 was more than 20 % lower than that of mature fi rms. However, young fi rms tended to catch up with mature
fi rms, especially in services, during the short period studied (2007–2009) and their relative productivity increased from 72.0 % in 2007 to 79.2 % in 2009. High-growth SMEs show the biggest increase in productivity levels, especially in the manufacturing sector where young, growing SMEs outperform mature fi rms.
In the last section of the chapter, the authors analyze the determinants of sales growth, employment growth, productivity levels, productivity growth, and profi tability using Ordinary Least Square regressions. The econometric analysis is restricted to manufacturing fi rms. The results are inconclusive, but some interesting fi ndings stand out. There appears to be a positive and statistically signifi cant relationship between the high-growth status of young manufacturing fi rms and their productivity levels, on aver- age 32 % higher.
Regulatory obstacles (e.g. tax rates, labor regulations, licenses, and permits) have a signifi cant negative effect on sales growth. Financial con- straints (lack of access to fi nance) have a negative impact on both employ- ment growth and levels of productivity. Technical assistance (use of external technical services) has a signifi cant and positive effect on sales growth and, with workforce training, on productivity levels. Though young fi rms are not less innovative than mature fi rms, the positive effects of innovation on productivity performance discussed in Chap. 2 do not seem to hold for young fi rms.
The general conclusion from this chapter is that, even though we do not know much about the determinants of performance for young fi rms, they are dynamic compared to mature fi rms, and therefore deserve special attention from researchers and policymakers. Their contribution to mac- roeconomic development should be studied in more detail.
D
IFFERENTO
BSTACLESFORD
IFFERENTP
RODUCTIVITYL
EVELS? A
NA
NALYSISOFC
ARIBBEANF
IRMSIn Chap. 7 , Alison Cathles and Siobhan Pangerl examine the implications of small country size in the island economies of the Caribbean. The chap- ter uses new fi rm-level data from the WBES and the PROTEQin Survey to better understand Caribbean fi rm dynamics and the differences among Caribbean countries.
The fi rms in the region tend to be micro or small, concentrated in the services sector, mature, and non-exporters. Comparing fi rms in dif- ferent Caribbean countries, various differences emerge: smaller countries
typically have a higher percentage of micro and small fi rms, the concentra- tion in the services sector varies from 50 to 84 %, and there are consider- able differences in ICT penetration rates.
Then, the authors deepen the analysis and discuss the characteristics of human capital in Caribbean fi rms from two perspectives: entrepreneurs and workforce. Considering both fi rm owners and managers to be entre- preneurs, the authors fi nd that previous experience varies widely through- out the region. In general, entrepreneurs tend to have previously been employed (either in managerial or non-managerial positions), but in some countries there is a signifi cant percentage that transitioned directly from unemployment to being a top manager. This fi nding is consistent with the high percentage of fi rms in those countries that report that the busi- ness was started because of a lack of better employment opportunities.
Moreover, the authors show that few Caribbean fi rms are created to intro- duce a new idea or product into the market. Rather they tend to replicate, imitate, or differentiate products or services that already exist. Thus, the capacity of a fi rm to absorb external technology and knowledge is key to good performance. But this capacity is strictly related to the availability of a suffi ciently skilled workforce, a major concern in the region. In fact, over 35 % of Caribbean fi rms report having unfi lled vacancies, and the lack of an adequately educated workforce is one of the obstacles to fi rm operations most frequently mentioned in the surveys.
The next section of the chapter focuses on productivity. Larger, older, exporting, ICT-using, and foreign-owned fi rms are found to be more productive in the manufacturing and services sectors. As regards human capital, fi rms with more experienced managers on average show higher productivity, as do fi rms with a higher proportion of employees with at least a bachelor’s degree.
Finally, the authors investigate the perception of Caribbean enterprises with respect to the main obstacles affecting their operations. In addition to scarcity of adequately educated workers, diffi culties in getting access to fi nance, ineffi cient electricity, and high tax rates are consistently cited as the most relevant obstacles. Nevertheless, when the fi rms are classifi ed by their productivity levels, by dividing the sample into labor productivity quintiles, it is clear that the perception about most relevant obstacles can change, possibly because more productive fi rms have different needs.
The descriptive analysis is complemented by an econometric estimation of the determinants of fi rm productivity in the region. Using quantile regression techniques, the authors differentiate the effect of various fi rm