INTRODUCTION AND STATEMENT OF THE PROBLEM
AIM OF THE STUDY
The purpose of this research was to find answers to the above-mentioned questions, to determine the influence of some variables on academic success and academic self-efficacy beliefs of disadvantaged gifted students. The investigator felt that finding answers to the above-mentioned questions was essential to contribute to a good understanding.
RESEARCH HyPOTHESES
METHOD OF RESEARCH
Review of the literature
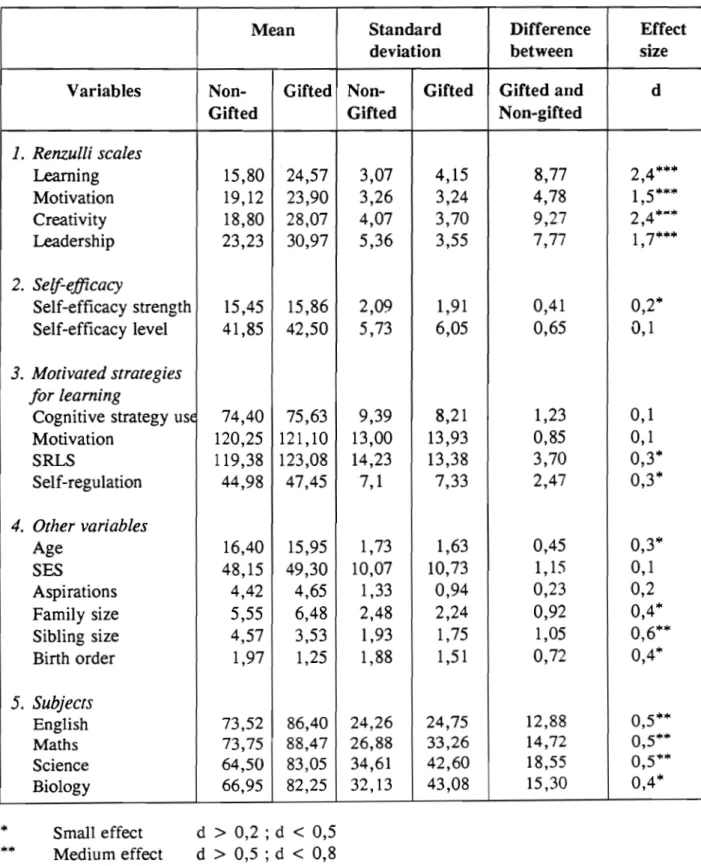
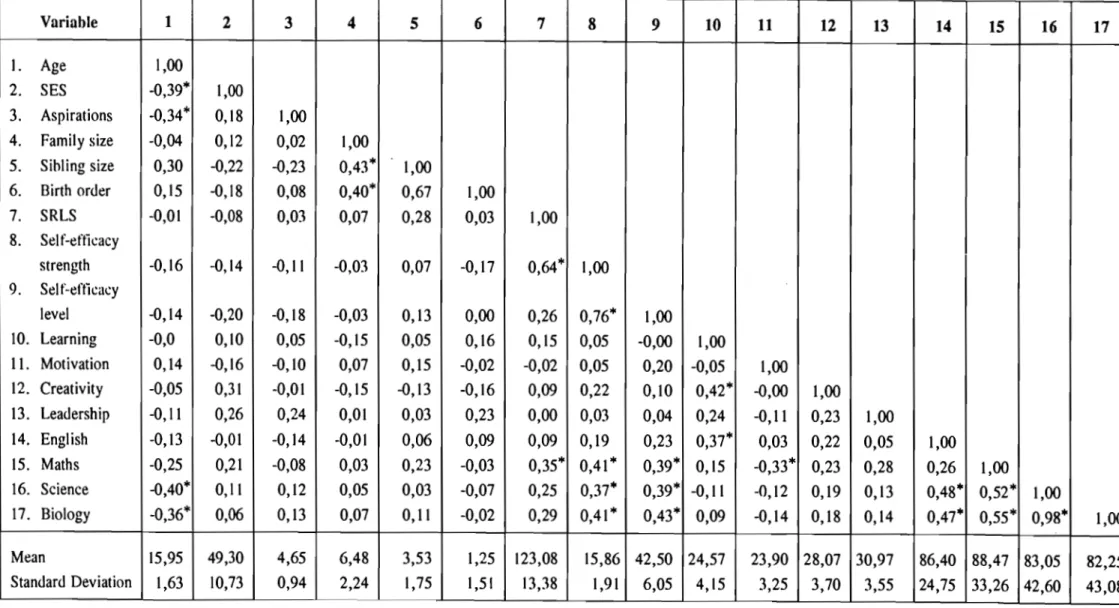
There is a relationship between certain variables and the self-efficacy beliefs of disadvantaged gifted students. There is a statistically significant relationship between the self-efficacy strength of the disadvantaged gifted students and their self-efficacy level (r=0.76; p < 0.05).
Empirical study
ORGANIZATION OF THE STUDy
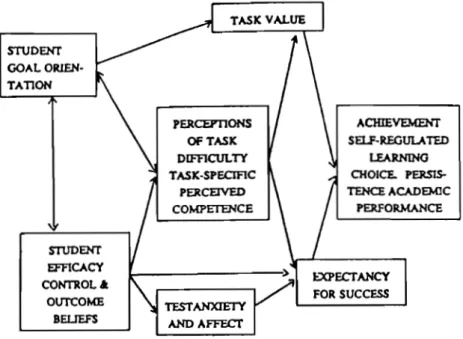
The influence of self-efficacy on task choice
The influence of self-efficacy on persistence and effort
The influence of self-efficacy on choice of learning
According to Schunk (in press), self-efficacy is one of the personal processes involved in the learner's self-responses. Students with low self-efficacy put in less effort and can no longer persevere when faced with difficulties.
INTRODUCTION
DEFINITIONS OF GIFTEDNESS
The single-trait view of giftedness
There is also a statistically significant relationship between the self-regulated learning strategies of the disadvantaged non-gifted students and their. Certain variables influence the academic performance of disadvantaged gifted students and disadvantaged non-gifted students.
The multi-trait view of giftedness
CHARACTERISTICS OF GIFTED STUDENTS
Ability to learn quickly: Gifted students learn very quickly, more especially when they are interested in a topic or subject (parke, 1989:20). Leadership abilities: Gifted students are more reliable, have healthy social attitudes and are more emotionally stable (Wall ace.
IDENTIFICATION OF GIFTED STUDENTS
- Educational and psychological testing
- Identification by teachers
- Identification by parents
- Identification by peers
- Self-identification
Achievement tests are also used to identify gifted students and are specifically designed to detect academic giftedness (Davis & Rimm, 1989:76). In South Africa, tests that can be used to identify gifted students include group intelligence tests and individual intelligence tests (Kokot, 1992:57).
CHARACTERISTICS OF DISADV ANT AGED GIFTED
There is a difference between disadvantaged gifted students and disadvantaged non-gifted students on some variables. There is a statistically significant relationship between the level of self-efficacy of disadvantaged gifted students and their achievement in mathematics (r=0.39; This confirms that self-efficacy beliefs of disadvantaged gifted students influence their choice of tasks (see par. .
However, there is no statistically significant relationship between the self-regulated learning strategies of disadvantaged gifted students and their self-efficacy level. This means that there is a relationship between self-regulated learning strategies and the self-efficacy beliefs of disadvantaged gifted students. There is a relationship between certain variables and the academic performance of underprivileged gifted students and underprivileged non-gifted students.
PROBLEMS WITH THE IDENTIFICATION OF
Mediocre performance
Test bias
Achievement and intelligence tests tend to favor the same culture in which they were developed, which is usually the dominant culture (eg whites in South Africa) with which the disadvantaged are unfamiliar (Ehrlich, 1987:61). Disadvantaged gifted students grow up in conditions that are intellectually unstimulating to the extent that their potential is usually underdeveloped.
Identification by teachers
For example, a disadvantaged gifted child will not perform as well as he should on tests of verbal ability because of his impoverished home environment that is not linguistically stimulating in terms of the language in which the tests are written, such as English (Davis & Rimm, 1989: 284).
Bilingualism
The North West Province of South Africa, where English is used as the medium of instruction from Standard 3, while many black children, especially those from parents of low socio-economic status, do not know English. Identification tests constructed in the second language of the disadvantaged students do not allow them to perform as well as they should in these tests and, as a result, they cannot be identified as gifted (Van den Berg, 1989:93 ).
CONCLUSION
The chapter concluded with a discussion of the problems experienced with identifying disadvantaged gifted students. As Henegar says, the methods used to identify gifted students put disadvantaged gifted students at a disadvantage because their language, cultural and home background are not taken into account when interpreting the results.
INTRODUCTION
AIM OF THE RESEARCH
No statistically significant correlations were found between the self-efficacy level of the disadvantaged non-gifted students and their performance in mathematics, science and biology. There is a statistically significant correlation between the disadvantaged gifted students' performance in science and their performance in biology (r=0.98; p < 0.05). There is also a statistically significant correlation between the disadvantaged non-gifted students' performance in science and their performance in biology (r=0.97; p < 0.05).
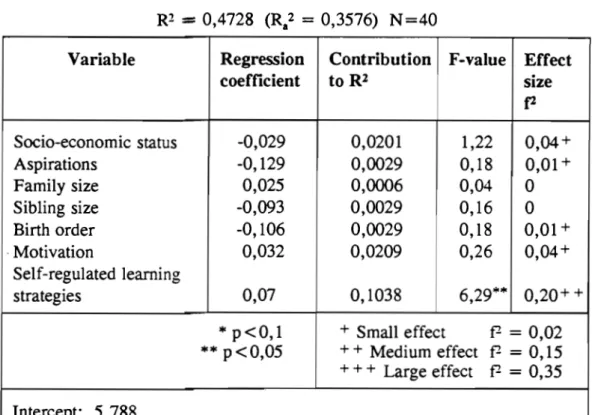
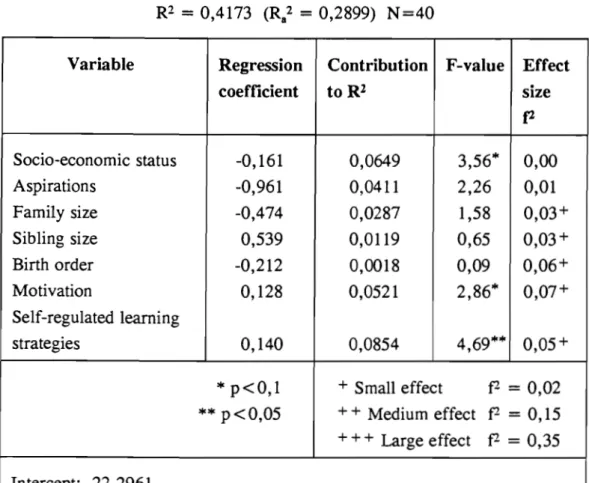
To determine the influence of the independent variables on the self-efficacy strength of the disadvantaged gifted students and the disadvantaged non-gifted students, an analysis of variance was conducted. Relative to the disadvantaged non-gifted students, the contribution to R2 of only three of the independent variables is statistically significant. Disadvantaged gifted students and disadvantaged non-gifted students differ on certain variables.
EXPERIMENTAL DESIGN
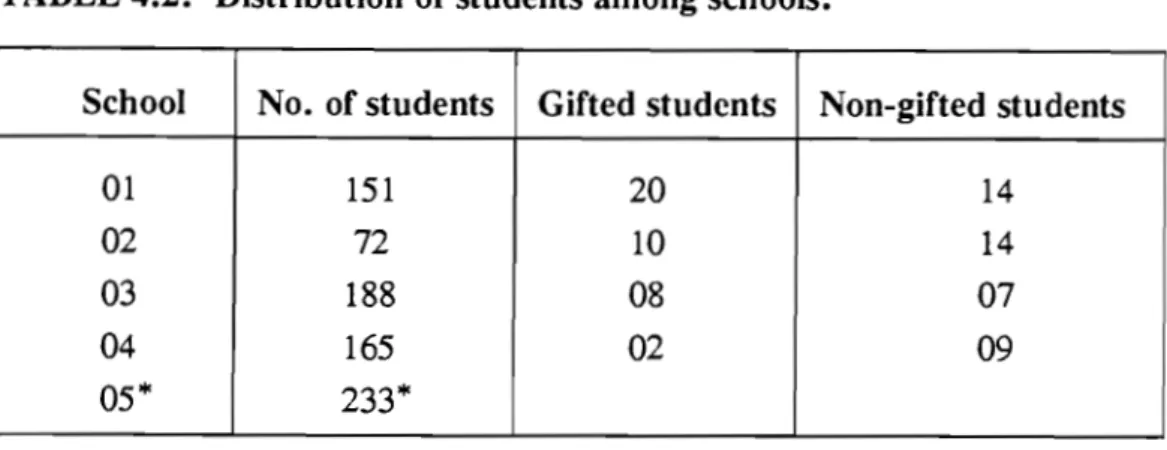
STUDY POPULATION AND IDENTIFICATION OF GIFTED
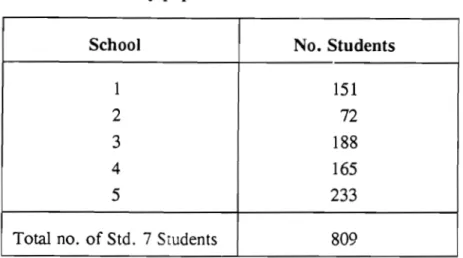
Study population
In the disadvantaged non-gifted students, the contribution to R2 of only three of the independent variables is of statistical significance, i.e. in the disadvantaged non-gifted students, the contribution to R2 of only two of the independent variables is of statistical significance. .
Identification of disadvantaged gifted students and disadvantaged
INSTRUMENTATION
- Scales for Rating Behavioural Characteristics of Superior Students
- Self-Efficacy Questionnaire (SEQ)
- Motivated Strategies for Learning Questionnaire (MSLQ)
- Socio-Economic Status and Biographical Questionnaire
Teachers were asked to rate students on a four-point scale value for each descriptor in each of the four categories. Because some subjects in the sample had language deficits, precautions were taken to ensure that they understood the instructions by including two sample passages and explaining difficult words from the passages, questions, and answers.
VARIABLES USED IN THE STUDY
Independent Variables
The academic achievement section asked students to list the grades they achieved in English, maths, science and biology in mid-term exams. The evaluation sheet for the mid-term exams was obtained by each school, and the evaluations for each student in the sample were entered by the researcher himself.
Dependent Variables
PROCEDURE
Identification of subjects
Administration of the tests
- Self-Efficacy Questionnaire (SEQ)
- Motivated Strategies for Learning Questionnaire (MSLQ)
- Socio-Economic Status and Biographical Questionnaire
The average time it took the subjects from all four high schools to complete the first part of this questionnaire was forty-five minutes. The average time it took students from all four secondary schools to complete part two of the questionnaire was 65 minutes, after which they had a 30-minute break.
STATISTICAL TECHNIQUES
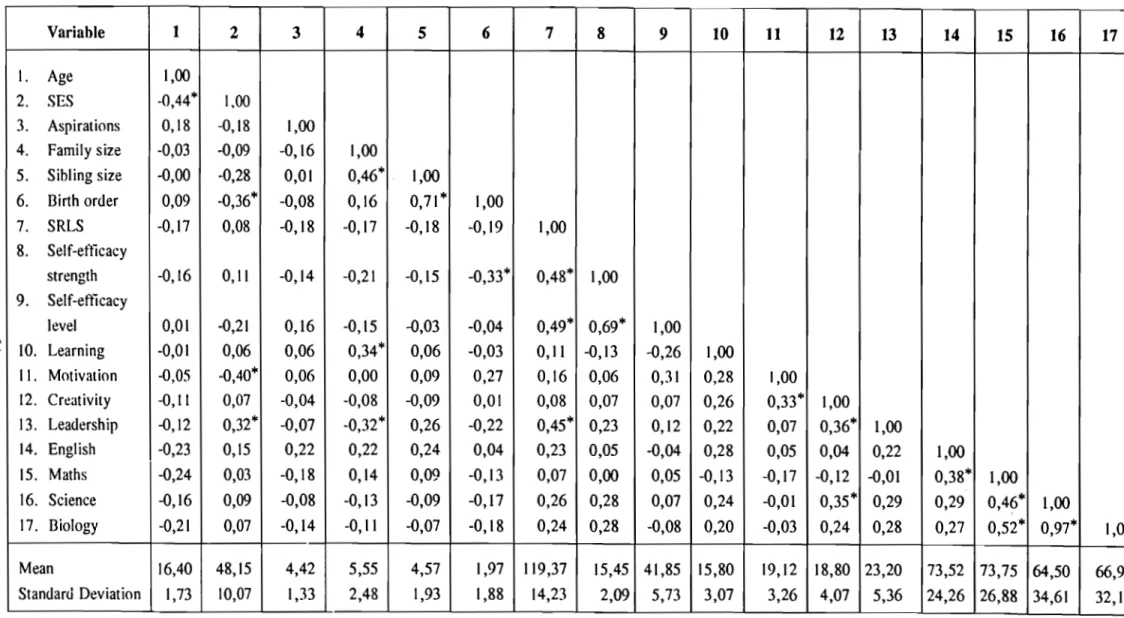
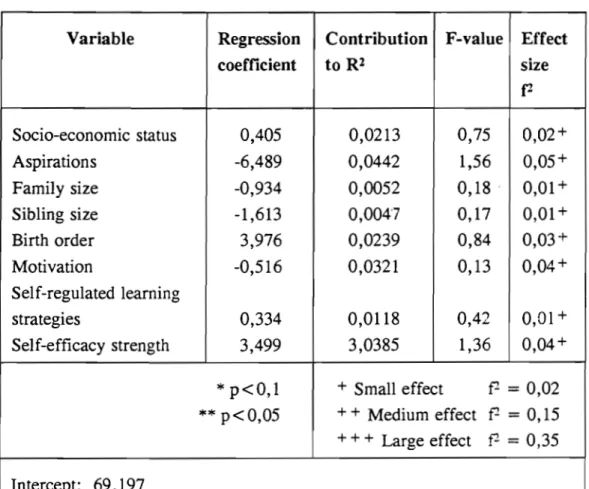
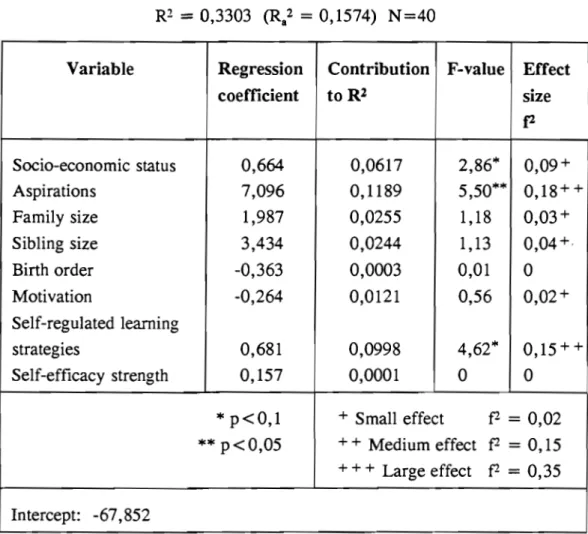
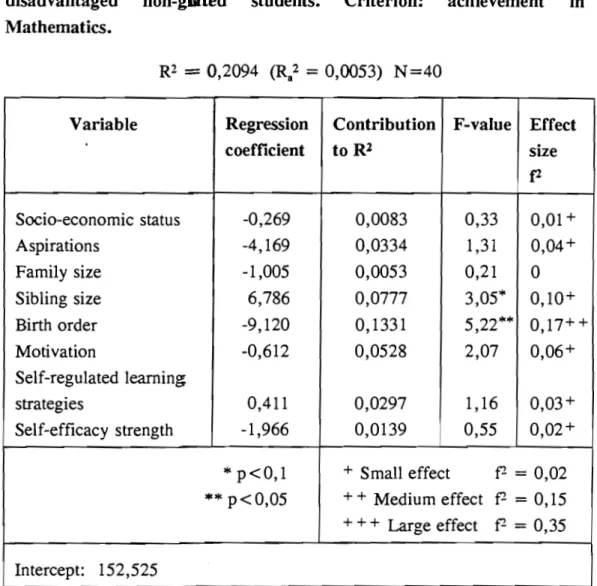
There is a relationship between some variables and academic success of disadvantaged gifted students and disadvantaged non-talented students. Analysis of Tables 5.4 and 5.5 shows that the independent variables together explain 11.9 percent (R2=0.1198) of the variance in the English achievement of disadvantaged gifted students compared to 33 percent (R2=0.3303) of disadvantaged non-gifted students. Analysis of Tables 5.6 and 5.7 shows that the Czbirno independent variables explain 37.6 percent (R2=0.3767) of the variance in mathematics achievement of disadvantaged gifted students compared to 20.9 percent (R2=0.2094). ) disadvantaged untalented students.
With regard to the underprivileged gifted students, the contribution to R2 of only three of the independent variables is of statistical significance. An analysis of Tables 5.8 and 5.9 indicates that the independent variables collectively explain 22.5 percent (R2=0.2254) of the variance in the science performance of the disadvantaged gifted students, compared to 16.3 percent (R2=0, 1639) of the underprivileged non-gifted students. This means that there is a relationship between the use of cognitive strategies and the academic self-efficacy beliefs of underprivileged gifted students and underprivileged non-gifted students.
CONCLUSION
INTRODUCTION
As stated in paragraph 1.2, the aim of this study was to determine the influence of certain variables on academic self-efficacy beliefs and academic achievement of disadvantaged gifted students. To get a clear picture of how certain variables influence the academic achievement and self-efficacy beliefs of disadvantaged gifted students, we compared a group of disadvantaged gifted students to a group of disadvantaged non-gifted students on a number of variables.
HYPOTHESES
CATEGORIZATION OF THE VARIABLES USED IN THE
A COMPARISON BETWEEN DISADVANTAGED GIFTED
The differences in self-efficacy strength (difference 0.41; d=0.2) and self-efficacy level (difference 0.65; d=0.1) between the underprivileged gifted students and the underprivileged non-gifted students are not only small but also of little educational significance. Therefore, compared to the disadvantaged non-gifted students, underprivileged gifted students are not characterized by superior self-efficacy.
THE INFLUENCE OF THE INDEPENDENT VARIABLES
- Correlation coefficients with relation to academic achievement
- The influence of the independent variables on achievement
- The influence of the independent variables on achievement
- The influence of the independent variables on achievement
- Variables that make a statistical and educational significant
With respect to non-gifted disadvantaged students, the contributions of the independent variables to science achievement are not of statistical significance and are also of little educational significance due to small effect sizes. An analysis of Tables 5.10 and 5.11 shows that the independent variables together explain 27.8 percent (R2=0.2784) of the variance in the Biology achievement of gifted disadvantaged students compared to 18.9 percent (R2=0, 1892 ) of disadvantaged non-talented students.
THE INFLUENCE OF THE INDEPENDENT VARIABLES
Correlation coefficients with relation to self-efficacy beliefs
Strength of self-efficacy is an important variable influencing the achievement of gifted students in mathematics, science, and biology. No statistically significant correlations were found between the level of self-efficacy of disadvantaged non-talented students and their achievements in mathematics, science and biology and other variables.
The influence of the independent variables on self-efficacy
It can therefore be concluded that self-regulated learning strategies are an important variable affecting the self-efficacy of disadvantaged gifted students. It can therefore be concluded that the ability to use self-regulated learning strategies is an important variable influencing the self-efficacy beliefs of disadvantaged gifted students.
The influence of the independent variables on the self-efficacy
We can therefore conclude that the same set of variables has a different effect on the level of self-efficacy of disadvantaged gifted students and disadvantaged non-talented students. Self-regulated learning strategies and the use of cognitive strategies were found to be the most important variables influencing the self-efficacy beliefs of disadvantaged gifted students.
INTRODUCTION
STATEMENT OF THE PROBLEM
REVIEW OF THE LITERATURE
Sources of self-efficacy
The influence of self-efficacy on learning
Gifted students and disadvantageness
The identification of gifted students and non-gifted students was carried out with the help of the Scales for assessing the behavioral characteristics of excellent students (SRBCSS) (section 4.4.2). When writing a test, I can focus more than half the time on answering the questions. I can effectively write down important facts that are mostly explained by the teacher.
I can make summaries of the main ideas of the work I have to prepare for a test.