The study focuses on energy conservation through the adaptation of BYOD as a green IT practice in higher education. The study revealed that the employees of this institution are willing to adopt BYOD in accordance with the energy saving aspect of Green IT practice.
- INTRODUCTION
- BACKGROUND OF THE STUDY
- PROBLEM STATEMENT
- RESEARCH QUESTIONS
- Main research question
- Minor research questions
- RESEARCH AIM AND OBJECTIVES
- Aim
- Objectives
- BRIEF LITERATURE REVIEW
- Introduction
- Definition of BYOD
- Importance of BYOD
- Energy consumption
- Promoting energy conservation
- RESEARCH METHODOLOGY AND DESIGN
- Quantitative approach
- Survey method
- Data collection techniques
- Population and sampling
- Data analysis
- ETHICAL CONSIDERATIONS
- PRELIMINARY CHAPTER DIVISION
- CHAPTER SUMMARY
In addition, a green IT solution helps organizations to reduce the environmental impact of the organization's IT operations. From the results of the analysis, conclusions of the study are drawn based on the conceptual framework and research objectives of this study.
INTRODUCTION
BYOD, GREEN IT AND ENERGY CONSERVATION
- Green IT
- The necessity of green IT in Higher Education Institutions
- Environmental Concern
- BYOD
- The explosive growth of BYOD
- Awareness of BYOD with regards to green IT
- Advantages of integrating BYOD in a work environment
- Organizational support
- Energy conservation
- Promoting energy conservation
- Energy consumption and importance of BYOD
Power management and energy efficiency are the primary goals of Green IT (Mittal & Kaur, 2013). One of the best Green IT practices involves reducing energy consumption (Nandakumar & . Dhenakaran, 2013).
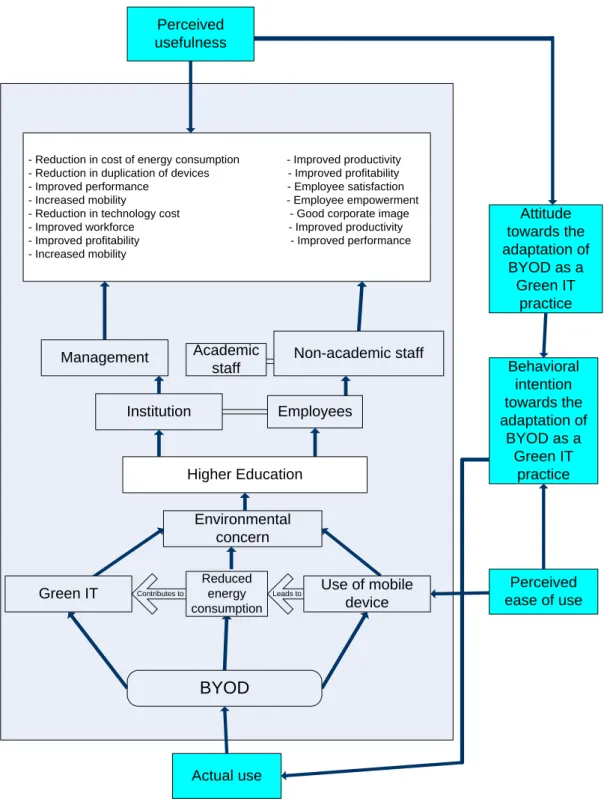
CONCEPTUAL FRAMEWORK OF THE STUDY
- Perceived ease of use and perceived usefulness
- Perceived behavioural control
- Attitude and behavioural intention
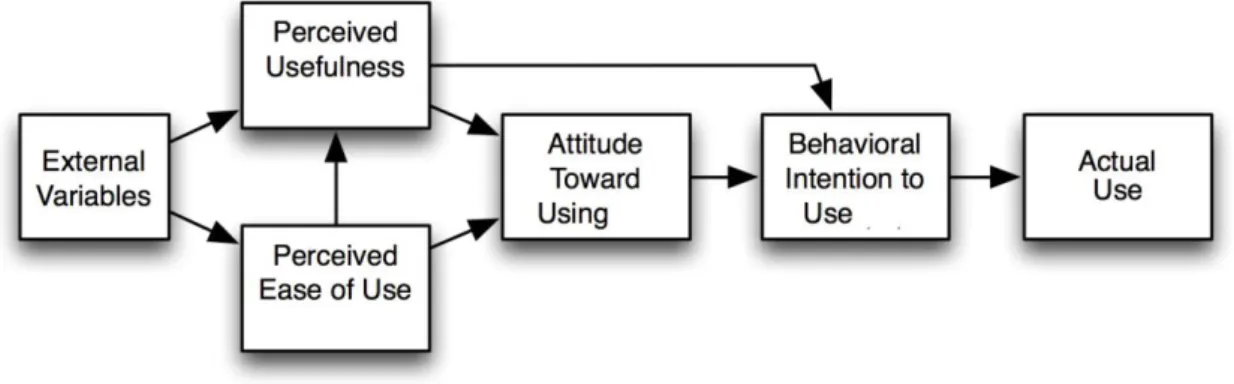
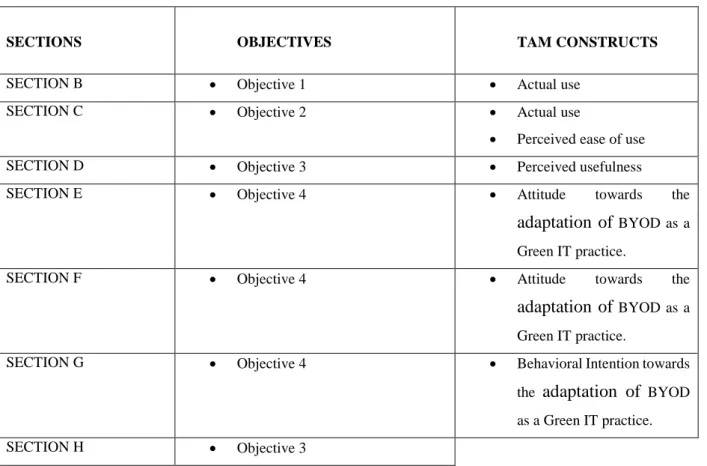
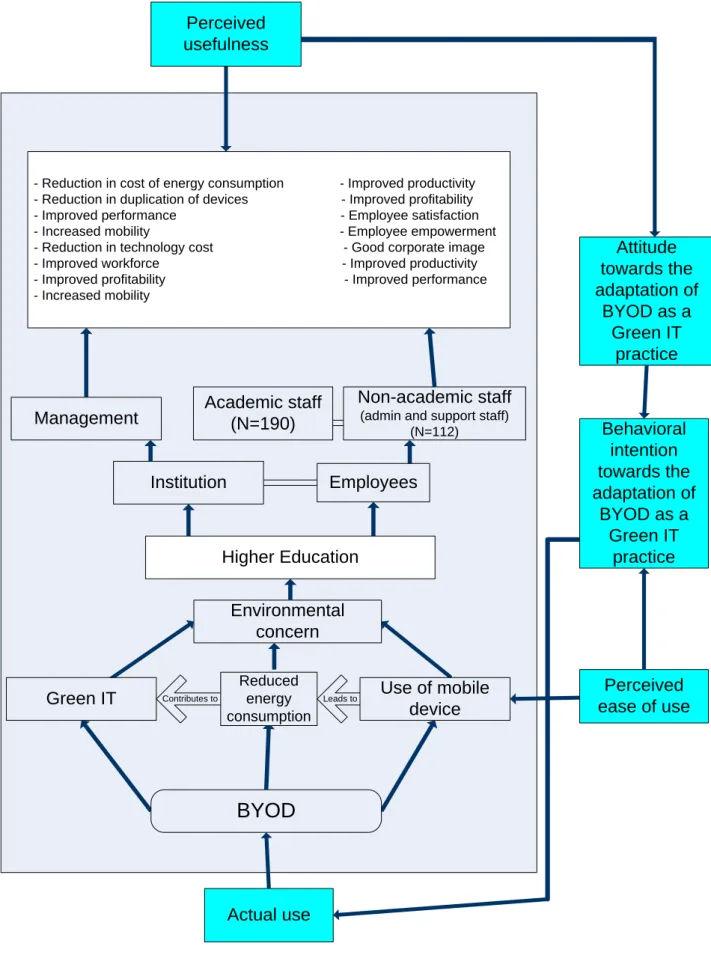
- Application of TAM to the study
The actual use of a technology system by an individual is determined by the individual's behavioral intentions, attitude, perceived usefulness of the system, and perceived ease of the system. TAM also posited that external factors, based on mediated effects on perceived usefulness and perceived ease of use, can influence the intention and actual use of the technology system (Park, 2009). According to Bhattacherjee (2001), to determine an individual's intention to adopt a technology, perceived usefulness is one of the appropriate constructs.
Furthermore, Melville (2010) asserts that TAM asserts that IS adoption and use depends on the perceived ease of use of the system and perceived usefulness, especially in terms of increasing individual productivity. It focuses mainly on the control, by the individual, of the functioning of the technology (Brier, 2004) which can bring about a positive or negative outcome (Taylor & Todd, 1995). Applying BYOD with green IT in HEIs helps realize most of the sustainability goals of a green-conscious institution and achieve many other advantages.
When realizing sustainability goals with BYOD, it is important to ensure proper awareness or knowledge of the concept among the employees of the institution.
THE LITERATURE GAP AND REASON FOR ENGAGING IN THE STUDY
Var (2013) indicated that work devices are being left in the dust as employees continuously personalize their home devices as BYOD allows employees to make their own decisions regarding the way they do their jobs.
CHAPTER SUMMARY
INTRODUCTION
RESEARCH PROCESS
RESEARCH DEFINITION
RESEARCH METHODOLOGY
- The philosophical background
- Ontology
- Epistemology
- Axiology
- Research Paradigms
- Justification for using paradigm
- Interpretivism
- Critical realism
- Choice of research paradigm for this study
- Positivism
- Characteristics of positivism
- Benefits of positivism
- Research approach
- Qualitative approach
- Choice of research approach
- Quantitative approach
Being clear about the ontological stance of the study by the researcher influenced the quality and characteristics of the techniques, data, analysis and findings generated. Based on the ontology of the study, the epistemological assumption of the researcher is that the acquisition of knowledge regarding the purpose of the study would be an objective process, and one that is measurable. Based on the researcher's assumption and in accordance with the view of O'Gorman and Macintosh (2015), it can be concluded that this study best fits the positivist epistemological perspective and this is the epistemological choice of the researcher in this study.
The researcher ensured that he remained independent of the data and maintained an objective point of view. The researcher made the general decision about choosing the appropriate approach for this study. The researcher is of the opinion that the paradigm and the chosen methodology will help to obtain a suitable solution to the problem of this study.
Researchers were convinced that there is a large amount of facts in the world to be obtained through objective quantitative measures (Blanche et al., 2006).
RESEARCH DESIGN
- Survey method
- Characteristics and justification for using survey
- The population and sampling for this study
- Limitations of sampling
- Data collection
- Data collection procedure
- Data collection method
- Justification for using questionnaire
- Data analysis
- Data analysis methods
Fowler (2008) emphasized that this entire procedure is aimed at generalizing from the sample to the population of the study. This study required a design that would be better suited to describing the characteristics of the population studied with respect to the topic of the study. On the other hand, most quantitative researchers use the sampling method, which involves studying a portion of the population known as sample (Sarantakos, 2005).
After the pilot study, the researcher continued to personally distribute the questionnaires to the employees of the HEI. Section A focused on demographic information of the respondents to help the researcher establish the independent variables for the study. The analysis of the obtained numerical data in a study can be done quantitatively through descriptive and inferential statistics (Bhattacherjee, 2012).
It is also important to understand that descriptive statistics can only be used to provide a description of the population or set of data being examined (Crossman, 2016).
CHAPTER SUMMARY
INTRODUCTION
RESPONSE RATES
DESCRIPTIVE STATISTICS AND FREQUENCIES ON THE RESEARCH
- Presentation and interpretation of findings
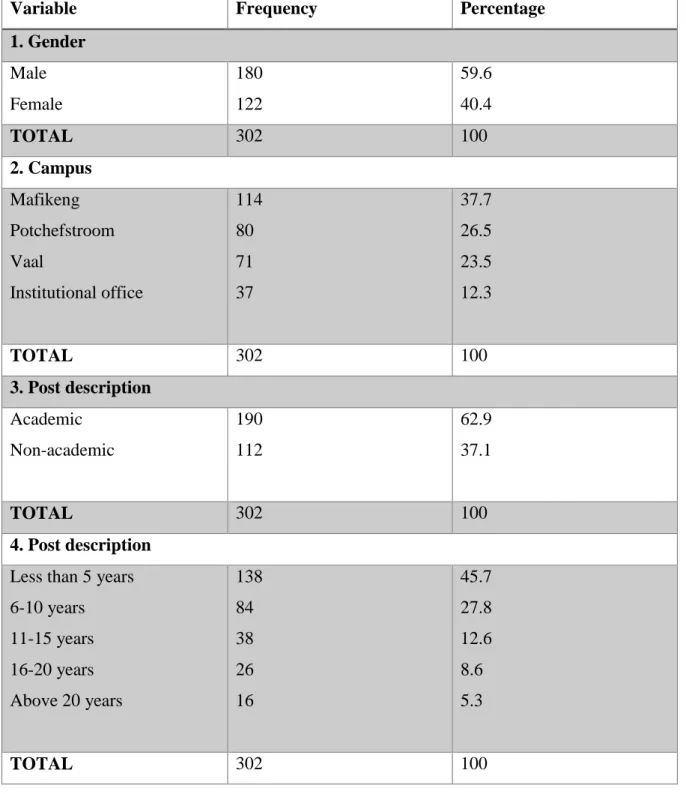
- SECTION A: Demographic information
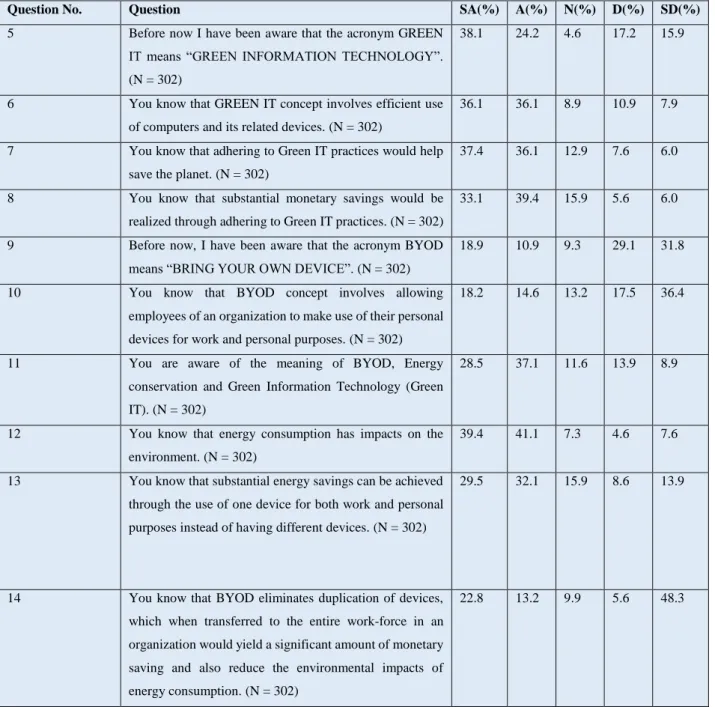
- SECTION B: Knowledge of BYOD with regards to Green IT
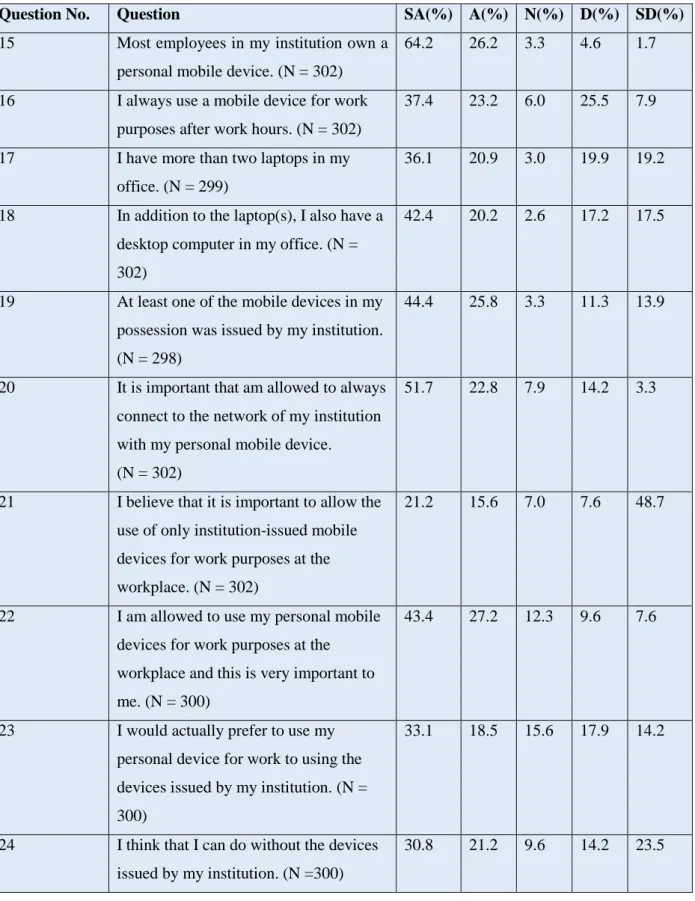
- SECTION C: The necessity of using personally-owned devices and institution-
- SECTION D: Perceived behavioural control
- SECTION E: Environmental Concern
- SECTION F: Attitude towards the adaptation of BYOD as a Green IT Practice 79
- SECTION G: Intention towards the Adaptation of BYOD as a Green IT practice
- SECTION H: Organisational support
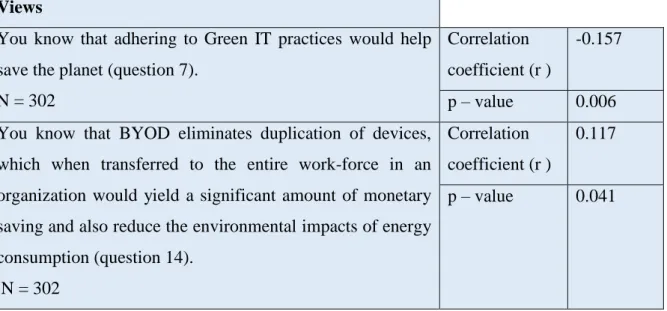
- TESTING FOR SIGNIFICANT CORRELATIONS BETWEEN VARIABLES
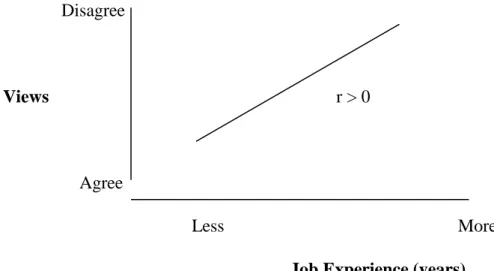
- Test for significance between job experience (question 4) and the general views of
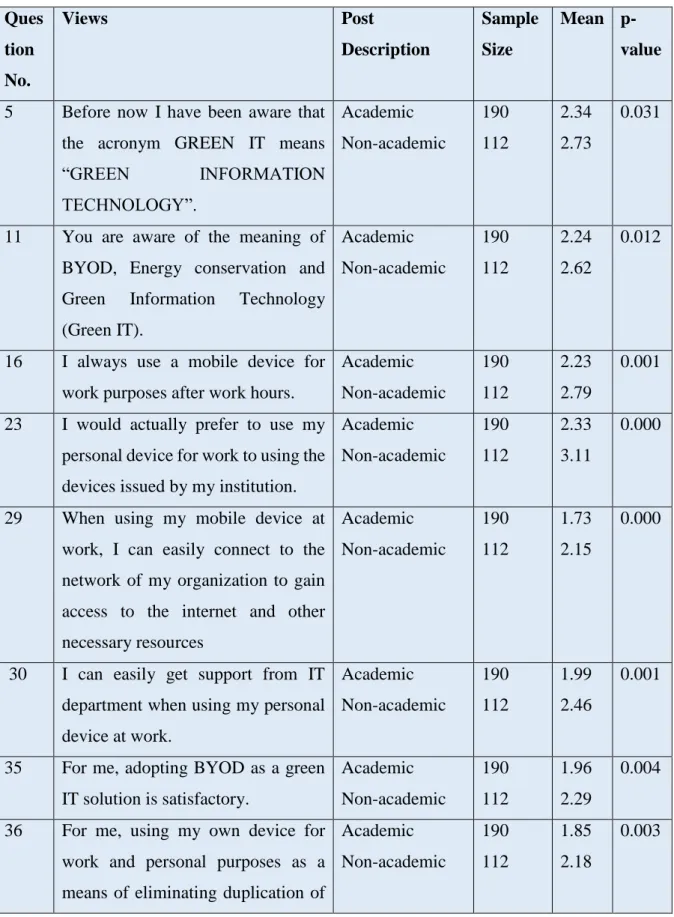
- Using T – Test between two Independent Samples
This means that most of the respondents believe that most of them. This is evident in the question (no. 24 in Table 4.3) where 30.8 percent and 21.2 percent of respondents have selected SA and A respectively. In question (no. 21 in Table 4.3), the majority of respondents did not favor the use of devices only issued by the institution for work purposes.
Based on the results of the analysis in Table 4.6, most of the respondents admitted that the acceptance of BYOD as a green IT solution is satisfactory. This was revealed in their response to the question (No. 39 in Table 4.6) where 50.3 percent and 38.4 percent of the respondents respectively chose SA and A. The scale abbreviations were used in Table 4.7 shows the frequencies and mean response of the respondents ( of employees) in percentage about their intention to adapt BYOD as a green IT solution or practice.
This is evident from question (no. 44 in Table 4.8), where 46.68 percent and 41.38 percent of respondents selected SA and A respectively.
CHAPTER SUMMARY
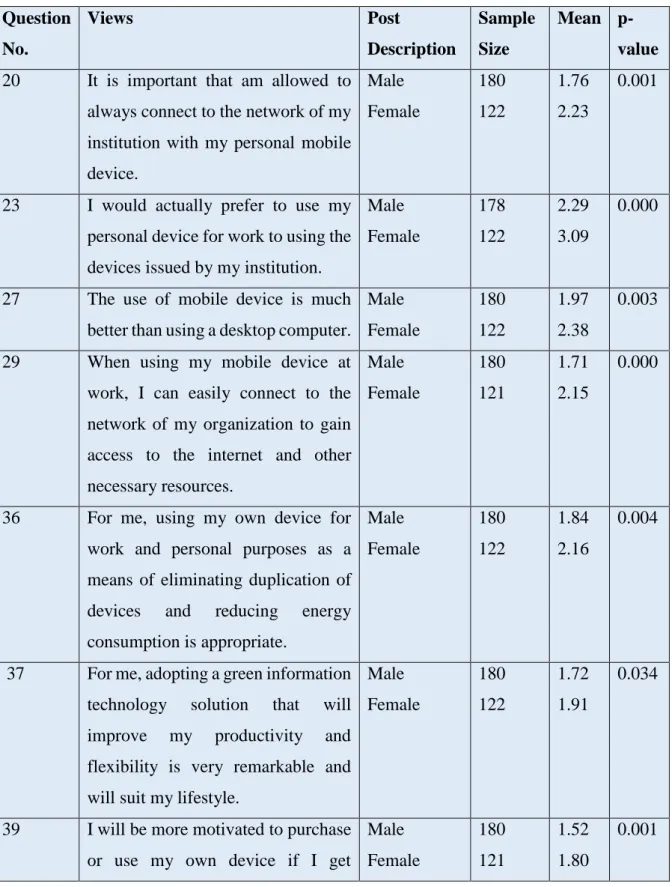
47 I am very confident that my institution is comfortable with the use of any mobile device in the workplace. SPSS 23 was used to perform a t-test between two independent samples (male and female respondents) in Table 4.11. Since the p-values are less than the 0.05 significance level, this means that there are significant differences of opinion regarding the adaptation of BYOD as a green IT practice.
The average score for the male respondents is lower than for the female respondents. This indicates that male respondents tend to strongly agree with the questions in Table 4.11, whereas female respondents tend to slightly agree.
INTRODUCTION
CONCLUSIONS
- The contribution of the study
- Conclusions based on the conceptual framework of the study
- Perceived usefulness
- Perceived ease of use
- Attitude towards the adaptation of BYOD as a green IT practice
- Behavioural intention towards the adaptation of BYOD as a green IT practice
- Actual use
- Conclusions based on objectives of the study
- To evaluate NWU employees’ level of knowledge regarding BYOD in relation to
- To evaluate NWU employees’ usage level of mobile devices
- To investigate the current state of BYOD adoption and implementation at the
- To determine NWU employees’ level of interest regarding the adaptation of BYOD
- Conclusions from the statistical analysis
Remarkably, the findings of this study show that most respondents perform their work tasks with their mobile devices even after working hours. The findings suggest that most respondents (33.1 percent and 18.1 percent selected 'strongly' and 'agree' respectively in question 23 in Table 4.3 in chapter four) prefer to use their personal mobile devices over equipment issued by the institution because they enjoy working with it. with their personal mobile devices. The findings of this survey indicate that most respondents are likely to recommend to their colleagues the adoption of BYOD as a green IT practice (see question 40 in Table 4.7 in Chapter Four, where 37.1 percent and 39.4 percent of respondents 'strongly' and 39.4 percent of respondents selected 'strongly' and “agree” respectively.
This supports the respondents' view that they are very confident that the institution is comfortable with their use of their mobile devices. The results also show that the respondents actually consider it important to have access to the institution's network. This was made known through their responses, where most of the respondents indicated that they can do without units issued by the institution (see question 33 in Table 4.3 of Chapter Four, where 30.8 percent and 21.2 percent of the respondents chose "very " and "agree" . respectively).
The overwhelming majority of respondents responded positively to the questions in this section (see question 35 in Table 4.6 in Chapter Four, where 32.19 percent and 38.79 percent of respondents selected 'strongly' and 'agree' respectively).
RECOMMENDATIONS FOR FURTHER RESEARCH
To begin with, it was found that the correlation between work experience and respondents' views regarding the questions listed in table 4.9 is significant as all p-values are less than 0.05 level of significance. Second, a comparison of the perceptions of academic and non-academic employees using T-Test revealed that there are significant differences of opinion between them as the p-values are less than 0.05 level of significance. Another key finding that emerged is that there is a significant difference between the opinions of males and females as the p-values are less than the 0.05 level of significance.
The finding suggests that the male respondents tend to agree more with the questions in the questionnaire while the female respondents tend to agree somewhat. Overall, these significant findings indicate that there is a very positive perception among employees about the adoption of BYOD as a green IT practice. Therefore, there is a strong positive attitude and intention towards the initiative, as shown in the findings. This could help in obtaining more diverse biographical data, as well as diverse findings about the phenomenon under investigation and its underlying concepts.
In this way, much more interesting relationships can be established based on the larger sample used and more interesting conclusions can be drawn that can be generalized to a larger population.
LIMITATIONS OF THE STUDY
CONCLUSION
Retrieved from
Retrieved from
Retrieved from