The main consideration is to eliminate contact between humans and faecal matter. Conventional sewage system with water is not a minimum standard achievable in dense peri-urban areas in the short term, due to its high cost. Biochemical methane potential tests showed that 60% of the COD in the effluent was biodegradable and the effluent COD could be reduced to less than 100 mgCODIL if the HRT was increased giving a potential removal of 80%. The analytical campaign revealed that we were sampling at peak flow, when COD was high.
4-19 Figure 4-21: The pH profile into the reactor with effluent pH translated back by 20 hours 4-20 Figure 4-22: Souring pH profiles showing the recovery phase ending with the pH curve for normal. Figure 7-1: Sedimentation rates exhibited by discrete and flocculent particles (Horan Figure 7-2: Diagram showing the conditions for each type of settling (Eckenfelder.
LIST OF TABLES
Table V-1: Cumulative gas production for serum bottle with digestion sludge V-I Table V-2: Cumulative gas production for serum bottle with anaerobic stunning reactor sludge. Computational Fluid Dynamics Chemical Oxygen Demand Continuously Stirred Tank Reactor Department of Water Affairs and Forestry Fluorescent in situ hybridization.
GLOSSARY
The average period of time that the feedstock is held in the reactor to complete the biological reactions, calculated by dividing the reactor volume by the feedrate. A general term applied to the bulk solids separated from the wastewater, A large portion of the sludge material in a reactor.
NOMENCLATURE
Introduction
- Environmental health engineering
- Waterborne sanitation
- The state of sanitation in South Africa
- eThekwini pilot shallow-sewer study
- Project aims
- Thesis outline
- Introduction
The process of anaerobic metabolism cannot remove nutrients and pathogens. Wastewater will need to undergo secondary treatment before being released into a natural water source. The thesis begins with an examination of wastewater (Chapter 2). The role of microorganisms and the subsequent stage of water purification are discussed. The black water is described, then the wastewater characterization is discussed, especially the parameters relevant to this study.

Domestic Wastewater
- The role of microorganisms
- Enzyme kinetics
- Temperature effects
- Wastewater characterisation
- Domestic wastewater
- Characterisation of solids in wastewater
- Discharge water standards
- Peri-urban communities and their wastewater
The majority of biological treatment systems operate in the mesophilic range 20 to 40 °C. The increased temperature leads to increased biological activity which in turn increases the substrate removal. The biodegradable COD is subdivided into two fractions. The first fraction is the readily biodegradable COD fraction (RBCOD).

Anaerobic digestion and bioreactors
- Disintegration and hydrolysis
- Acidogenesis
- Acetogenesis
- Methanogenesis
Glucose is the common monomer used to illustrate the reactions that occur in the fermentation of saccharides. The major products and their stoichiometric reactions from glucose with approximate ATP yields are shown in Table 3-1. The organisms that oxidize the organic acids must use an additional electron acceptor such as hydrogen ions or carbon dioxide to produce hydrogen or formate, respectively (Bastone et al.;2002). Hydrogen must be maintained at a low concentration (below 10-4 atmospheres) for the oxidation reaction to be thermodynamically possible (Speece, 1996). Whether hydrogen ions or carbon dioxide is used as an acceptor depends on the oxidation state of the original organic matter (Droste, 1997).

Operating an anaerobic process
Anaerobic process affects alkalinity, acid formation reduces it and methane formation increases it. The overall result is a slight reduction in alkalinity (Henzeet al., 1996). The more dilute the wastewater, the lower will be its inherent alkalinity generating potential and vice versa (Speece, 1996). acid. For a diluted wastewater, the solvent can maintain stability at a lower alkalinity.

Reactor types and technology
- The continuously stirred tank reactor (CSTR)
- High-rate systems
Mixing of the contents in the CSTR is important and is generally achieved by paddle or screw systems, and is usually intermittent. Mechanical agitation is often used in smaller solvents. Free-growing biogas bubbles within the system can be recirculated to large digesters. Accumulation within the reactor by settling, binding to solids (stationary or mobile) or by recirculation.

Anaerobic Digestion and Reactors
- The upflow anaerobic sludge blanket reactor
- Multistage and multiphase operations
- The Anaerobic Baffled Reactor
The primary driver behind the ABR design has been to improve solids retention capacity. The longer the solids remain in the reactor, the more time is available for biodegradation. Boopathy and Sievers were able to measure the solids retention time of two hybrid reactors operating at a retention time of 15 d (Barber and Stuckey, 1999). Shock loads can manifest in two ways: either as a short-term transient slug lasting a few hours, or as a long-term step change lasting days or weeks before returning to the original operating state. The microbial response to both of these shock loads is identical, but the long-term shock leads to a new steady state. The performance of the reactor in the new steady state may not be the same as the previous one (Nachaiyasit and Stuckey, 1997). The pH initially increased and decreased dramatically in compartments 1 and 2. It remained constant in compartment 3 and increased in compartments 4 to 8 (Figures 3-9). The decrease in pH in compartments 1 and 2 was the result of increased VFA production, which led to a build-up. The increases in pH in compartments 4 to 8 were due to increased buffering capacity from increased feed.

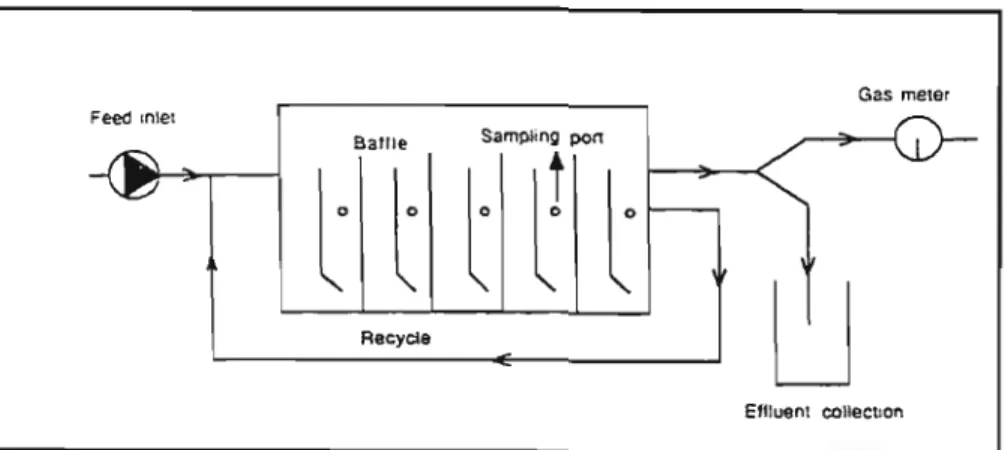
The pilot scale anaerobic baffled reactor
- Design of the pilot reactor
- Previous studies operating the pilot-scale reactor
- Operational difficulties and modification to the reactor
- Pump blockages
- Sam pie collection and storage
- Operational results
- Alkalinity and pH
- Chemical oxygen demand
- Solids in the reactor
The Umbilo sewage works was chosen as the location for the first reactor test. The treatment works received approximately 50% domestic waste and 50% industrial effluent. In a properly functioning anaerobic process, there should be a slight decrease in alkalinity from influent to effluent (section 3.5.); the results show that there was low production of carbon dioxide in the reactor in the last compartments. The pH in the reactor was low and was at the limit of pH allowed for methanogenesis to occur. The low pH is probably the reason why methanogenesis could not occur.

3 4 5 Compartments
Discussion
This allowed solids levels to increase to about twice the amount achieved in 2002. Alkalinity in the effluent was higher than that in the effluent, indicating low production of carbon dioxide produced by acetotrophic methanogenesis, indicating a low level of methanogenesis. 100 mg/L of soluble COD leaving the reactor confirmed the incomplete degradation of COD in the reactor. The internal pH was stable and almost constant from compartment 2 to the outlet at low values that prevented methanogenesis. The actual pH profile in the reactor depended only on the feed pH, but the pattern was always the same. The amounts of TSS and VSS in the effluent were independent of the amount in the effluent, indicating that the amount of solids in the effluent depends primarily on the upflow velocity in the reactor. The amount of VSS in compartment 6 is close to that of TSS, indicating that the compartment is mainly composed of biomass, and this occurs under conditions of excess substrate c.r.2.2.2. The reactor works as a single-phase digester, which mainly performs acidogenesis because methanogenesis did not take place.
Analytical cam paign
The average COD obtained from the routine analysis was 721 mg/l, the campaign shows that the average daily influent COD is approximately 564 mg/l. The influent daily variation shows that the sampling time of the routine analysis (9:00 AM to 12:00 PM) coincided with the daily influent COD peak. If the COD removal is calculated based on the campaign data, a value of 42% is obtained, compared to 71% when using routine analysis results.
Time
Reactor recovery from organic shock loads
The pH values in the reactor drop, which inhibits the activity of the methanogenic biomass, causing a greater difference in the rates of acidogenesis and methanogenesis until the pH drops enough to inhibit most of the anaerobic activity. The ability of ABR to have a cell retention time of 100 d at 20 h HRT causes the reactor to take a much longer time to reach a new steady state when the organic loading is changed (Section 3.6.5.5.). In this case, the shock load was transient and the recovery of the reactor should depend on two factors.

Conclusions
Biochemical methane potential tests
- Experimental procedure
- Preparation of nutrient medium
- Preparation of biomass
- Substrates
- Preparation of serum bottles
- Analytical methods
- Gas chromatograph calibration
- Gas loss from serum bottles
- Results of biodegradability of Kingsburgh wastewater and reactor effluent
- Discussion and conclusion
The syringe needle was introduced into the head space through the rubber septum. The syringe was held vertically for measurement. The samples with Umbilo digester sludge had similar gas production curves. The bottles with synthetic medium produced the most gas, 165 and 174 ml for bottles I and 2 respectively. They were followed by the bottles with sewage water from Kingsburg WWTW 153 and 160 mL for bottles 1 and 2 respectively. The samples with ABR sludge also had similar gas production curves.

Chapter6
Membrane Tests
- Membrane filtration
- Method
- Results
- Discussion and conclusion
The formation of the cake is slow; this serves to extend the operational life of the membrane. The cake itself is not compact, so this improves separation without significantly increasing the pressure drop across the membrane. It is impossible to routinely examine all water samples for the presence. On Figure 6-3 are the results of the first run which was a short run. The curve of cumulative volume shows there was constant flow through the system at the same time there was a slight decrease in the flux. The results also show that the pump can deliver a constant flow, and any changes in flow and flux must be due to the change in resistance at the membrane. The membrane tests could not be repeated due to time constraints and the results cannot be considered as the true performance of the membrane. The results can only be interpreted qualitatively.

Settling Tests
- Sedimentation and settling
- Discrete settling
- Flocculent settling
- Zone settling
- Compressive settling
- Settling column tests
- Data analysis
- Data selection
- Error analysis
- Settling Tests
- Statistical analysis (R-squared value)
- Results discussion and conclusion
Allowing the solids to settle at rest, samples are taken at intervals from sampling ports fixed at various depths. The concentration of suspended solids in the samples is determined. The settling tests and calculations that follow are based on the assumption that solids must settle. The plot of % non-settled solids versus parameters a and c has no physical meaning in terms of mud property. The parameters allow manipulation of the equation that best fits the curve to the data.

Conclusions and recommendations
The analytical campaign showed that there were variations in COD and in pH during the day. The variation can be linked to the functions that take place in a household. The peak between 06.00 and 09.00 was between when people wake up, wash, eat breakfast and go to work or school. The small COD peak in the late afternoon (17:00) coincides with the preparation of dinner, but 2 hours later (19:00) there is a pH peak, presumably due to the washing up. ABR handled these daily variations very well. The first compartment should be modified and increased in size to capture as much of the solids as possible.
3.3. Alkalinity
STORAGE: Samples were collected in polyethylene or borosilicate glass bottles. Bottles are completely filled with sample (must have no air pockets) and tightly capped. Because waste samples may be subject to microbial action and to loss or gain of C02 or other gases when exposed to air, samples were analyzed within 6 hours. When analysis could not be done immediately, samples were stored at 4 DC to minimize microbial decomposition of solids.
APPENDIXIII
3.5. Chemical oxygen demand (COD)
INTERFERENCES AND LIMITATIONS: In the reflux method, volatile straight-chain aliphatic compounds are not oxidized to a significant extent. This occurs in part because the volatile organic compounds present in the vapor space are not exposed to the oxidizing liquid. To eliminate interference due to N02-, 10 mg of sulfamic acid is added for each mg of N02-N in the sample.
APPENDIX/II
A PPENDIX IV
- l Method
- 2 Calculations
- 3 Results
- 4 Discussion and conclusion
- l Apparatus
- 2 Method
- 3 Calculations
- 4 Results of the settling tests
- 5 Model curves for each compartment
The diameter of the tube was 10em, and the sampling heights are at 140em, 110em, 80em, 50em and 20em. The column rotates about its axis for mixing, the idea is to mix the column sufficiently, stop and start sampling as faster. Each of the five sampling ports is designed to draw a sample from the center of the column, as the walls of the column will have an effect on the particle located close to the wall. The sample was taken from the top of the ABR on the upstream side, using a sampling column closed with a bottom plug. The sampling column was immersed in the compartment until it touched the bottom, then the stopper was closed and the captured liquid was collected in a bucket. Before analyzing for solids, a blank is prepared by allowing a sample to settle for 24 hours in the sampling bottle.