To achieve this goal, the management has started publishing a periodic annual overview of the agro-processing industry. 2016 is the Directorate's sixth annual economic review and assesses the economic performance of the 11 agri-processing divisions in 2016. The real output of the agro-processing industry fell further by 0.1% in 2016, following a contraction of 0.1% in 2015.
Real gross fixed capital formation in the agri-processing industry recovered by 6.5% in 2016, following an improved negative growth of 13.3% in 2015. Real exports of total agro-processing products contracted by 0.1% in 2016 , after a moderate growth rate of 1.1% in 2015. Due to a sharper decline in imports relative to exports, the trade surplus of the agri-manufacturing industry increased from R82 million in 2015 to R9259 million in 2016.
Due to the further negative decline in real agro-processing output by 0.1% in 2016 compared to the contraction of 0.1% registered a year earlier, total employment in industry contracted by 0.2% in 2016 after a 3. 0% recovery in 2015. However, formal employment recorded an improved positive growth of 2.5% compared to a 1.6% rebound recorded in the previous year, meaning that the formal sector of the agro-processing industry created 11,331 jobs. compared to 6 987 created a year ago.
INTRODUCTION
OVERVIEW OF THE GLOBAL ECONOMY
THE STATE OF THE DOMESTIC ECONOMY
FOOD PRODUCTS
Real gross domestic fixed capital formation in the food division recovered by 18.3% in 2016, after a decline of 7.9% in the previous year (see Figure 4.2). Gross fixed capital formation shows that investment in machinery and equipment and in buildings and structures increased by 17.9% and 29.5% respectively, while that for transport equipment fell by 33.4% in 2016 ( see table 4.1 ). The growth of the real export value of food grew by 1.3% in 2016, after similarly moderate growth in the previous year.
As a result of the relative growth of exports compared to imports, the trade surplus widened from Rr 4 712 million in 2015 to Rr 7 087 million in 2016. Despite a moderate increase in production in the food sector, the utilization of production capacities by enterprises large remained at 82.0% in 2016. Insufficient demand is the main reason for underutilization, followed by lack of raw materials and skilled labor (see Table 4.4).
Total employment (formal and informal) increased modestly by 7.0% after a 4.3% increase in the previous year. The highest proportion of employees in the food products division is represented by semi-skilled and unskilled (46.7%), followed by medium (39.5%), and high and informal with a 6.9% share. employment in 2016.
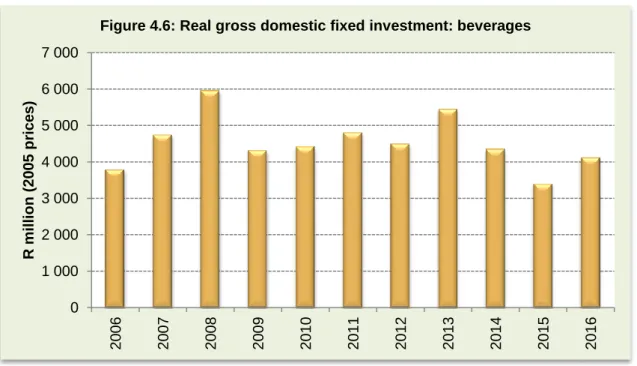
BEVERAGES
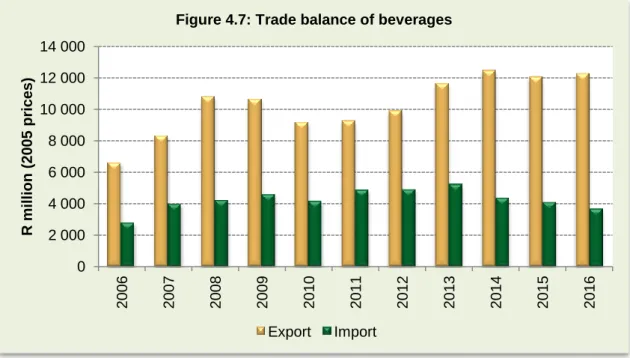
The value of gross fixed capital formation by asset in the beverage division is presented in table 4.6. The total gross fixed capital formation increased by 21.1%, which was mainly influenced by the growth of machinery and other equipment, building and construction works and transport equipment by 7.5% respectively. As a result of the relative increase in exports compared to imports, the trade surplus widened from R7 963 million in 2015 to R8 587 million in 2016.
The utilization of production capacity in the beverage division increased modestly by 1.5 percentage points in 2016 (see Table 4.9). However, formal employment increased significantly by 4.2% in 2016 from a recovery of 1.8% registered in the previous year.
TOBACCO
In 2016, real exports of tobacco products contracted by 5.3% compared to the 1.5% recovery in the previous year. As indicated in Table 4.12, the two most exported tobacco products are cigars, cigarettes (59.2%) and tobacco and tobacco substitute products (26.2%). As shown in Table 4.13, cigars, cigarettes (77.3%) and tobacco and tobacco substitutes (8.2%) are also the main imported products in the tobacco division (see Table 4.13).
16 Total employment in the tobacco division fell by 5.5% after growth of 16.1% in the previous year (see Figure 4.12). Semi-skilled and unskilled level have the highest share of 50.0%, followed by middle level and high level with a share of 34.3% and 15.7% respectively.
TEXTILES
WEARING APPAREL
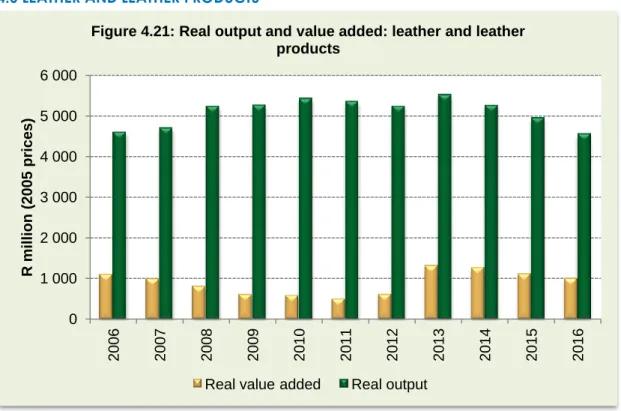
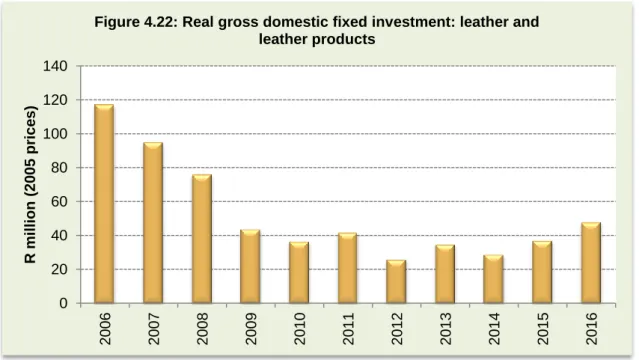
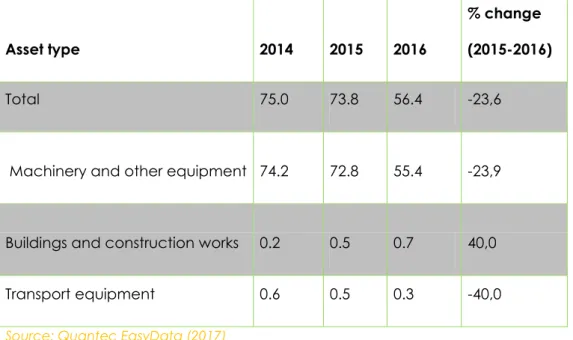
The ratio of export to production of wearables moderated at 28.7% compared to an increase of 29.5% in the previous year. During 2016, the real value added of leather and leather products decelerated by 9.9%, following a slowdown of 12.6% recorded in 2015. During 2016, real gross domestic fixed investment in the leather sector and leather products recovered by 24, 2%, after a slowdown of 5.2% a year ago.
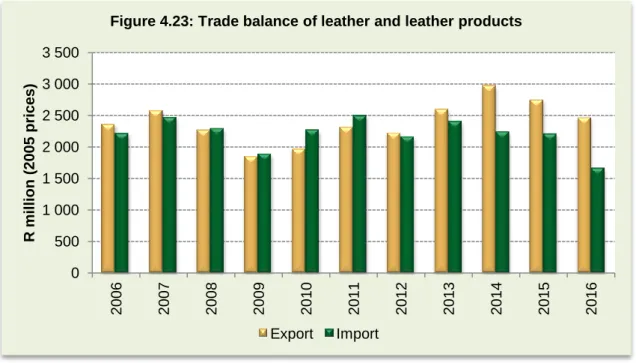
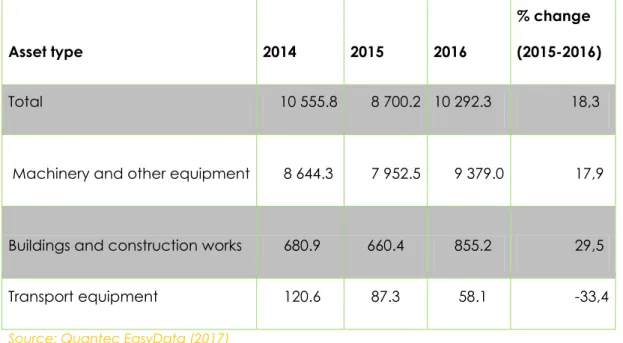
Gross investments in fixed assets increased in machinery and other equipment (44.4%), while buildings and construction works and means of transport decreased by -19.0% and -47.1% respectively (see table 4.25 ). The real value of exports of leather and leather products decreased by 10.2% in 2016, after a 3.7% increase in the previous year. Real imports of leather and leather products, however, slowed by 24.6% after a 1.5% slowdown in the previous year.
As a result, the leather and leather products trade surplus widened from R537 million last year to R801 million in 2016. Production capacity utilization for the leather and leather products sector increased modestly by 1.0 points percentage in 2016 (see Table 4.28). During 2016, total and formal employment of leather and leather products increased modestly by 9.1% and 10.1%, following a rebound of 7.6% and 7.1%, respectively, recorded in the year past (see Figure 4.24). .
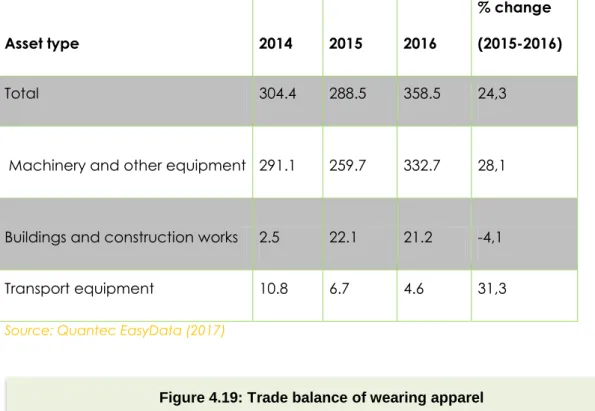
FOOTWEAR
Real exports of footwear products fell by 19.1% in 2016, following a 2.2% decline the previous year. Footwear, outsole rubber, plastic or leather and upper leather accounted for 34.5%, followed by footwear, outsole with plastic or leather and textile upper (22.9%) and footwear (20.8%) in 2016. Footwear, outsole rubber, plastic or leather and uppers were the main imported products in 2016 and accounted for the largest import share of about 48.9% of total footwear imports.
The utilization of the production capacity in the footwear division decreased by 0.6 percentage points as a result of the decrease in the production of footwear (see table 4.33). During 2015, insufficient demand remained the main reason for underutilization, followed by shortages of raw materials and skilled labor. During 2016, the footwear division's total employment fell by 8.1% after a 0.6% recovery in the previous year (see Figure 4.28).
The category of semi-skilled and unskilled levels constitutes 75.4% of the total employment in the footwear division, followed by informal, medium and high-level skill categories with 2.6% share respectively in 2016 (see Table 4.34) ).
WOOD AND WOOD PRODUCTS
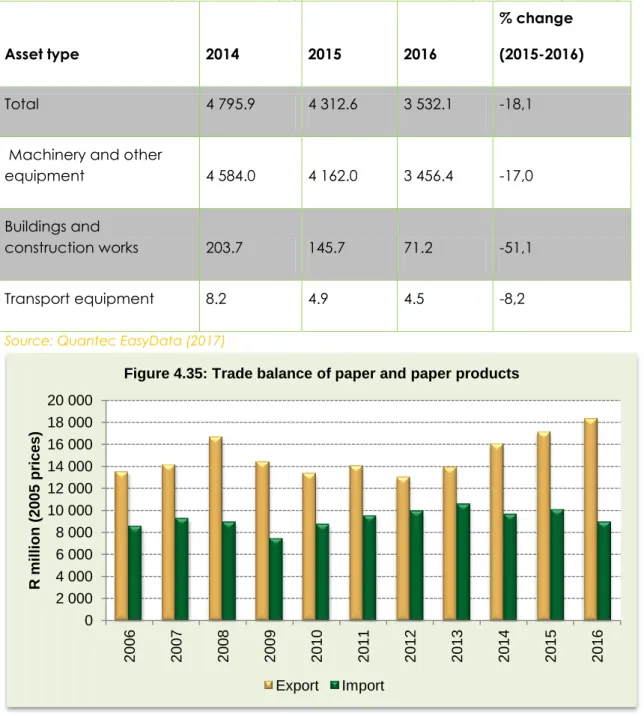
The real gross domestic fixed investments in the wood and wood products division are shown in Figure 4.30. The gross fixed investments broken down by asset type for the wood and wood products division fell for construction works (20.6%) and transport equipment (48.2%), but increased for machinery and other equipment by 13.2%. in 2016 (see table 4.35). The leading export was wood firewood with a share of 26.5%, followed by joinery and.
38 Table 4.38 shows that the utilization capacity for the wood and wood products division increased by 2.1 percentage points during 2016. Insufficient demand is the main reason for underutilization, followed by other reasons and a shortage of raw materials.
PAPER AND PAPER PRODUCTS
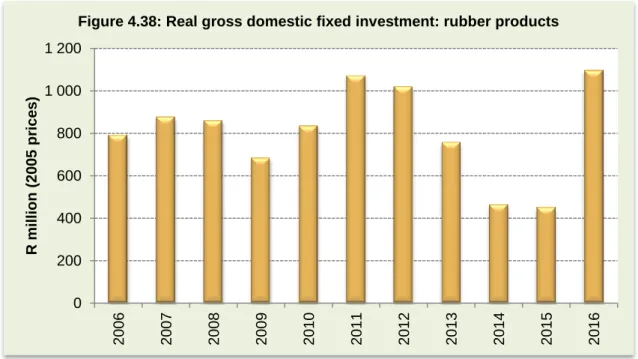
During 2016, real exports of the paper and paper products sector grew modestly by 7.0% compared to the 6.8% increase recorded in 2015. In line with the increase in real production, the utilization of production capacities from paper and paper products increased by 2.0 percentage points in 2016 (see table 4.43). Other reasons such as seasonal factors and insufficient demand remained the main reasons for underutilization of production capacities by the division during 2016.
The category of semi-skilled and unskilled workers account for about 60.2% of the total employment in the paper and paper products sector, followed by the middle and high level with a weight of 30.9% and 9.9%, respectively. . (see Figure 4.36).
RUBBER PRODUCTS
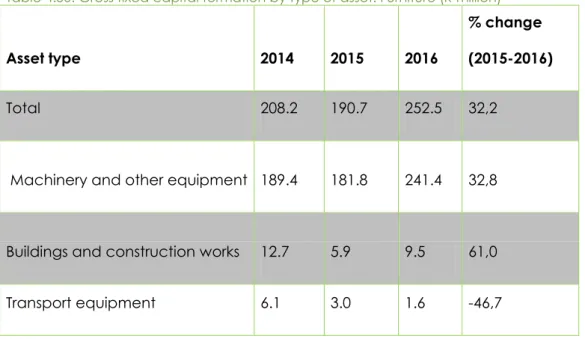
During 2016, gross fixed investments for building and construction works as well as machinery and other equipment increased by 246.0% and 137.3% respectively. Production capacity utilization for the rubber products division increased by 4.2 percentage points (see table 4.48). Insufficient demand was still the main reason for the underutilization of production capacity in the division, followed by other reasons such as lower productivity.
The semi-skilled and unskilled workers (66.5%) comprise a large share of employment in the rubber products division, followed by the middle and high level at 23.2% and 10.3% respectively in 2016.
FURNITURE
During the period under review, SADC and the EU were the main export destinations, followed by NAFTA, West Asia and Sub-Saharan Africa (excluding SADC). ) Table 4.52: The four largest imported furniture products in 2016. Insufficient demand was the main reason for underutilization of production capacity in 2016, followed by shortages of raw materials, skilled labor and semi- and unskilled labor (see Table 4.53). The total number of employees in the furniture division, as shown in Figure 4.44, decreased by 7.9% in 2016 compared to the 0.1% decrease recorded the previous year.
52 4.54 below shows the composition of jobs in the furniture sector based on skill level. The level of semi-skilled and unskilled workers (60.5%) accounts for the largest share of jobs, followed by medium-level, informal and high-skilled workers with a share of 4.7 %, respectively in 2016.
CONCLUSION
Due to a further negative decline in real output from the agro-processing industry, total employment in the agro-processing industry contracted, with 1 285 jobs lost in 2016, as opposed to 16 391 new jobs in 2015. In 2016, the divisions that jobs created food products, leather and leather products, tobacco and rubber products, while jobs were cut in beverages, footwear, textiles, wood and wood products, furniture and clothing.