The malaria seasonality component of this thesis is an output of the 'Malaria Risk Mapping in Africa' (MARA) collaboration. Parisitological data used in the continental component of the research include malaria surveys conducted across Africa.
ABSTRACT
The results of the study have important implications for health care provision in developing countries.
INTRODUCTION
It is also claimed that improvements in the use of health care can be realized quickly through the simple. To the best of our knowledge, large-scale utilization patterns from multiple primary health care settings.
METHODS
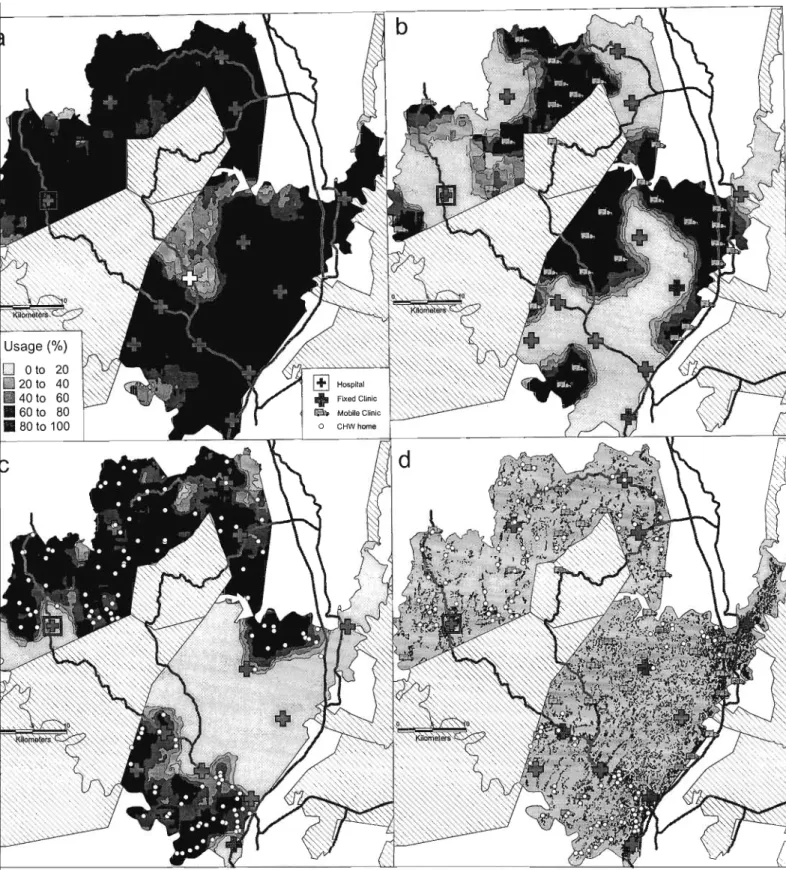
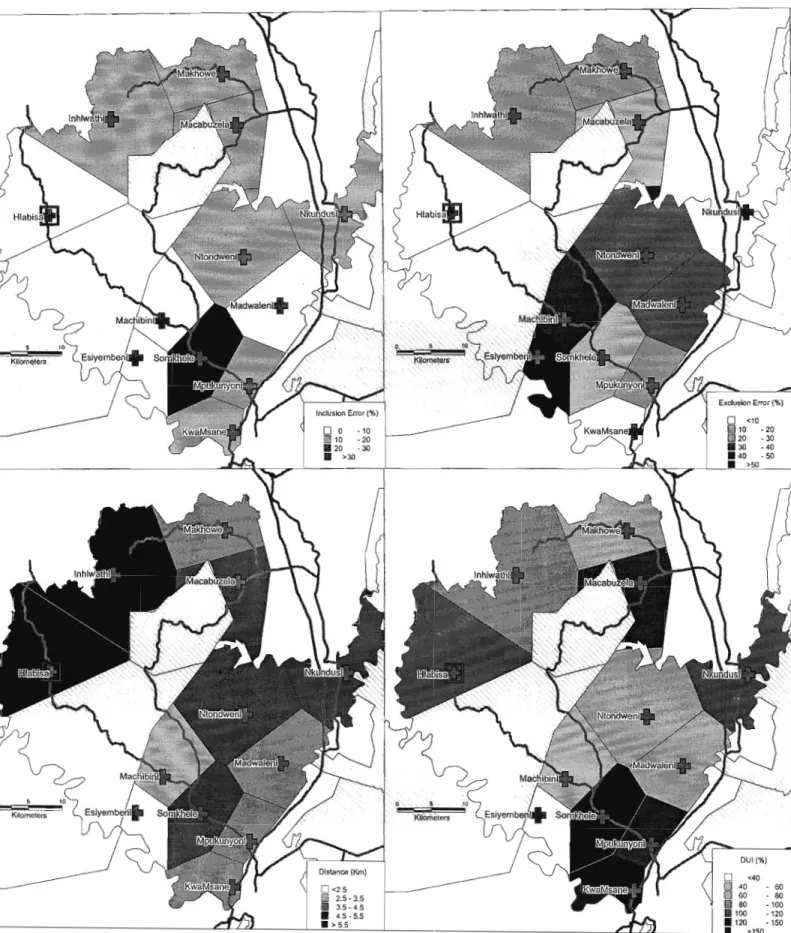
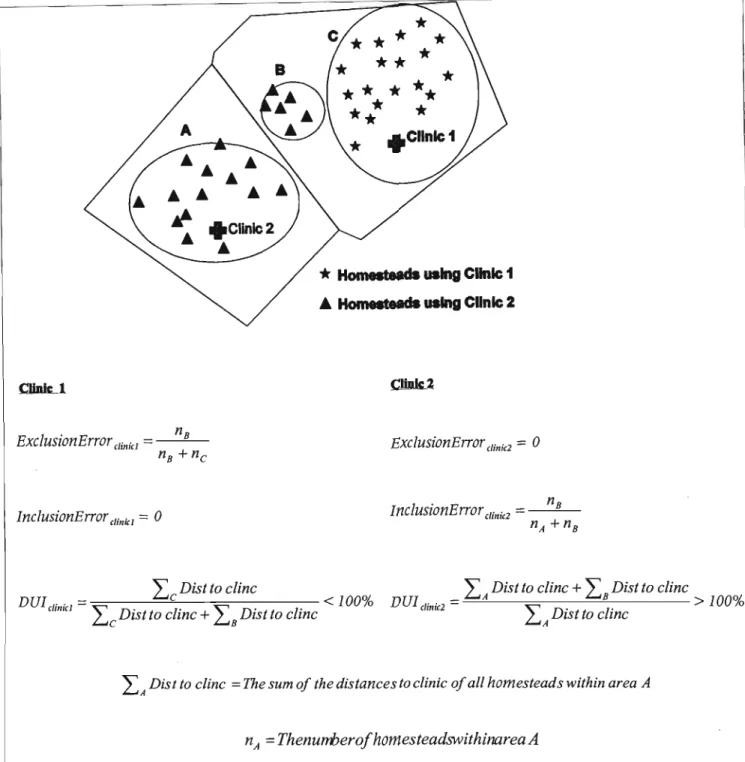
Conversely, a clinic that attracts patients only from short distances and has poor attendance within its own remote clinic range will have a DUI value of less than 100%. The concepts are illustrated with a simple map (Figure 3.1). Surprisingly, mobile clinics cover all areas of low utilization of fixed clinics.
DISCUSSION
Future research will focus on increasing the accuracy of the indices by constructing polygons obtained from cost surfaces. However, geographically stratified sampling techniques of small populations can be successfully used to facilitate the calculation of indices. Indices should be combined with demographic profiles and detailed health-seeking data to facilitate optimal positioning of health services.
Future research should focus on calculating DUI in different settings and stratified at the individual level, based on age, gender, and diagnosis.
ABSTRACT
INTRODUCTION
METHODS
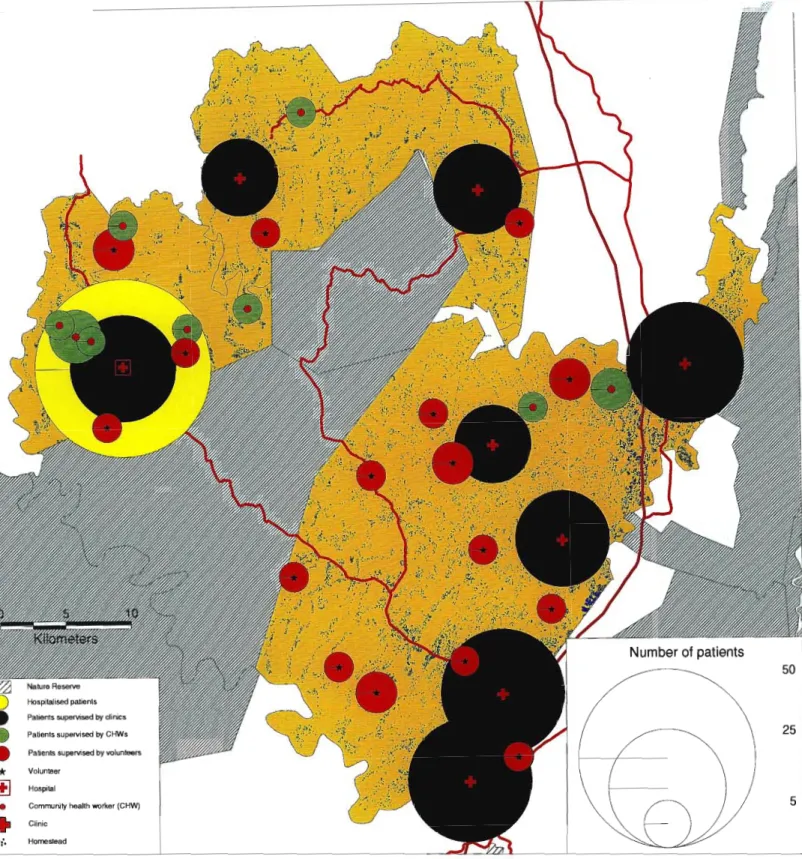
A series of district geographic layers (including highway and nature reserve boundaries) were digitized from 1:50000 topographic maps using Maplnfo (Maplnfo Corporation, New York, 1998). Tables generated from the program's database containing the geographic location of surveillance points and the number of patients monitored per year were converted to MapInfo version 5.0 format. Average residential distances at each of the surveillance points in use in 1991 and 1996, as well as the potential.
While the number of cases has increased, the apparent "overconcentration" of treatment points in some areas is simply a function of
DISCUSSION
Our experience shows that GIS/GPS could play an important role in tuberculosis control program management, service development and research. Much remains to be understood about the transmission dynamics of tuberculosis in developing countries (Wilkinson et al., 1997) and GIS/GPS will be a useful complement to molecular techniques and conventional epidemiology in elucidating transmission routes and clusters of multidrug-resistant cases of tuberculosis. example. GIS/GPS could assist in the rational development of community-based care by providing maps, locating potential surveillance points and focusing on areas of special needs.
GIS/GPS can also be used to locate cases and identify epidemics or localized outbreaks.
GIS / GPS technology to document increased access to tuberculosis treatment
ABSTRACT
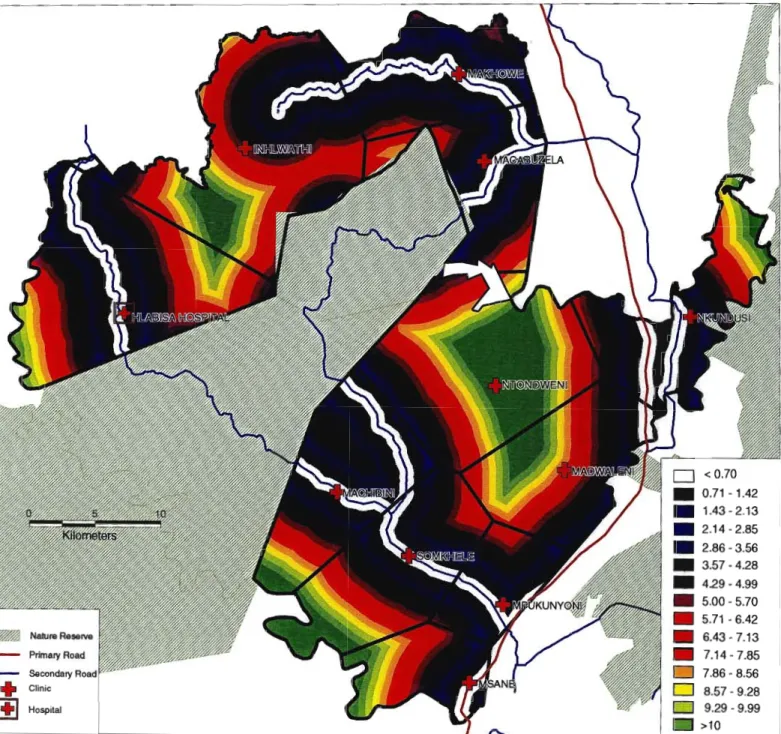
Objective: To describe the heterogeneity of HIV prevalence among pregnant women in rural South Africa and relate this to the proximity of homes to roads. Methods: HIV prevalence is measured through anonymous surveillance among pregnant women stratified by the local village clinic. Average distance from houses to road 1° or 2° for each clinical catchment was strongly associated with HIV prevalence (i=0.44; p=0.002).
Conclusions: Substantial HIV heterogeneity in this district is closely related to proximity to the 1° or 2° pathway.
INTRODUCTION
METHODS
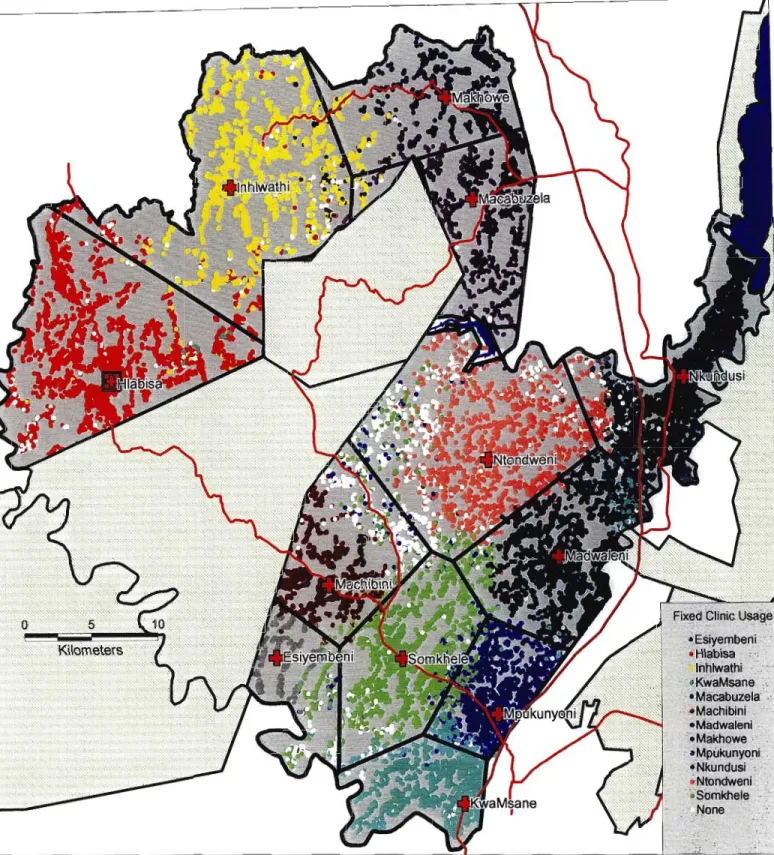
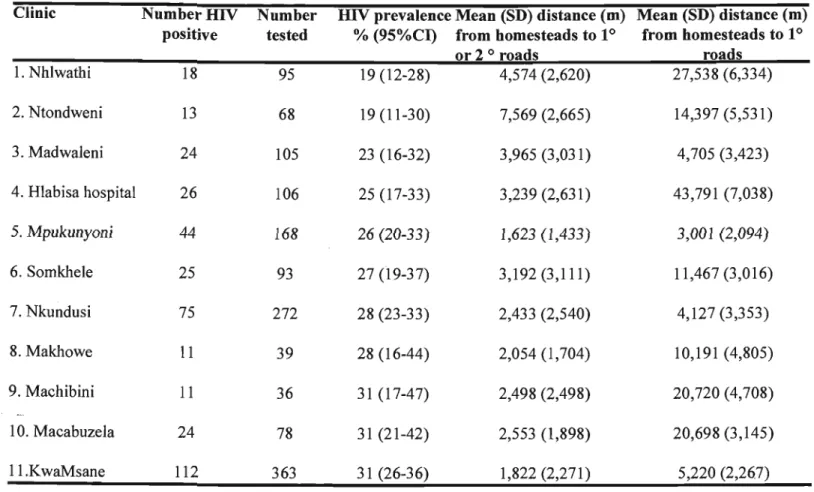
Clinic numberHIV number HIV prevalence Mean (SD) distance (m) Mean (SD) distance (m) tested positive % (95%CI) from farms to 10 from farms to 10. As shown in Figure 5.2, HIV prevalence was mostly highest in the catchment areas of the clinics through which the national highway (10) passes. The lowest HIV prevalence is observed in clinic catchments where neither 10 nor 20 roads pass through them.
A scatterplot of average distance from home to road 10 or 20 versus HIV prevalence (Figure 5.3) shows a strong correlation between these two variables.
DISCUSSION
For example, the clinic catchments east of the district show high levels of closeness, while the more central and western catchments show much lower levels of closeness. However, as the most populous parts of the district are fairly flat and accessible, this assumption may not affect our data too much. Alternatively or in addition, it may be that there is more sex work close to major roads, especially the national road that crosses the eastern part of the district, than in the more rural parts of Hlabisa.
As mentioned above, the type of traffic on a road and its stopping frequency may be more important than the road size: most of the traffic on this road does not stop in the district.
ABSTRACT
INTRODUCTION
The aim of the system is to collect demographic and epidemiological data on a population of 75,000 people and to monitor the effects of the HIV epidemic on the population longitudinally (Hosegood, 1998). The system's methodology required field workers to go to every house in the study area every 60 working days and administer questionnaires to the residents of the houses. Heterogeneities in the study area and the dispersed population present significant problems for evaluation and equitable distribution of work.
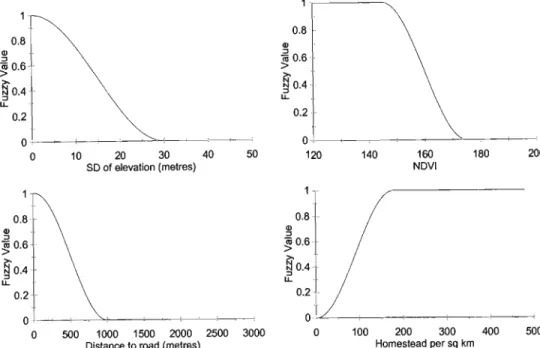
I use a fuzzy accessibility model within a GIS to adjust for the variable social and physical characteristics of the study area and achieve an equitable subdivision of the area into subunits (fieldworker areas) of equal completion time.
METHODS
For the purposes of the study this error was unacceptable as some homesteads are only 10m apart. A series of geographic layers of the district (including magistrate and nature reserve boundaries) were digitized from 1:50000 topographic maps using MapInfo (MapInfo Corporation, New York, 1998). I superimposed all homesteads on the predicted mean inter-homestead run time image and extracted the mean run times for each homestead.
The resulting re-estimated score of the multiple regression equation (predicted mean home walking time) is shown (Figure 6.3).
DISCUSSION
A particularly encouraging aspect of the methodology was the accurate prediction of walking times between homesteads (r = 0.864) across a wide range of varying social and physical landscapes, despite the fact that a homestead visiting sequence was not imposed on the fieldworkers. The integrity of the wide area averaging technique is preserved as the average walking time is still around 20 minutes. A shortcoming of the model is that running times can be underestimated for isolated homesteads that occur on the periphery of field worker areas due to an over-.
However, the performance of the model is difficult to accurately assess because questionnaire administration in the first round takes significantly longer than in subsequent rounds (for which the model is configured).
ABSTRACT
INTRODUCTION
The main objective of the research was to use a GIS to produce the first climate-based seasonality model of malaria transmission in Africa. The International Panel on Climate Change predicts that the earth's average surface temperature will rise by about 1-3.5°C over the next century (IPCC, 1996). Climate change is likely to hit Africa hardest, even though the continent produces only about 7% of the world's greenhouse gases.
Understanding disease seasonality is particularly important in accurately predicting the effects of climate change on disease prevalence and incidence (McMichael et al., 1996).
METHODS
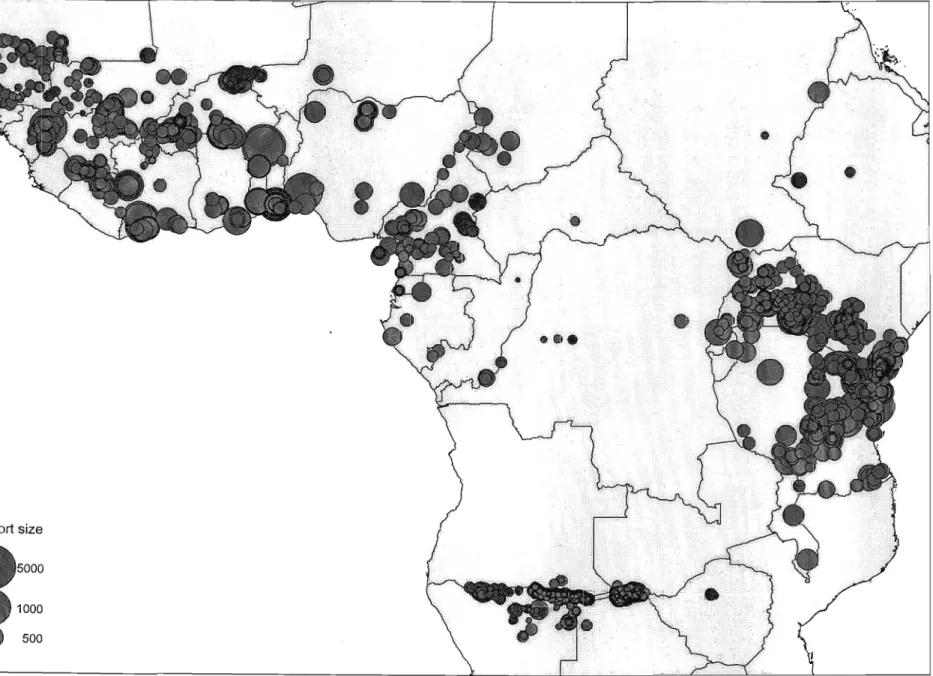
We adopted a 3-month prior moving average approximation (eg the value of March is the average of January, February and March) for both temperature and rainfall inputs in the model to temporally smooth the data, remove sporadic fluctuations rowing and taking into account the time lag between suitable climatic conditions and the occurrence of malaria. We plotted the mean parasite proportion (weighted by total cohort size) against the predicted number of months suitable for transmission (as calculated by the seasonality model) and tested the statistical significance of the relationship. Isolated pixels predicted to have two malaria seasons were replaced with the majority transmission pattern of the surrounding pixels (since this is of no value from a continental control perspective).
Estimates of population exposure to disease for 1995 in each of the seasonality categories (under current climate conditions and after a global average temperature increase) are presented (Table 7.2).
DISCUSSION
Understanding malaria seasonality is critical for accurately predicting the effects of global warming (McMichael et al., 1996). Both the duration and the beginning and end of the malaria season(s) are important in informing malaria control efforts. The length of the season will affect the dynamics of transmission with longer seasons allowing for more intense transmission and higher levels of infection in the human population.
For example, in an area where the infestation lasts for seven months, the impregnation of insecticide-treated mosquito nets should be carried out just before the start of the season, with a residual effect of at least seven months. Moreover, it is often important to know not only the number of months at risk, but also the timing.
TUBERCULOSIS
The overall objective of this thesis was to demonstrate the potential of GIS to be an effective, relevant and powerful tool for health research and development in Africa. In this conclusion, I review the major research findings and their implications for health policy and suggest some directions for future research. I then conclude this chapter with some general conclusions regarding the status and future of GIS health research in Africa.
HIV
MALARIA
Knowledge of both the duration and the start and end of the malaria season(s) is important to inform malaria control efforts. In an area with seven months of infection, e.g. impregnation of insecticide-treated beds is carried out just before the start of the season and with a residual effect of at least seven months. In the above example, an area characterized by a malaria season of seven months' duration would require a very different strategy than an area consisting of two distinct malaria seasons of four and three months respectively.
Studies have shown that such control measures are only effective if one treatment is applied before the start of the malaria season and has an effective residual life during the entire malaria season (Sharp and Ie Sueur, 1996).
HEALTH SYSTEMS
There is a possibility that the model could be improved by incorporating satellite-derived indices of moisture status (e.g. indices are likely to increase as one moves from the household level to the individual level as more deviant use behavior is revealed). The indices could be improved by building polygons that would include other factors affecting physical accessibility (e.g. access to public transport) within their boundaries.
The methodology could be extended to the ergonomic design of home care programs and direct observation of tuberculosis (DOT) and location information of health facilities.
GENERAL CONCLUSIONS
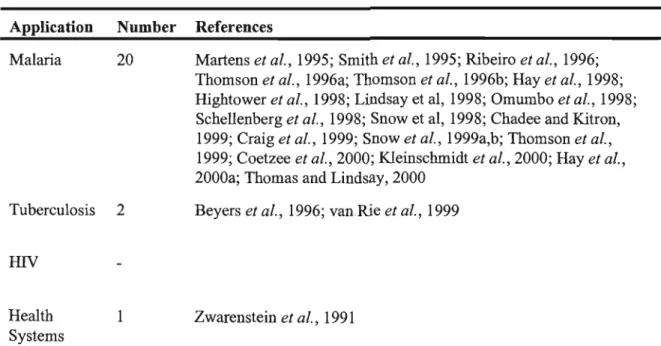
Another remaining obstacle to the growth of GIS in health in Africa is convincing role players (often from organizations with limited funds) of the potential uses and cost. In: Towards a Malaria Risk Atlas in Africa: First Technical Report of the MARAIARMA Collaboration, Durban, x-xi. MARA (1998) Towards an atlas of malaria risk in Africa: first technical report of the MARAIARMA collaboration, Durban.
Wilkinson D and Davies GR (1997a) The increasing burden of tuberculosis in rural South Africa - impact of the MV epidemic.
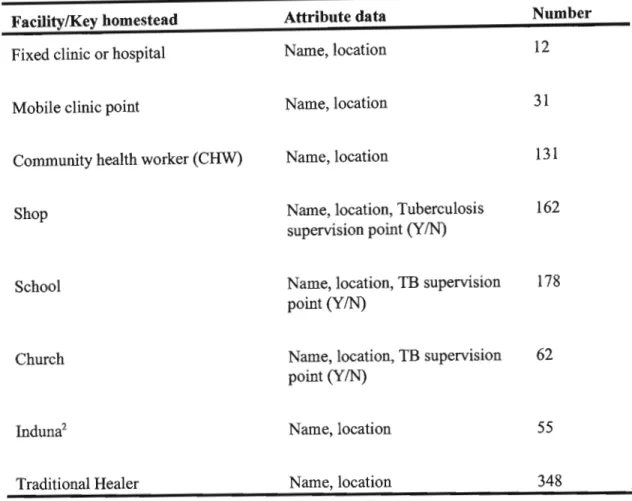
Attribute data collected at each facility .•
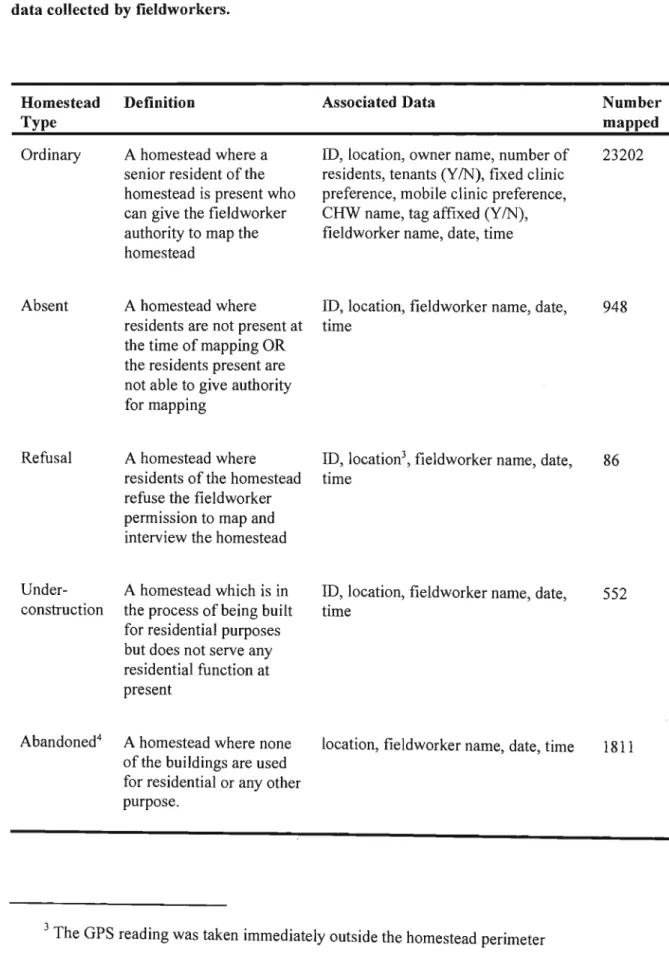
Attribute data collected at each homestead
A data dictionary fIle
A PDOP graph
Idrisi malaria seasonality macro