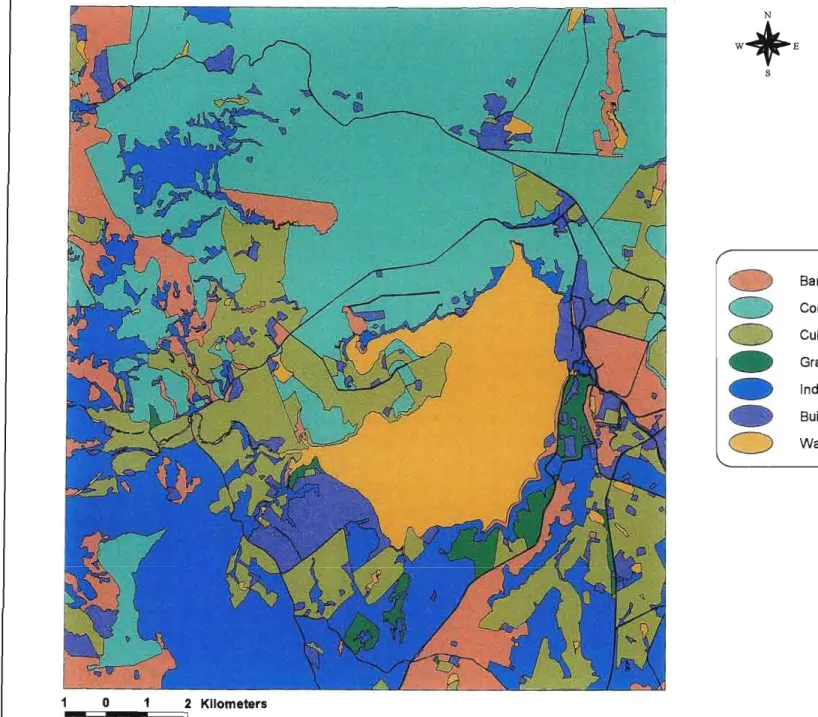
The data were subsequently analyzed to detect relevant trends in land use/cover patterns in the study area. In general, the land use/cover pattern for the Albert Falls area in the period 1944 to 2000 can be described as mainly agricultural.
Land Use/Cover Change
Land use/cover change assessment can play a major role in any sustainable land use planning. As such, the relationship between land cover and land use focuses on the human interventions on the land.
The Significance of the Study
When the users of land decide to use its resources for different purposes, land use/cover change occurs. Such information is needed by scientists and policy makers to understand, anticipate and possibly prevent the adverse effects of land use/cover change (Pontius et al., 2001).
The 'Importance of Albert Falls Area
Therefore, land tenure reform may impact land use in Albert Falls Area in the future. Land use/cover changes have occurred at all times and in all parts of the world (Ford, 2000). Most available land use/cover change models have been developed for specific purposes and locations (Veldkamp and Lambin, 2001).
Several visits were made to the study area to determine the land use/cover classes. This study provided spatial and descriptive databases on the historical land use/cover of the Albert Falls area.
Aim and Objectives
Structure of the Thesis
In addition, conventional land use/cover change assessment methods are also briefly discussed in the second chapter. This chapter will briefly discuss the possible causes and effects of land use/land cover changes.
Major Determinants of Land Use/Cover Change
Biophysical Factors
- Climate
- Vegetation
- Soil
However, not all changes in land cover by land use imply land degradation. Specifically, the land use/cover databases developed in this study can be used in a variety of applications, including those described below:
Socio-economic and Political Factors
- Socio-economic Factors
- Land and Natural Resource Policies and Regulations
Impacts of Land Use/Cover Change
Land Degradation
- Soil Erosion
- Biodiversity Loss
Assessing the change in land use/cover patterns in the Albert Falls area can help develop sustainable land use systems. Because of these advantages, this study used vertical aerial photography to assess patterns of land use/land cover change in the Albert Falls area. Aerial photographs of various scales were used to develop a historical land use/cover database of the Albert Falls area for the years and 2000.
This will be followed by a description of changes in land use/cover patterns, along with discussions of observed trends. The influence of the above-mentioned factors would also continue to play a dominant role in the formation of land use/cover patterns in the area under consideration.
The Significance of Land Use/Cover Changes
Analysis of Land Use/Cover Changes in Support of
One of the challenges of land reform is to relieve land pressure without environmental degradation over a wider area. The government therefore has a plan for any land development project to be properly planned and the necessary measures are taken to control the zoning, pluming and ultimate use of land and water resources for sustainable use of the land (Marcus et al., 1996; Department of Land Affairs 1997a).
Assessment of Land Use/Cover Changes
Land Use/Cover Scenario Analysis
After a series of visits to the study area and reading relevant literature, each land use/cover class in the study area was identified. Thus, it was necessary to select the appropriate map projection to assess patterns of land use/land cover change in the Albert Falls area.
The Role of Geographic Information System in Land
ProjeCting Future Land Use/Cover Changes
Some land use/cover change analysts use models to project future rates and patterns of land use/cover change. Models can take different forms and there can be different types of models that are potentially useful for studying land use/cover change (Verburg et al., . 1999; Veldkamp and Lambin, 2001; Pontius et al., 2001).
Summary ·
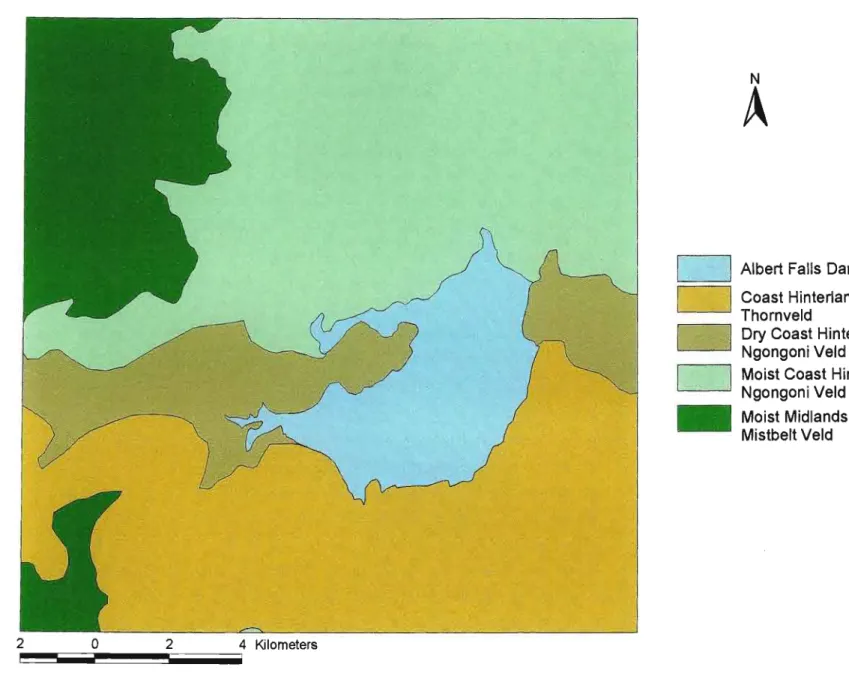
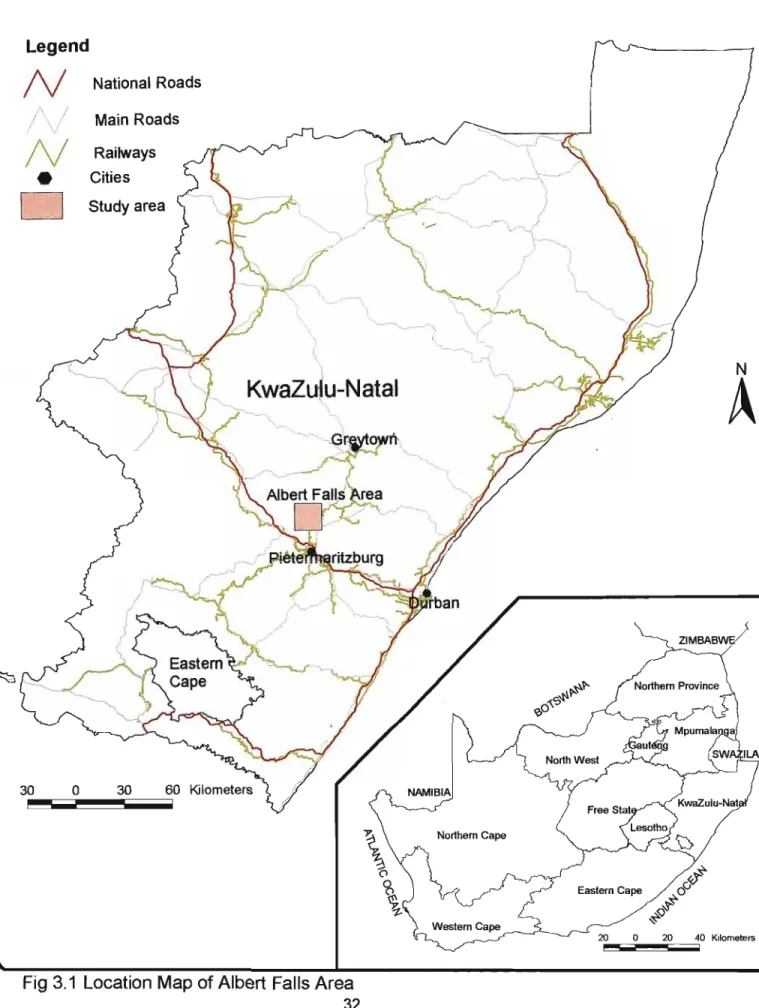
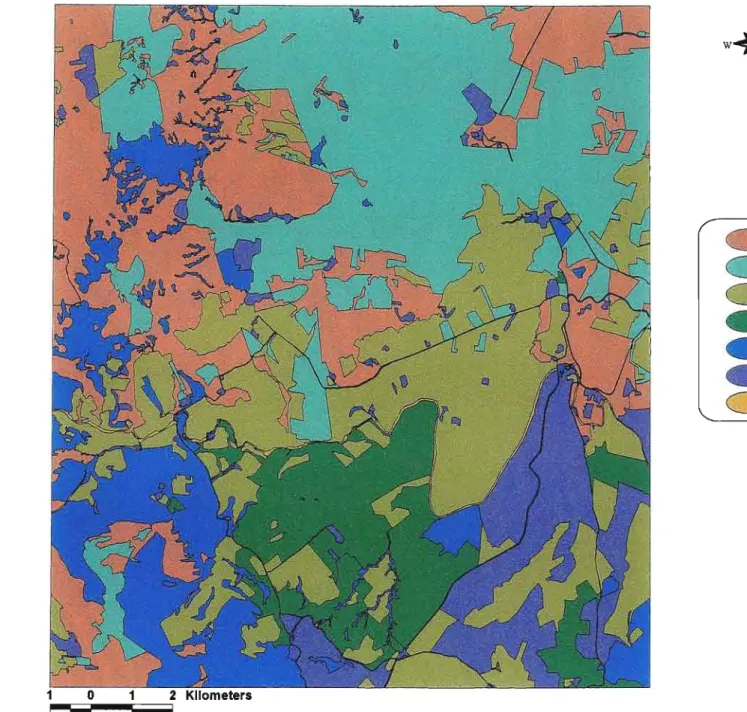
The wet inland Ngongoni Veld dominates the north and northeast of the study area (Figure 3.3). The Coastal Hinterland Thornveld covers most of the southern third of the study area.
The Biophysical Environment
- Temperature
- Precipitation
- Topography .... ........................... ........... _
- Water Resources
- Geology
- Soils ... ....... ...... ................. .................. ...... .. ...... ... .... ................... ..... .............. 3 9
- Natural Vegetation
The dry coast hinterland Ngongoni Veld runs across the middle part of the study area in a narrow east-west strip. The land that falls in the humid coastal hinterland Ngongoni Veld part of the area has 60%.
Socio-economic Settings of the Study Area
Economic Growth in the Study Area
Nevertheless, dairy plays a dominant role in the agricultural economy of the region (Natal City and Regional Planning, 1973). Therefore Albert Falls Area is important for the economic development of the region in particular and the whole country in general.
Human Resources
As in other parts of South Africa, major land use/cover changes have occurred in the trend of the Albert Falls area between 1944 and 2000. Chapter four will discuss the materials and methods used to develop the historical land use/cover databases.
Land Use/Cover Classification
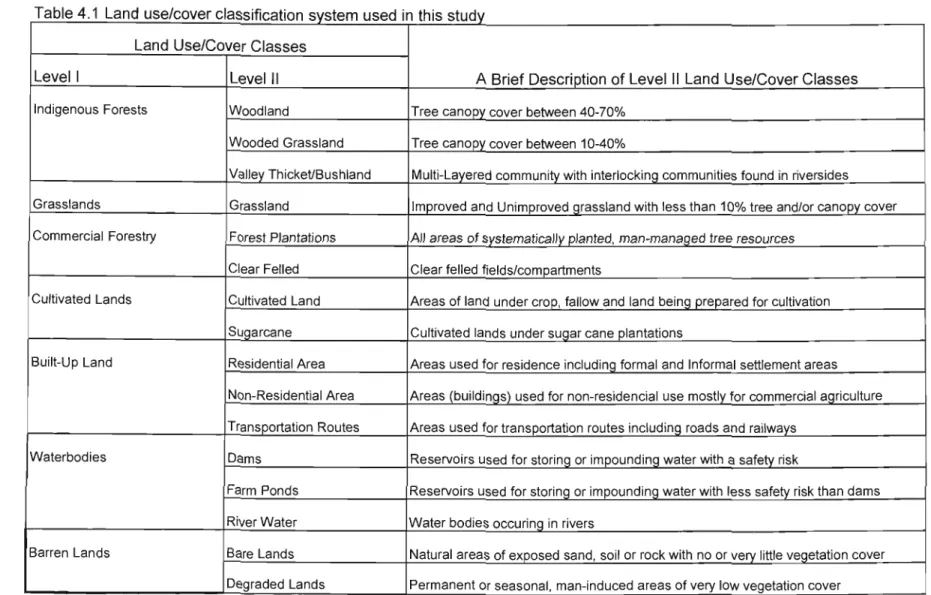
The land use/cover classification used in this study was based on the classification defined by Thompson (1999) for South Africa (Appendix III). The definition of grassland was based on the South African land use/cover classification system.
Land Use/Cover Mapping
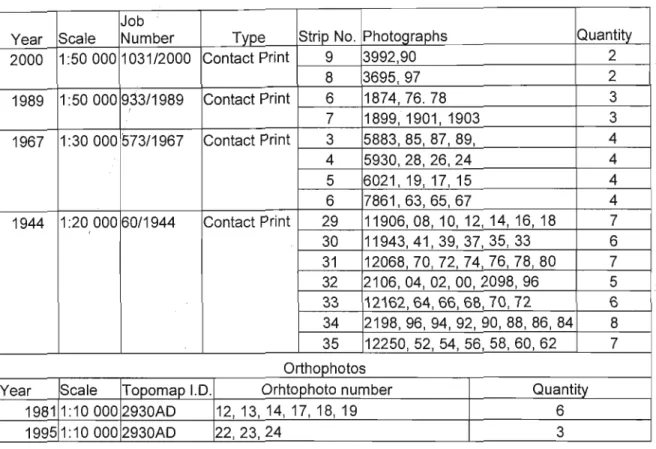
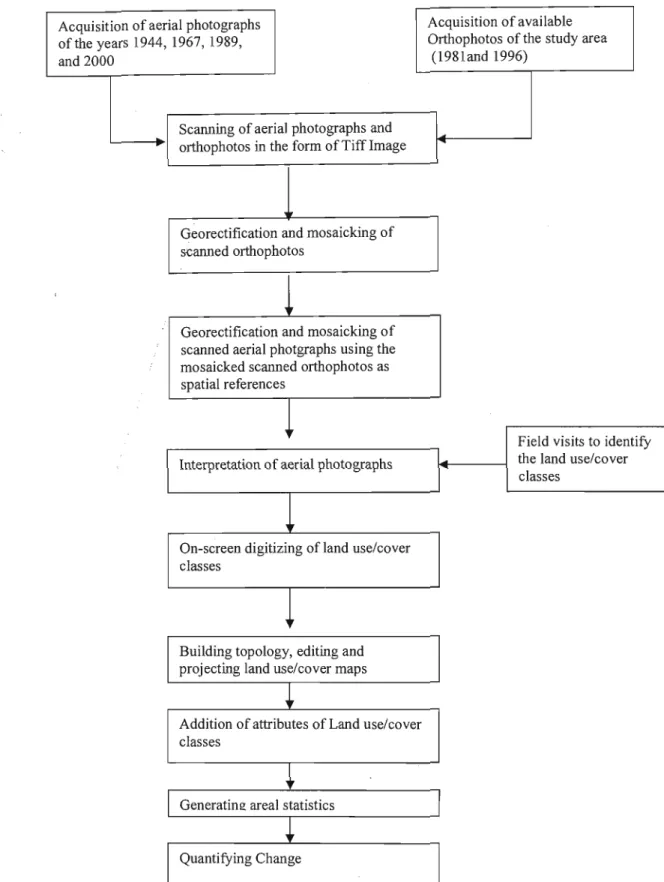
Aerial Photography
Each set of aerial photographs was then mosaicked using Smart Image Software to produce a complete coverage of the study area. Finally, as the mosaic images covered areas beyond the study area, these areas were cropped using Smart Image Software to produce a complete coverage of only the study area.
Aerial Photo Interpretation
To minimize the inaccuracies due to resolution and distortion, the aerial photographs of the study area for each year were scanned with a Hewlett-Packard ScanJet 5370C Scanner at 600dpi to maintain the optimal resolution. As the degree of generalization is under the subjective control of the interpreter (Campbell; 1993), the degree of detail used in this study was determined by the classification used (Table 4.1).
Digitizing
The land-use/land-cover databases developed in this study can be used for planning and management purposes, as great precautions have been taken in their preparation. In this study, on-screen digitization using ArcView 3.2 (ESRI, 1998) was used to track land use/cover characteristics from scanned and mosaicked aerial photographs.
Projecting the Land Use/Cover Maps
Digitization enables us to digitize certain features of a map or photograph, such as land use/cover classes, polling districts, land class boundaries and so on. For each year and 2000), the mosaicked aerial photographs were digitized separately to create accurate polygons of carefully interpreted land use/cover classes.
Editing
In 2000, there were only minor changes in the different land use/cover classes compared to the land use/cover classes in 1989. The main infrastructure covered during the land use/cover assessment includes roads and railways that are in the area. A model combining socio-economic and biophysical data is needed to project land use/cover patterns in the Albert Falls area in the near future.
It is therefore recommended that Umgeni Water takes into account the changes in the historic land use/cover pattern of Albert Falls Area when implementing the holistic Mgeni Catchment plan. ANNEX:III Standardized South African Land Use/Cover Classification System and associated description (Source: CSIR, 2001).
Mapping Error and Accuracy Measures
Land Use/Cover Change Analysis
The summary tables were exported to Microsoft Excel for further analysis, where changes in land use/cover over the study period were quantified. This chapter describes all materials and methods used to develop the historic land use/cover maps of the Albert Falls area.
Changing Patterns of Level I Land Use/Cover Classes
As Albert Falls Area is an agricultural area, the relative coverage of Residential Area is small compared to the other land use/cover classes. Land use/cover pattern in Albert Falls Area during the period 1944 to 2000 can be described as mainly agricultural.
Changing Patterns ofLevellI Land Use/Cover Classes
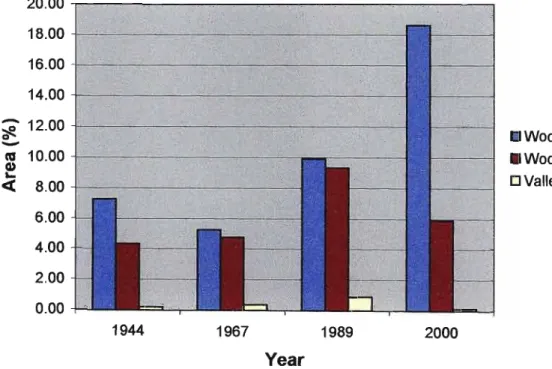
Indigenous Forests
- Woodland
- Valley ThicketlBushland
Moll (1976) identified Woodland Vegetation as occurring in the northern and northeastern parts of the study area and around Albert Falls Dam. Moll (1976) identified Valley ThicketIBushland as Fringing Forest (Valley Bushveld) occurring in the northern and northeastern parts of the study area and around the Albert Falls Dam area.
Grassland
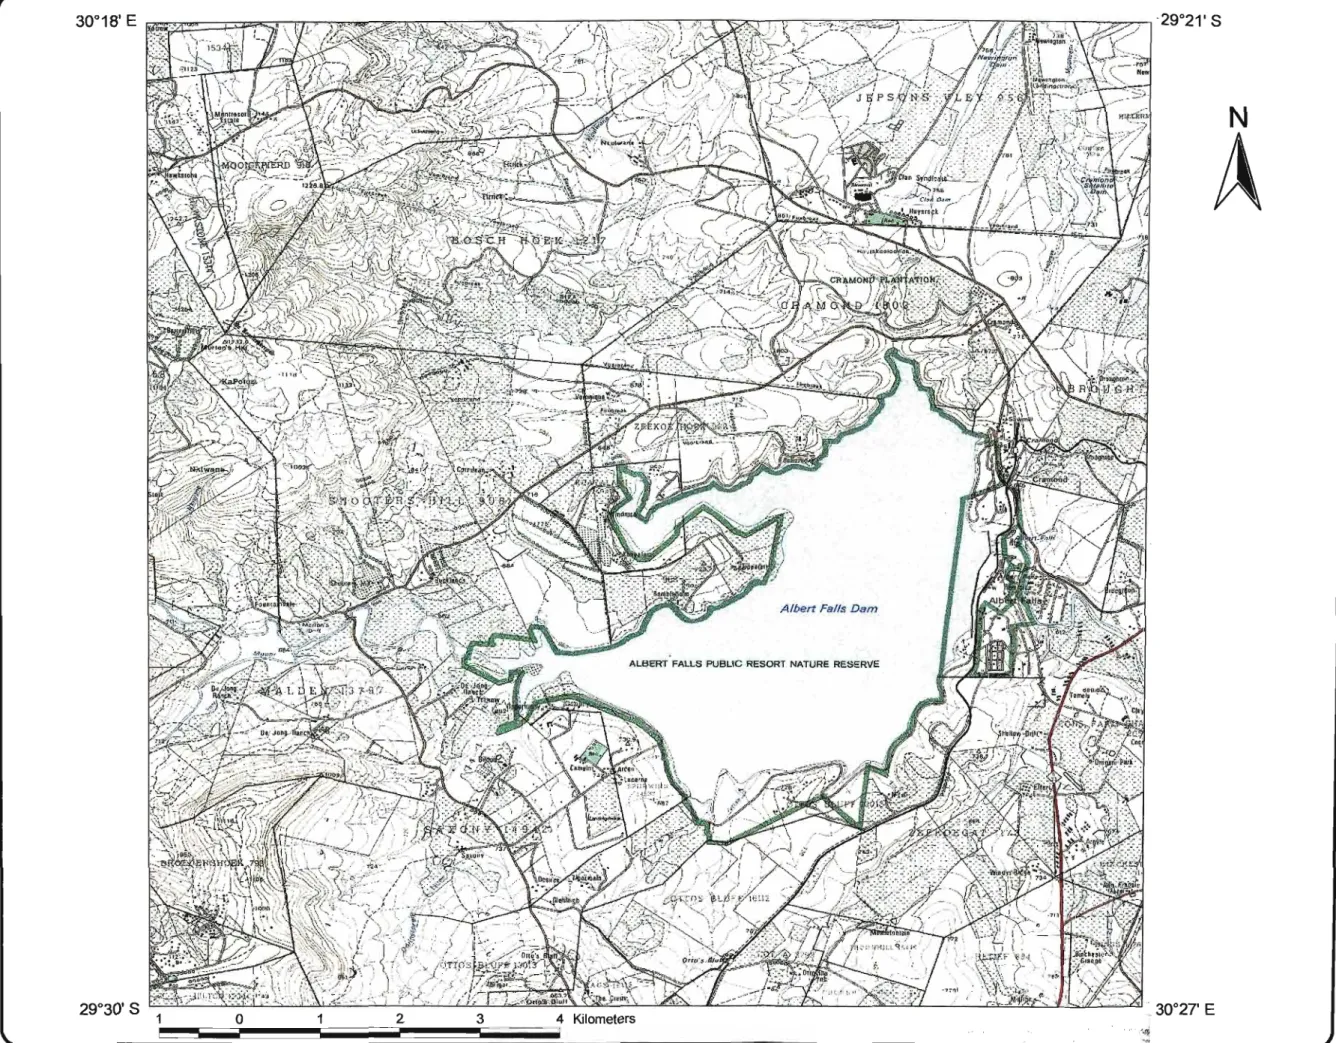
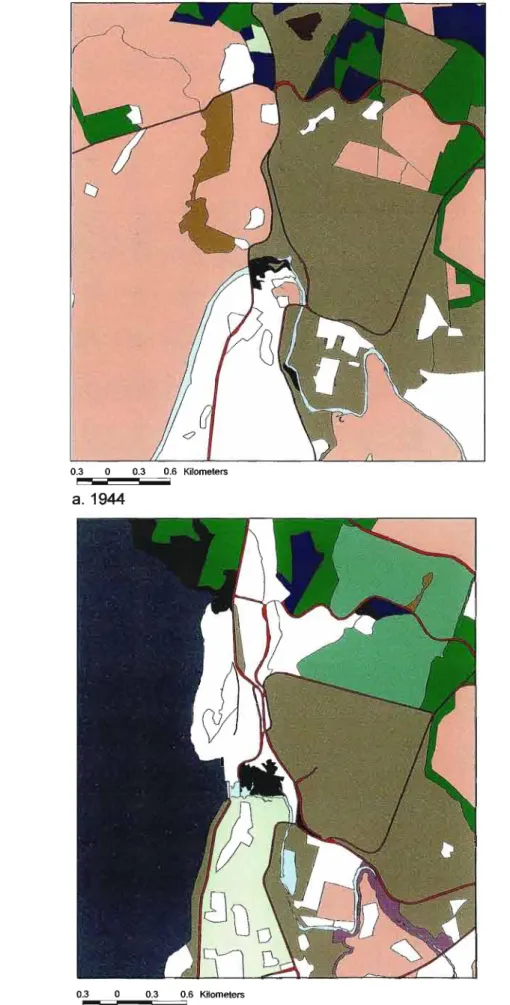
Crammond, Albert Fall (Figure 3.2) is a typical example in the Albert Falls Area that experienced a dramatic pattern of land use/cover change during 1944 to 2000. Geographic Information Systems: Principles and Applications, V. Change Analysis of land use and land cover in CIP EC.
Cornrnercial Forestry
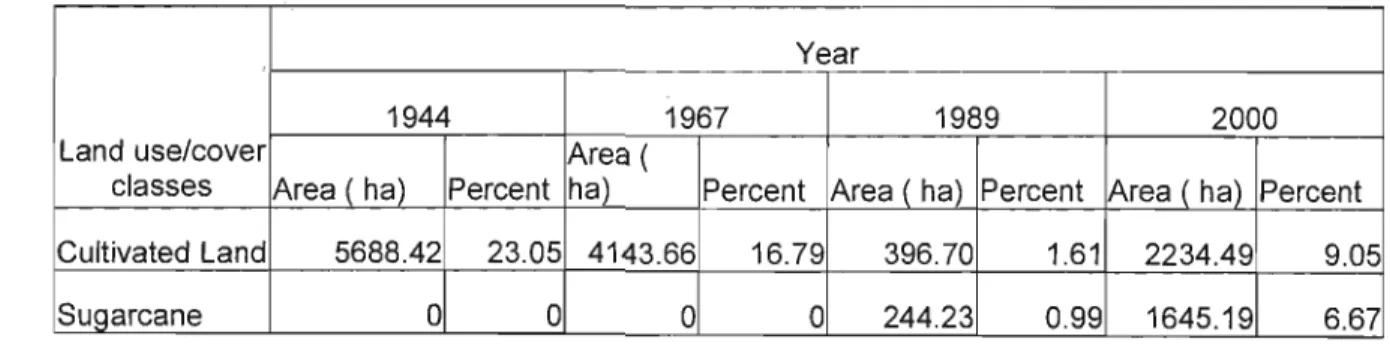
Cultivated Lands
- Sugarcane
This decline in cultivated land could be attributed to the conversion of these lands to commercial forestry or to sugarcane plantations, which are economically important; and the taking of land by large water bodies such as the Albert Falls Dam and/or reserving the land for protection of the natural environment, such as in the Albert Falls Nature Reserve. Consequently, the expansion of sugarcane plantation in the Albert Falls area could be attributed to the low prices paid for other alternative commercial agriculture, for example, thattle products, and the favorable economic trends in the sugar industry.
Built-Up Land
- Transportation Routes
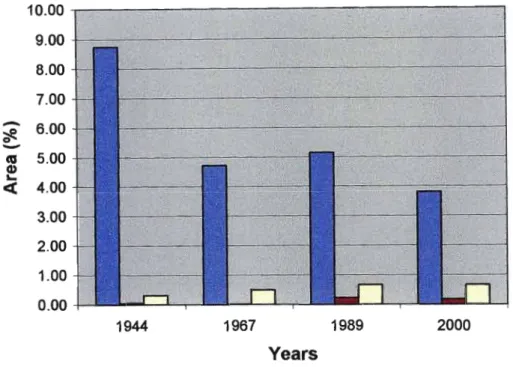
This reduction could be attributed to the conversion of scattered residential areas from 1944 to large-scale commercial forestry. This decrease may be due to the interpretation of some non-residential areas as residential areas.
Waterbodies
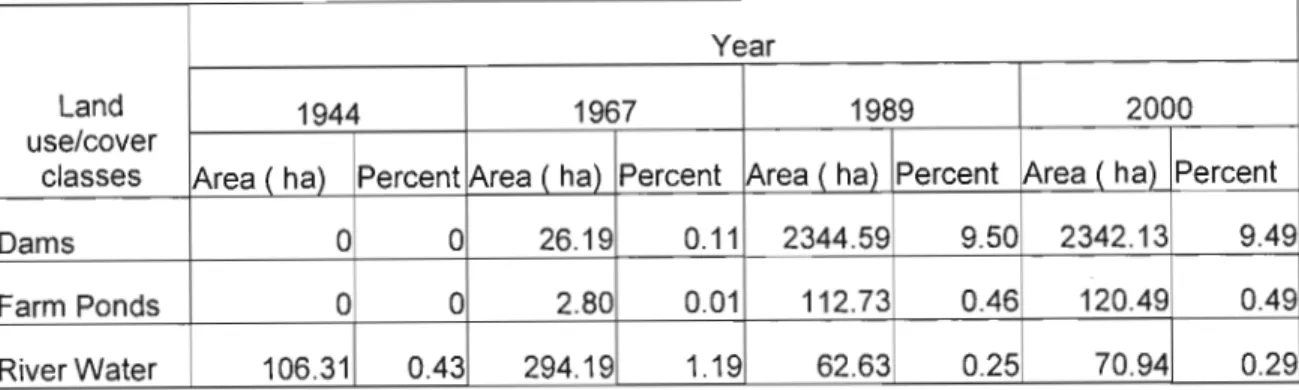
- Dams
- Farm Ponds
- River Water
Increased dam building in the area was a means of meeting the growing needs and rising standards for water in the region (Natal City and Regional Planning Commission, 1973). This increase in the coverage of the area blocked by Farm Ponds was due to the construction of Farm Ponds for irrigation in order to respond to the increased demands for food production, improved technology (Tarboton and Schulze, 1990); and dry spells experienced during the early 1980s (Huntley et al, 1989).
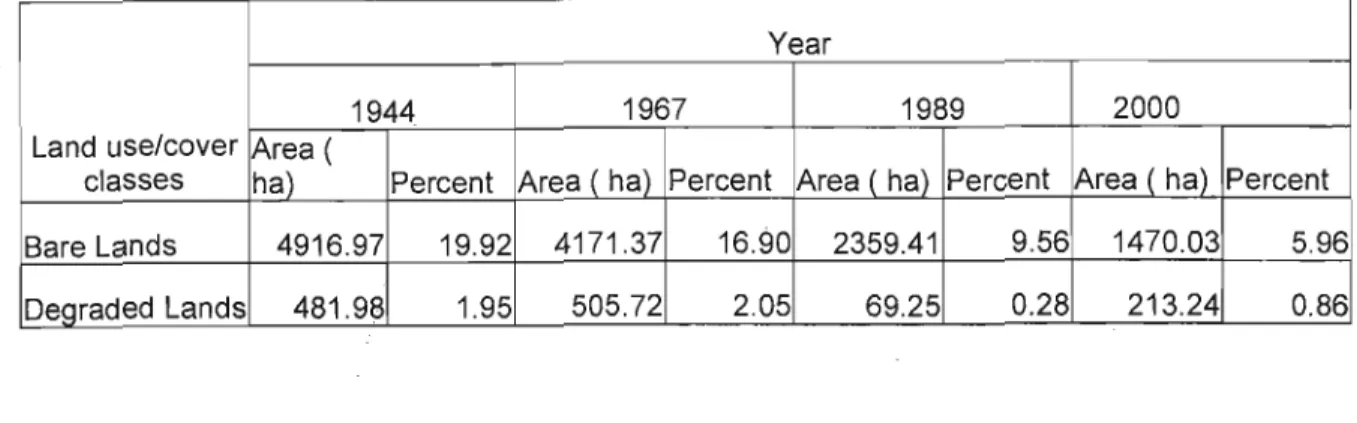
Barren Lands
- Degraded Lands
However, with the development of the forest industry and other agricultural activities in this area, bareness decreased dramatically in 1967,6 4171.37 ha, which represented 16.90% of the total area. The type of farming practiced and the attitudes of farmers towards soil conservation may have contributed to the reduction of degraded land (Tarboton and Schulze, 1990).
An Example of Detailed Land Use/Cover Change
Land use and land cover change: the scientific significance of land use and land cover change. Interaction between land cover/land use dynamics and climatic variability in the western OklahamalKansas/Texas indicator region. The use of GIS to investigate changes in land use patterns in the mid-basin, M.sc.
Prediction of Future Land Use/Cover Changes in Albert Falls Area
Future Applications of the Study
Interactions between driving forces, proximate resources and impacts of land use/land cover change. Land use and land cover change. http://www.geo.ucl.ac.be/LUCC/publications/reportseries/seriesl/lucc.html.
Conservation Recornrnendations