AN ASSESSMENT OF FIRE REGIMES ON DIFFERENT VEGETATION TYPES USING MODIS BURNED AREA PRODUCTS
by
Nokuphila Londiwe P. Buthelezi 209516779
Submitted in fulfilment of the academic requirements for the degree Master of Science in the School of Agriculture, Earth and Environmental Sciences
in the College of Agriculture, Engineering and Science.
University of KwaZulu-Natal, Pietermaritzburg
Supervisor: Prof. O. Mutanga Co-supervisor: Prof. M. Rouget
November 2016
PREFACE
The research contained in this dissertation was completed by the candidate while based in the Discipline of Geography, School of Agricultural, Earth and Environmental Sciences of the College of Agriculture, Engineering and Science, University of KwaZulu-Natal, Pietermaritzburg, South Africa. The research was financially supported by National Research Foundation (NRF) and Durban Research Action Partnership (D’RAP).
The contents of this work have not been submitted in any form to another university and, except where the work of others is acknowledged in the text, the results reported are due to investigations by the candidate.
Candidate
Nokuphila L. P. Buthelezi Signed Date: 14/10/2017
As the candidates Supervisors, We certify the aforementioned statement and have approved this thesis for submission.
Supervisor
Prof Onisimo Mutanga Signed _____________ Date _________
Co-Supervisor Pro Mathieu. Rouget
DECLARATION 1: PLAGIARISM
I, Nokuphila Londiwe Phumelele Buthelezi, declare that:
(i) the research reported in this dissertation, except where otherwise indicated or acknowledged, is my original work;
(ii) this dissertation has not been submitted in full or in part for any degree or examination to any other university;
(iii) this dissertation does not contain other persons’ data, pictures, graphs or other information, unless specifically acknowledged as being sourced from other persons;
(iv) this dissertation does not contain other persons’ writing, unless specifically acknowledged as being sourced from other researchers. Where other written sources have been quoted, then:
a) their words have been re-written but the general information attributed to them has been referenced;
b) where their exact words have been used, their writing has been placed inside quotation marks, and referenced;
(v) where I have used material for which publications followed, I have indicated in detail my role in the work;
(vi) this dissertation is primarily a collection of material, prepared by myself, published as journal articles or presented as a poster and oral presentations at conferences. In some cases, additional material has been included;
(vii) this dissertation does not contain text, graphics or tables copied and pasted from the Internet, unless specifically acknowledged, and the source being detailed in the dissertation and in the References sections.
_______________________
Signed:
Date:
DECLARATION 1: PUBLICATIONS
1) Buthelezi, N.L.P., Mutanga, O., Rouget, M. & Sibanda, M., 2016, ‘A spatial and temporal assessment of fire regimes on different vegetation types using MODIS burnt area products’, Bothalia 46(2), a2148. http://dx.doi. org/10.4102/abc.v46i2.2148A
ACKNOWLEDGMENTS
I am indebted to my family, friends, partner and colleagues for their love, patience and tremendous support.
A number of special acknowledgements deserve specific mention:
My supervisor, Professor Onisimo Mutanga, for his invaluable guidance and believing in me. Most of all thank you for being patient and understand the pressure of completing this thesis in addition to doing my full-time job.
Mbulisi Sibanda, for his continuous support, motivation, advice and constant encouragement.
My manager, Errol Douwes, for giving me time off work and allowing me to set aside time during my work hours for research.
The National Research Foundation and Durban Research Action Partnership for funding my research.
Victor Bangamwabo for sharing some of his ‘advanced’ GIS skills with me.
I would like to extend my gratitude to Menzi Mthethwa, Khaya Mbonyane and Nhle Zuma for their willingness to proofread my work.
National Aeronautics and Space Administration (NASA) for availing the MODIS burned area data products and Landsat 8 OLI images used in this study.
Nomcebo Hlanguze (Nom nom), Ntombi Ngoloyi (Ntomb ntomb), Philisiwe Makhaye, Fadzai Pwiti (Fadzii) for making my first two years of masters memorable and bearable.
Kholosa Magudu and Nomzamo Nxumalo for welcoming me into their homes and for the continous support.
Nokuthula Dubazane, for the late night study sessions and constant encouragement.
TABLE OF CONTENTS
Page
PREFACE ... ii
DECLARATION 1: PLAGIARISM ... iii
DECLARATION 1: PUBLICATIONS ... iv
ACKNOWLEDGMENTS ... v
TABLE OF CONTENTS ... vi
LIST OF TABLES ... viii
LIST OF FIGURES ... ix
CHAPTER 1: INTRODUCTION ... 11
1.1 Study Background ... 11
1.2 Main objective ... 14
1.3 Specific objectives ... 14
1.4 Outline of dissertation/thesis structure ... 14
1.4.1 Fire data validation ... 14
1.4.2 Remote sensing fire activities in KZN grasslands ... 14
CHAPTER 2 FIRE DATA VALIDATION ... 16
A COMPARISON OF THE NEW GENERATION LANDSAT 8 SENSOR TO MODIS BURNED AREA PRODUCTS IN ESTIMATING FIRES IN THE SOUTHERN AFRICAN GRASSLANDS. ... 17
2.1 Abstract ... 18
2.2 Introduction ... 18
2.3 Materials and methods ... 21
2.3.1 Study area description... 21
2.3.2 Remotely sensed data ... 23
2.3.3 Image Processing ... 23
2.3.4 Mapping burned area using Landsat 8 OLI and Field data ... 24
2.3.5 Validation ... 25
2.4 Results ... 25
2.5 Discussion ... 28
2.6 Conclusion ... 30
CHAPTER 3: REMOTE SENSING FIRE ACTIVITIES IN KZN GRASSLANDS USING
MODIS SATELLITE DATA ... 31
A SPATIAL AND TEMPORAL ASSESSMENT OF FIRE REGIMES ON DIFFERENT VEGETATION TYPES USING MODIS BURNED AREA PRODUCTS ... 32
3.1 Abstract ... 33
3.2 Introduction ... 33
3.3 Materials and methods ... 35
3.3.1 Study area ... 35
3.3.2 Fire data derived from satellite imagery ... 37
3.3.3 Data Analysis ... 38
3.4 Results ... 38
3.4.1 Annual burnt area ... 38
3.4.2 Fire Frequency 3.4.3 Fire seasonality ... 41
3.5 Discussion ... 43
3.6 Conclusion ... 45
CHAPTER 4: SYNTHESIS AND CONCLUSIONS ... 47
AN ASSESSMENT OF FIRE REGIMES ON DIFFERENT VEGETATION TYPES USING MODIS BURNT AREA PRODUCTS: SYNTHESIS ... 48
4.1 Introduction ... 48
4.2 Assessing the utility of MODIS data products in mapping burned areas of southern African grasslands ... 48
4.3 Assessing the spatial and temporal trends of fire regimes on different vegetation types using MODIS burnt area products. ... 49
4.4 Conclusions and Recommendations ... 49
5. REFERENCES ... 51
LIST OF TABLES
Table Page
Table 2.1: Landsat 8 OLI images acquired during the fire prone months for comparison with the MODIS burned area products……..………...23 Table 2.2: Validation of MODIS burned area products and Landsat 8 OLI using field derived reference data (Ground truth)………25 Table 2.3: Validation of MODIS burned area products and Landsat 8 OLI using burnt area points from the field derived reference data (Ground truth)……….…26 Table 2.4: Omission and Commission errors derived from validating MCD45A1 (500 m) and Landsat 8 (30 m) burnt areas ... 27 Table 3.1: The spatial extent (ha) of the Ngongoni Veld, KwaZulu-Natal Sandstone Sourveld Grassland, Eastern Valley Bushveld and KZN Coastal Belt……..………..37 Table 3.2: Fire seasonal patterns, highlighting the month of peak fire activity, length of the fire
season (seasonality) and months with least burnt
area.………...………...…………43
LIST OF FIGURES
Figure Page
Figure 2.1: Location of the study site (Ngongoni Veld, KZN SS, Eastern Valley Bushveld and KZN Coastal Belt) ... 22 Figure 2.2: Landsat 8 OLI image in pseudo-natural colour composite based on bands 7, 5 and 3. ... 26 Figure 2.3: An accuracy assessment of MODIS in estimating fire occurrences relative to Landsat OLI. Producer (PA), User (UA) and Overall Accuracies for the years 2013 and 2014 are illustrated on (a and b), respectively, while Commission Disagreement (CD), Agreement (A) and Omission Disagreement (OD) for 2013 and 2014 are illustrated on (c and d)……….………...………...28 Figure 3.1: Location of the study site (Ngongoni Veld, KZN SS, Eastern Valley Bushveld and KZN Coastal Belt)………36 Figure 3.2 Total burnt area (expressed as proportion of total area within each vegetation type) in the (a) KZN Sandstone Sourveld, (b) Ngongoni Veld, (c) Eastern valley Bushveld and (d) KZN Coastal belt over a 10-year period………...39 Figure 3.3: A fire frequency map expressed as the mean fire return interval in 10 years over the KZN Sandstone Sourveld, Ngongoni Veld, Eastern Valley Bushveld and KZN Coastal belt.………40 Figure 3.4: Changes in burnt area from March to September (average over 2004-2013)……41 Figure 3.5: Percentage of the KwaZulu-Natal Sandstone Sourveld, Ngongoni Veld, Eastern Valley Bushveld and KwaZulu-Natal Coastal Belt that burnt in each month (March to September)………42
ACRONYMS
AVHRR Advanced Very High Resolution Radiometer ANOVA One-way analysis of variance
A Agreement
BRDF bi-directional reflectance distribution function (BRDF) CD Commission Disagreement (CD)
EC Error of commission EO Error of omission
GPS Global Positioning System GIS Geographic Information System KZN KwaZulu-Natal
Landsat ETM Landsat Enhanced Thematic Mapper
MODIS Moderate Resolution Imaging Spectroradiometer MIR Middle Infrared
MRT MODIS Reprojection Tool NIR Near Infrared
OA Overall Accuracy
OD Omission Disagreement (OD) OLI Operational Land Imager PA Producer Accuracy RMSE Root Mean Square Error TIRS Thermal Infrared Sensor UA User Accuracies
CHAPTER 1: INTRODUCTION
1.1 Study Background
Understanding and characterising the spatial and temporal fire regimes is essential for improving our knowledge on vegetation species composition (Hardtke et al., 2015, Uys et al., 2004). Fire is both a naturally occurring and human-induced phenomenon that may be beneficial or catastrophic to the ecosystem and human lives (Baudena et al., 2015, Devineau et al., 2010). While fire is deemed to be a necessary occurrence for the health and diversity of some ecosystems, on the contrary, it may cause complete destruction of some ecosystems beyond recovery (Bucini and Lambin, 2002). Fires that occur over lengthy time periods have collectively been identified as fire regimes and are defined by factors such as frequency, severity, intensity, spatial pattern and seasonality (Gill, 1975). Natural fire regimes are often altered by human activities through increased fire ignitions and fire suppression (Bond and Parr, 2010, Bond and Zaloumis, 2016). Furthermore, altered fire regimes in turn impact negatively on the ecosystem by promoting the dominance of alien invasive species and compromising natural resources (Hardtke et al., 2015). Fires also have wide-ranging implications for carbon dynamics and air quality (Bucini and Lambin, 2002). Socio-economic impacts of altered fire regimes may comprise of increased fire frequencies, which directly leads to damage to property, infrastructure and livestock losses, increased risk of soil erosion and risk of run-off and in extreme cases, loss of human life (Barbosa et al., 1999b, Uys et al., 2004). Consequently, there is need to quantify fire patterns especially in areas of biological significance. Mapping and monitoring fires is critical in the implementation of effective management strategies and to equip land managers with the necessary information for implementing regulatory measures (Chu and Guo, 2015, De Araújo and Ferreira, 2015).
Traditionally, information on fire in the grasslands and savanna ecosystems was obtained through tedious, time consuming and expensive methods such as field surveys that are laborious resulting in less detailed hand- drawn fire maps (Mitri and Gitas, 2013, Tian et al., 2005). Technological advances in remote sensing over the years have increased the ability to suit the unique applications needed for fire management (Chu and Guo, 2015, Pereira, 2003, Zhan et al., 2002). This is because remote sensing provides cheap, consistent and unbiased observations of fire activity. Furthermore, it avails urgently required information such as the size, timing, location and spatial extent of the fire, for management purposes (Archibald and Roy, 2009, Laris, 2005).
Various studies have successfully utilised remote sensing in mapping and quantifying fire regimes in different regions using different earth observation sensors, namely, the Advanced Very High Resolution Radiometer (AVHRR), Moderate Resolution Imaging Spectroradiometer (MODIS), Landsat and SPOT (Justice et al., 2002, Hudak et al., 2004, Silva et al., 2005, Archibald et al., 2010, Goodwin et al., 2013, Boschetti et al., 2015). For example, in South Africa, Hudak et al. (2004) used Landsat Thematic Mapper (TM) imagery in conjunction with supervised classification to map burnt areas in the savanna biome. While Archibald et al.
(2010) used the MODIS satellite images to produce a visual interpretation of fire regimes in southern Africa.
In a more recent study, Goodwin et al. (2013) used Landsat TM/ETM+ time series to quantify fire activities in the state of Queensland, Australia. These studies demonstrate the utility of satellite remotely sensed data in mapping burnt areas.
The sensors that have been extensively utilised in mapping burnt areas are AVHRR, Landsat and recently MODIS (Mitri and Gitas, 2013, Pereira, 2003). Each of these sensors has its own advantages and each are coupled with their own major flaws in fire mapping. AVHRR is characterised by a daily temporal resolution (1.1 km spatial resolution and 10-bit radiometric precision), which has traditionally proved to be the most efficient in offering practical means of fire mapping (Mitri and Gitas, 2013). However, the low thermal sensitivity and low resolution of the sensor prevents it from distinguishing the intensity of fires, thus over estimating the burnt area (Pereira, 2003, Mitri and Gitas, 2013). In contrast to AVHRR, the 500 m and 8-day temporal resolution of the MODIS burned area product (MCD45A1) enhances fire detection by emitting thermal energy to characterise and detect fires (Roy and Boschetti, 2009b). Moreover, MODIS overcame the challenges of using AVHRR by providing a trade-off between fire mapping over time and space (Martín et al., 2002). In spite of its moderate spatial resolution, MODIS facilitates time series analysis of burnt area mapping, courtesy of its high temporal resolution, as compared to the other above mentioned sensors.
The establishment of sensors with a finer spatial resolution has greatly improved fire mapping activities appropriate for monitoring purposes (Dwyer et al., 2000). Finer resolution sensors such as QuickBird and IKONOS can detect smaller fragmented burn areas (less than 20 ha) and are able to distinguish between different vegetation types. For instance, IKONOS which boasts a 1 - 3.2 m resolution and 3-days revisit time, opened new frontiers in post fire vegetation mapping (Gillieson et al., 2008). Nevertheless, fine spatial resolution images are very expensive and hence often cover a limited area. In spite of the recent advancement from moderate to fine resolution sensors, moderate spatial resolution sensors such as MODIS have proven their utility in historic mapping of fire activities (Pereira, 2003, Roy and Boschetti (2009a). For instance, Roy and Boschetti (2009a) mapped burnt areas across the southern African region from 2001-2009 using the MODIS data products. Their results illustrated that the high spatial and temporal resolution of the MODIS burned area data is suitable for ecosystem assessment and resource management. In a more recent study, Cardozo et al. (2014) conducted a spatial and temporal assessment of burnt areas in Brazil, from 2001-2011, using MODIS burned area products. The results of their study showed that the improved spectral, radiometric and temporal resolution of MODIS makes it a reliable source of local and regional burnt area data set (Cardozo et al., 2014). Despite its high ability in mapping burnt areas, there is still need to validate MODIS with other fine spatial data products such as Landsat 8 Operational Land Imager (OLI) which have relatively fine spatial resolutions that can optimally detect fire scars of relatively small spatial extents. This is due to the fact that the accuracy of MODIS data products is often unknown, which compromises the integrity of the mapped burnt
areas. Although Landsat has a fine spatial resolution than MODIS, it is a challenging task to use it for mapping burned areas. Landsat satellite images require intensive pre-processing techniques as well as robust algorithms in order to derive accurate burnt area maps. Meanwhile, MODIS burned area products are processed and readily available for quantifying burnt areas and require less computation. Thus, validating MODIS using Landsat satellite data is a critical step towards the production of credible and accurate fire data (Roy et al., 2008). In that regard, it is important to consider the spatial fidelity of remotely sensed data prior to drawing strategies for monitoring and planning of vegetation resources.
The burnt areas are often characterised by ash, bare ground and other physical changes in vegetation (Roy et al., 2008, Boschetti et al., 2015). It is the detection of these physical and spectral changes in vegetation that permits burnt area mapping over time and space (De Araújo and Ferreira, 2015, Roy and Boschetti, 2009a).
Although the earliest remote sensing methods failed to distinguish fire scars from areas exhibiting similar spectral reflectance such as croplands (Csiszar et al., 2003), recent studies have utilised burnt area and active fire mapping methods simultaneously to determine the spatial extent of fires. For instance, Devineau et al.
(2010) used MODIS active fire data in conjunction with burnt area data and noted that small sparsely patched fires were better detected by active data, while, burnt data revealed the large continuous flames that were not detected by the active data. However, the above studies did not compare the inter-annual variability and fire distribution patterns over different vegetation types, which is a critical step in biodiversity management.
Inter-annual variability in fire incidence and burnt area vary between vegetation types (Laris, 2005, Uys et al., 2004). The disparities of fire occurrence amongst vegetation is influenced by numerous physical, biological and cultural factors that include fuel properties, plant structure, micro-climate and topography (Guyette et al., 2002, Laris, 2005). According to Uys et al. (2004), the amount of moisture in individual plant species influences their flammability and survival. For instance, vegetation characterised by high moisture content experiences very low to no fire incidences (Bucini and Lambin, 2002, Hudak et al., 2004, Govender et al., 2006). Also, if fires do occur in plants with high moisture content, they burn at very low intensities (Bond et al., 2003). Similarly, plant communities dominated by fire-resistant, succulent plants, are expected to experience less fire occurrences as these species are generally known to prevent the spread of fire. However, vegetation found in nutrient poor soils with reduced grazing pressure is characterised by high fuel load, hence fires occur more frequently and severely in such areas (Smith et al., 2012). Therefore, it is essential to understand how these parameters vary across different vegetation types, as this will inform area specific fire management and inform policy making.
Essentially, the main challenge is the lack of knowledge regarding the species diversity and fire regimes of KwaZulu-Natal (KZN) vegetation types. This knowledge is critical in allowing quick intervention measures so as to ensure sustainable management, and the continued realization of healthy ecosystems. Furthermore,
mapping the fire regimes of the different vegetation types using MODIS burned area products will enable us to meet the growing demand for fire information in KZN grasslands and inform stakeholders such as eThekwini Municipality on the suitable monitoring and management strategies for grassland ecosystems. It is also invaluable to researchers who aim to understand the impact of human population and land use practices on fire occurrence, and in supplementing existing knowledge in fire patterns.
1.2 Main objective
The overall aim of this study was to validate and assess the fire regimes across different vegetation types in KwaZulu-Natal using MODIS burned area products.
1.3 Specific objectives
To compare the spatial fidelity of MODIS data products in mapping burnt areas in relation to Landsat 8 Operational Land Imager (OLI).
Evaluate the fire regime variations across different vegetation types over a decade, using MODIS burned area data products.
1.4 Outline of dissertation/thesis structure
The dissertation consists of four chapters. One of the papers has been accepted for publication while the other one is in preparation.The two papers that make up this thesis have been presented as separate chapters. This makes each of them to be a separate portion of work that contributes to the overarching research question. In that regard, it is imperative to note that there will be inevitable overlaps or repetitions within the dissertation, as each chapter obtains fundamental principles that feed into the overall objectives and aims of the research.
The chapters of the work are presented in two categories, that is (i) fire data validation and (ii) remote sensing fire activities in KZN grasslands. Chapter one of this dissertation presents the background of the study, the aim and objectives of the study.
1.4.1 Fire data validation
Chapter 2 presents a validation study, where the robustness of MODIS burned area products in mapping burnt areas are evaluated against those derived using Landsat 8 (OLI). Pontius Jr and Millones (2011) accuracy assessment procedure was conducted to assess the magnitude of MODIS data products accuracy based on that of Landsat 8 OLI.
1.4.2 Remote sensing fire activities in KZN grasslands
Chapter 3 focuses on mapping the burnt areas in different vegetation types using MODIS burned area products.
Furthermore, this chapter examines the fire regime trends across different vegetation types from 2004 – 2013.
The last chapter of the dissertation, chapter 4, presents a synthesis highlighting the main findings of this study and the main conclusions drawn.
CHAPTER 2 FIRE DATA VALIDATION
A comparison of the new generation Landsat 8 sensor to MODIS burned area products in estimating fires in the Southern African grasslands.
A typical example of burnt area in one of the grasses in the study region.
2.1 Abstract
Cost-efficient satellite data has been widely used to map the spatial and temporal distribution of fires in resource scarce regions such as southern Africa. However, the accuracy of such data is often unknown, which compromises the integrity of the mapped burnt areas. In that regard, there is need to validate the accuracy of these data products if they are to be used for drawing strategies for monitoring and managing natural resources such as grasslands. This study, therefore, evaluated the mapping accuracy of the cost-free MODIS burned area satellite data products for 2013 and 2014 burning seasons in the grasslands of KwaZulu-Natal, South Africa.
To validate MODIS data, we used independent reference data derived from the new generation Landsat 8 Operational Land Imager (OLI) based on the new accuracy assessment procedure promulgated. A total of 60 ground sampling sites were used in this study in conjunction with Landsat 8 data to validate MODIS burned area products. Results of this study illustrate a high level of agreement (>80% overall accuracy) between the MODIS burned area products and the independent reference data. Meanwhile, Landsat data was also validated by ground collected points yielding an accuracy of 94%. Specifically, MODIS data was validated by ground collected points yielding an accuracy of 87%. These findings suggest that MODIS burned area products (MCD45A1) are an accurate, reliable and cheap data source for mapping burnt areas at a regional scale.
Keywords: Grasslands, Burnt areas; Validation; MODIS; Landsat
2.2 Introduction
Evaluating the accuracy of various spatial data sources available to resource scarce regions, such as southern Africa, is critical for understanding the spatial and temporal distribution of veld fires. This is urgently required for monitoring and management of grasslands especially at a landscape scale. Fires are a global phenomenon that impacts significantly on the environment (Mbow et al., 2000, Bond et al., 2003, McNicol and Silver, 2014). The magnitude of a fire varies spatially and temporally due to the variability in the type, amount and distribution of available fuel (Dwyer et al., 2000, Russell-Smith et al., 2007). Moreover, high fire frequencies result in the release and increase of greenhouse gases such as carbon dioxide into the atmosphere which, in the long run, causes climate variability (Bond and Keeley, 2005, Govender et al., 2006, McNicol and Silver, 2014). Therefore, to derive comprehensive fire monitoring and management practices as well as reduce the emission of greenhouse gases into the atmosphere, there is need for accurate and reliable spatial data sources for mapping fires.
The utility of satellite remotely sensed data has proven to be invaluable as it offers an unprecedented understanding of burnt area mapping at different spatial and temporal scales (Smith et al., 2003, Roy et al., 2005, Roy and Boschetti, 2009a). A number of satellite sensors with diverse ranges of spectral and spatial
resolutions have been used to map burnt areas, because they offer timely and accurate spatial information that is required for long-term fire monitoring (Giglio et al., 2009, Loboda and Csiszar, 2004). However, these earth observation facilities are often subjected to limitations that compromise the integrity of the mapped burnt areas (Cardozo et al., 2014, da Silva Cardozo et al., 2012, Roy and Boschetti, 2009b, Schroeder et al., 2008). These limitations are often influenced by a variety of factors such as; availability of good quality data with optimal spatial and spectral resolutions, efficient mapping algorithms for estimating the spatial extent as well as the distribution of active fires through time (Bucini and Lambin, 2002, Roy and Boschetti, 2009a, Tsela et al., 2014). Sensors with a coarse spatial resolution have been noted to be poor in discriminating burnt areas from other land cover types when compared to those that have fine spatial resolutions (Bucini and Lambin, 2002, Smith et al., 2003). For instance, Silva et al. (2005) compared burnt areas extracted from Landsat (30 m) and SPOT VGT (1 km). Their results showed that the SPOT VGT resolution underestimated the complex, smaller fragmented fire scars. However, the spatial resolution of SPOT VGT was able to detect the larger fire scars.
The limitations presented above are a challenge to burnt area mapping as they introduce error and bias to the spatial extent of derived burnt areas (Boschetti et al., 2015, Roy et al., 2005, Tsela et al., 2014). An example of such bias is the low resolution bias. This occurs when the difference in spatial resolution between high and low resolution data presents inaccuracies (Boschetti et al., 2004, Palomino-Angel and Anaya-Acevedo, 2012).
In that regard, it is imperative to validate the accuracy of satellite remotely sensed data prior to using it for deriving strategies required in the management of grasslands resources.
Validation is a critical step towards the production of credible fire data, as it ensures quality assessment of the product and recognises improvements required on the product (Boschetti et al., 2015, Roy and Boschetti, 2009a, Giglio et al., 2009). Validation is described as the process of assessing the quality and accuracy of a specific type of satellite remotely sensed data by comparing it to independent reference data, which could include independent field data or other remotely sensed data with a finer spatial resolution (Giglio et al., 2009, Justice et al., 2002). The utilisation of classification accuracy assessment statistics further scrutinises the accuracy of remotely sensed data products used. This includes computing producer and consumer accuracies, commission and omission errors as well as the statistical procedure by Pontius and Millones (Bastarrika et al., 2011, Boschetti et al., 2004, Pontius Jr and Millones, 2011). Contemporary literature points out that kappa indices provide information that is dispensable, misleading, difficult to understand, and unhelpful in remote sensing applications (Adelabu et al., 2013, Pontius Jr and Millones, 2011). The procedure founded by Pontius has been recently adopted as an optimal accuracy assessment technique over the flawed and complex Kappa method (Pontius Jr and Millones, 2011). The Pontius method provides a more simple and valuable approach to accuracy assessment, by focusing on two parameters; quantity disagreement and allocation disagreement (Pontius Jr and Millones, 2011). These measure the product’s level of accuracy. In this regard, validation of freely available remotely sensed data such as MODIS burned area products (MCD45AI) is an important step
in burnt area mapping, especially in areas such as southern Africa where data scarcity is a limiting factor in rangeland monitoring.
The MCD45AI are created with a bi-directional reflectance distribution function (BRDF) model approach, which relies on the change in daily surface reflectance (Boschetti et al., 2015). They provide actual burnt area which requires less processing and expertise when compared to other remotely sensed data products. The burnt area data products are cloud-free and boasts of a near-daily revisit time with a spatial resolution of 500 m.
These characteristics of MCD45AI data offer a comprehensive insight into the occurrence and location of the burnt areas which are critical in characterising and understanding fire regimes. Similarly, the daily temporal resolution of MCD45AI allows for long-term burnt area mapping. Nevertheless, it is essential to validate these burnt area data products in order to produce credible and accurate maps.
Field validation provides an insight into the commission errors in the MODIS burned area products. However, errors of omission are difficult to detect in the field because not all the burnt areas are identified (Palomino- Angel and Anaya-Acevedo, 2012). In that regard, reference data derived from higher spatial resolution sources such as Landsat 8 OLI, could be used in conjunction with field data to validate the MODIS burned area products (Roy and Boschetti, 2009a). A number of studies have illustrated success in validating MODIS fire products with high resolution independent data such as Landsat (Archibald and Roy, 2009, Bucini and Lambin, 2002, Devineau et al., 2010, Justice et al., 2002, Roy et al., 2008). For instance, Roy and Boschetti (2009a) validated MODIS fire data products and two other low resolution sensors using Landsat (ETM+) across southern African. The authors noted that generally, all three products had lower errors of commission than omission and that the MODIS product provided higher burnt area mapping accuracies than the other two products (L3JRC, GlobCarbon), which could be attributed to the higher 500 m MODIS spatial resolution.
From the context of southern Africa, attempts to validate MODIS burned area products have been conducted based on Landsat 1-7 Enhanced Thematic Mapper plus (ETM+) scenes. For instance, Loboda and Csiszar (2004) successfully validated MODIS burned area products and AVHRR with high resolution datasets extracted from Landsat/ETM+ imagery. The results demonstrated that MODIS products provide consistent and realistic estimates of burnt area with RMSE equalling 0.9. Similarly, Roy and Boschetti (2009a) conducted a study in South Africa, where they validated three burned area datasets (L3JRC, GlobCarbon, and MODIS) with independent reference data derived from 11 Landsat (ETM+) scenes based on confusion matrices and linear regression. Their results illustrated lower errors of commission, with MODIS providing higher burnt area mapping accuracy (91%). Moreover, Tsela et al. (2014), revealed subtle discrepancies in the accuracy between the MCD45A1 and Landsat 5 (TM) data resulting from spectral variations of vegetation types observed as well as spatial patterns of the burnt areas. Overall, the study results indicated a significant level of agreement between the Landsat independent reference data and the MODIS burned area products (Tsela et
al., 2010, Tsela et al., 2014). These studies were limited by the lack of quality ground control points as well as lower quality satellite data from sensors with poor radiometric sensitivity.
The newly launched Landsat 8 OLI sensor with a resolution of 30 m could provide useful information suitable for discriminating and mapping burnt areas to a better accuracy than its predecessors. Currently, Landsat 8 OLI data has not been fully utilised in detecting burnt areas mostly because the sensor was recently launched.
Landsat 8 OLI has a bigger swath width (i.e. 185 km) as well as improved signal to noise ratio reduction facilities, when compared to its predecessors and other available sensors. These characteristics of Landsat 8 OLI suggest an improvement in radiometric sensitivity which is hypothesised to detect burnt areas more accurately at a landscape scale. Therefore, this makes it a better alternative for validating the MODIS burned area product, although it should be noted that Landsat 8 OLI requires high expertise to process, more computing time as well as robust algorithms to accurately derive burnt areas when compared to the MODIS burned area product. However, to the best of our knowledge, no study has been conducted, so far, to evaluate the magnitude of accuracy of MODIS data products in mapping burnt areas in the southern African grasslands, in relation to the improved Landsat 8 OLI and independent field data. This study, therefore, seeks to assess the accuracy of MODIS data products in mapping burnt areas across different types of southern African grasslands in relation to that of Landsat 8 OLI and field data based on the Pontius and Millones (2011) accuracy assessment procedure.
2.3 Materials and methods 2.3.1 Study area description
This study was conducted across four grassland types in the KwaZulu-Natal province, South Africa (S29◦ 58`
4.79``, E30◦ 33` 17.99``). The grassland vegetation types considered in this study are Ngongoni Veld, KwaZulu-Natal Sandstone Sourveld, Eastern Valley Bushveld and KwaZulu-Natal Coastal Belt (Figure 2.1).
The study area receives about 800 mm to 1200 mm of precipitation per year. In summer, the temperatures range from 27ºC - 30ºC, whereas in winter, temperatures drop to between 4.7ºC - 15.1ºC.
Figure 2.1: Ngongoni Veld, KwaZulu-Natal Sandstone Sourveld, Eastern Valley Bushveld and KwaZulu- Natal Coastal Belt vegetation types in KwaZulu-Natal, South Africa.
2.3.2 Remotely sensed data
For this study, burnt area maps derived from MODIS imagery were validated with burnt area maps derived from Landsat 8 (OLI). The MODIS (MCD45A1) satellite data product covering the study area was assessed in the current study. The MCD45A1 is a monthly burnt area product produced at 500 m spatial resolution. The product utilises a bi-directional reflectance model to detect and map the spatial extent of burnt areas as well as recording the exact date of burning as explained in Roy et al. (2005).
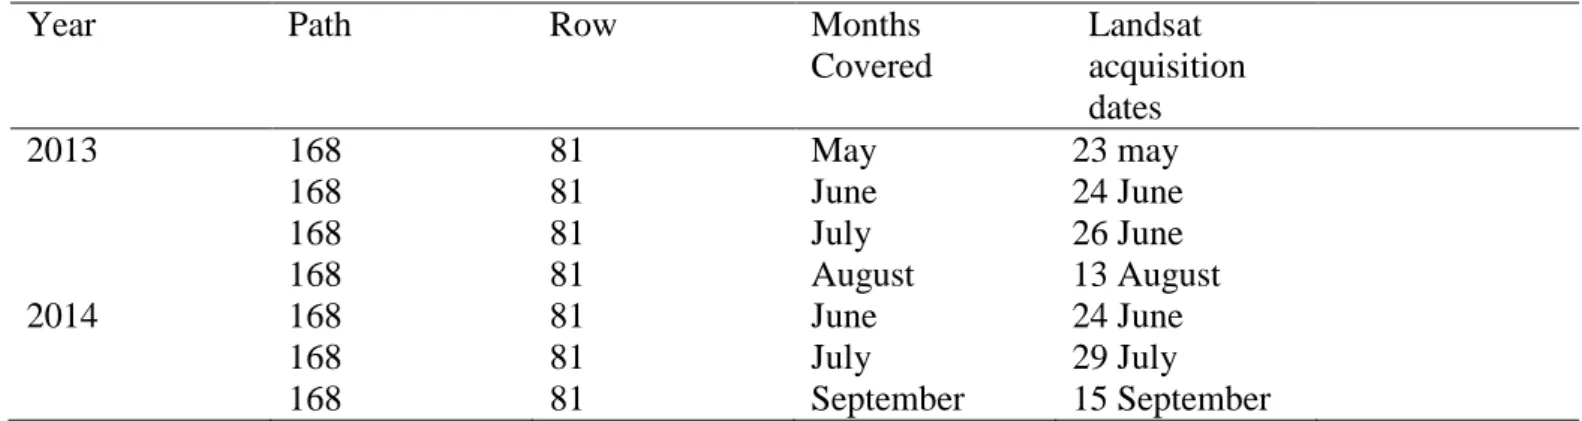
Independent reference data derived from Landsat 8 (OLI) was used to validate the mapping capability of the MCD45A1 considering its relatively finer spatial resolution of 30 m. The Landsat 8 OLI sensor comprises of two instruments – the Thermal Infrared Sensor (TIRS) and the Operational Land Imager (OLI). These instruments provide global spatial coverage of 30 × 30 m for all the bands (1-7 and 9) except for the panchromatic band 8 which has a spatial resolution of 15 m. While the spectral bands of Landsat 8 OLI are similar to those of Landsat 7, the former has two additional bands (band 9 for cirrus observation and band 1 for coastal studies as well as an improved signal-to-noise radiometric ratio). The improvements in signal to noise ratio makes Landsat 8 OLI suitable for detecting and mapping burnt areas. A total of seven Landsat 8 scenes covering parts of the 2013 and 2014 fire prone months were obtained for comparison with the MODIS burned fire products (Table 1). Landsat 8 OLI images covering this period were specifically selected because of minimal cloud coverage. These images were geometrically corrected using control points measured using a hand held Global Position System (GPS) with sub meter accuracy based on a first order polynomial function and nearest neighbour resampling technique resulting in a root mean square error that was less than 0.5 pixels.
Table 2.1: Landsat 8 OLI images acquired during the fire prone-cloud free months for comparison with the MODIS burned fire products.
Year Path Row Months Covered
Landsat acquisition dates
2013 168 81 May 23 may
168 81 June 24 June
168 81 July 26 June
168 81 August 13 August
2014 168 81 June 24 June
168 81 July 29 July
168 81 September 15 September
2.3.3 Image Processing
The MODIS Reprojection Tool (MRT) was used to convert the MCD45A1 products to a GeoTIFF which is recognized by ArcGIS and ERDAS IMAGINE. The images were resampled and clipped to the study area
using ArcGIS. For pixel by pixel comparison of MODIS and Landsat 8 OLI images, the former was downscaled using the nearest neighbour resampling technique in a GIS to the latter’s spatial resolution of 30 m.
2.3.3.1 Identifying Individual Fires from MODIS burned area products
The MCD45A1 file consisted of eight data layers. Each of the files was a raster layer represented by a specific code. The burnt areas were presented by 1 to 366, while a code of 0, 900, 9999 and 10000 indicated the insignificant values such as unburnt areas, snow, water, or lack of data (Archibald and Roy, 2009). The insignificant pixels were removed from the dataset using a raster calculator. This was done to ensure that only the burnt areas were maintained (Archibald and Roy, 2009). After the burnt pixels were isolated, the raster files were converted to monthly vector files, each with their respective Julian dates. The Modified Fill Algorithm developed by Archibald and Roy (2009) was used to identify individual fires from the burnt areas.
The algorithm uses the Julian dates to group neighbouring pixels that burned in 8 days/1 km and gives them a unique identity as in Archibald et al. (2010). Polygons that had the same identity were merged to form a single individual fire. The algorithm was applied throughout the dataset until all the individual fires were identified.
2.3.4 Mapping burnt area using Landsat 8 OLI and Field data
The burnt areas were manually extracted from the Landsat imagery, as it was easier to delineate the fire scars through visual interpretation (Roy et al., 2005, Bastarrika et al., 2011). To distinguish the burnt areas from unburnt areas on the Landsat 8 OLI satellite images, band combinations (colour composites), shape, context, texture and tone were used to discriminate the fire scars on screen in a geographic information system (GIS), after conducting preprocessing procedures detailed in Dube and Mutanga (2015). Specifically, the pseudo natural colour composite based on Landsat 8 OLI bands 7-5-3 was used to discriminate the fires scars from other land cover types on the images. The band combination is based on the visible (3), near-infrared (NIR) (5) and middle infrared (MIR) (7) regions of the electromagnetic spectrum covered by Landsat 8 OLI. This pseudo natural composite reduces the effects of identical spectral changes and clearly depicts burnt fire scars (Figure 2.2).
In order to understand the magnitude of agreement between MODIS and Landsat in mapping burnt areas, the study first evaluated the magnitude of agreement between field derived reference data and MODIS satellite data products as well as field derived reference data and Landsat 8 OLI derived burnt areas. MODIS burned areas products and burnt area maps deduced from Landsat 8 OLI imagery were acquired between the 24th to the 27th September 2014, which coincided with the field survey. In the field, 60 points were collected using a GPS to an accuracy of less than a meter. The points were collected in different types of land surfaces, with
more points collected in the areas that represented burnt area surfaces. Field points collected from the field were compared with fire maps derived from MODIS burned area products and Landsat 8 OLI. Confusion matrices illustrating the overall mapping accuracy were derived (Table 2.4).
2.3.5 Validation
During the validation process, burnt areas identified based on the MODIS satellite data products were overlayed with the burnt areas derived using Landsat 8 OLI images. Confusion matrices were then derived and used to compute the magnitude of accuracy based on the Pontius Jr and Millones (2011) accuracy assessment procedure. In the validation process of MODIS burned area products the allocation of agreement and allocation of disagreements were used (Pontius Jr and Millones, 2011). Subsequently, the Overall (OA), Producer (PA) and User Accuracies (UA), were used to derive more insight on omission and commission errors. All the results extracted from the classification accuracy statistics were then graphically presented.
2.4 Results
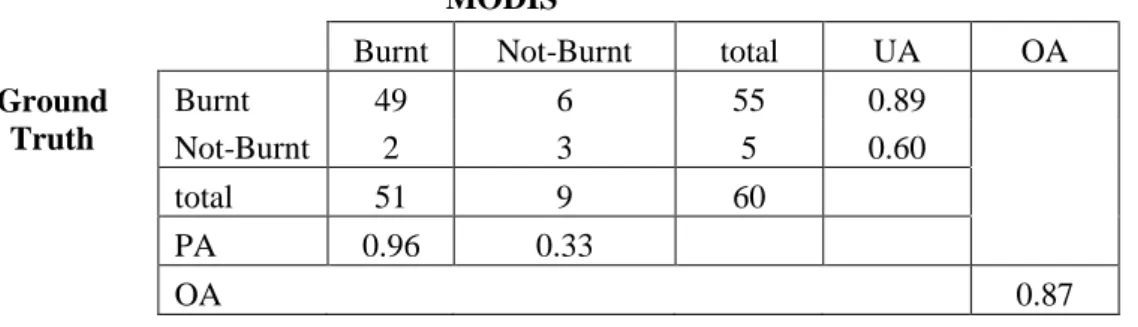
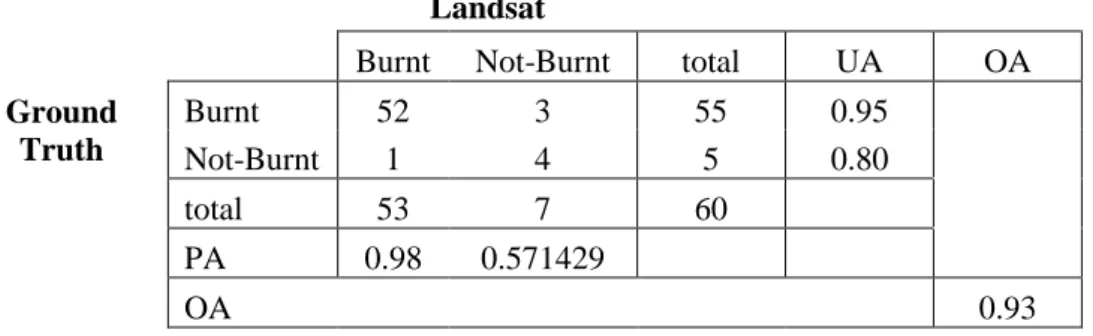
Table 2.2 and 2.3 presents the validation of burnt area maps derived from MODIS and Landsat 8 (OLI) with burnt area points from the field. Of the 55 points that were collected on burnt area surfaces, only 6 of the points did not correlate with the burnt area maps derived from MODIS. Specifically, 87% mapping accuracy was achieved by MODIS imagery whereas Landsat yielded a 93% overall accuracy when compared to field data. In that regard, independent reference image was reliable and suitable for utilisation in validating MODIS burned area products. The points that did not correlate with burnt areas on the ground could be attributed to old burnt or faded fire scars that could not be detected by the Landsat imagery or burnt areas that were too small to be detected by MODIS.
Table 2.2: Validation of MODIS burned area products using field derived reference data (Ground truth).
MODIS
Burnt Not-Burnt total UA OA
Ground Truth
Burnt 49 6 55 0.89
Not-Burnt 2 3 5 0.60
total 51 9 60
PA 0.96 0.33
OA 0.87
Table 2.3: Validation of Landsat 8 OLI using burnt area points from the field derived reference data (Ground truth).
Landsat
Burnt Not-Burnt total UA OA
Ground Truth
Burnt 52 3 55 0.95
Not-Burnt 1 4 5 0.80
total 53 7 60
PA 0.98 0.571429
OA 0.93
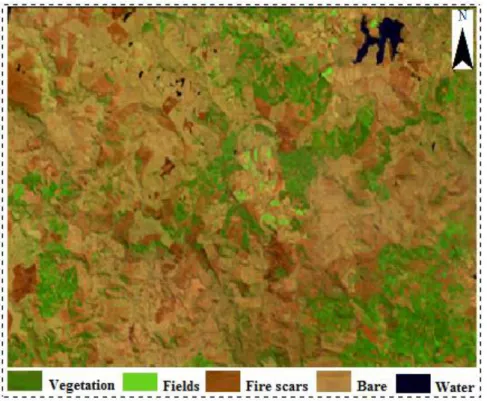
Figure 2.2 shows the characterisation of fire scars, based on a Landsat 8 OLI image in pseudo-natural colour composite (i.e. Bands 7, 5 and 3). It can be observed, from the image, that burned areas appear as a reddish- brownish colour and can be easily delineated from the other land cover types.
Figure 2.2: Landsat 8 OLI image in pseudo-natural colour composite based on bands 7, 5 and 3.
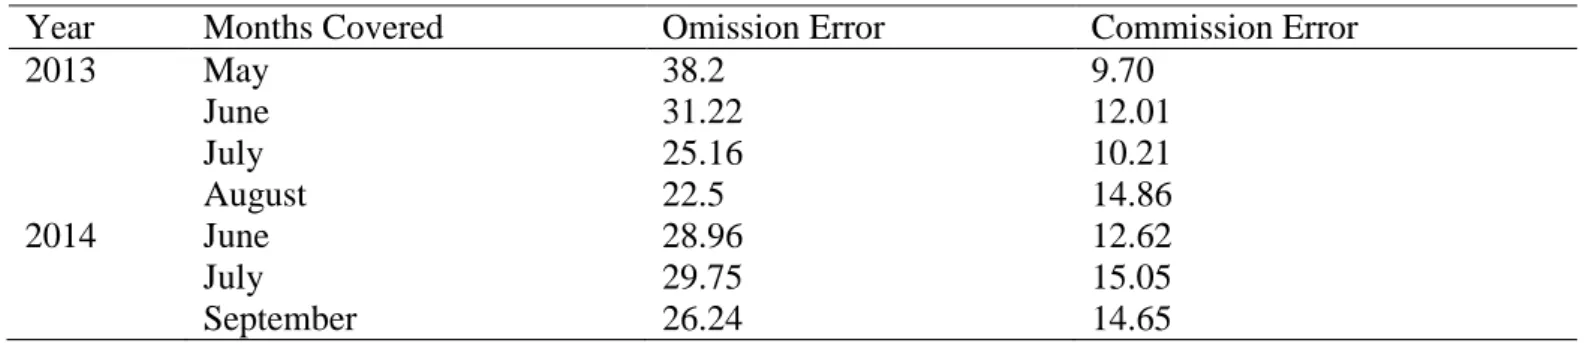
Generally, the commission errors of the burnt areas were lower than the omission errors for all the burning months across the two years (Table 2.4). The late burning months - July and August in both years had high commission values of 15.05 and 14.86, respectively when compared to the other months. While the early period of the burning season yielded slightly lower commission values (May - 9.70%). The month of May yielded a higher omission error (38.2%) in comparison to the late burning months (August – 22.5%).
Table 2.4: Omission and Commission errors derived from validating MCD45A1 (500 m) against the Landsat 8 (at 30m) burnt area reference data.
Year Months Covered Omission Error Commission Error
2013 May 38.2 9.70
June 31.22 12.01
July 25.16 10.21
August 22.5 14.86
2014 June 28.96 12.62
July 29.75 15.05
September 26.24 14.65
Figure 2.3 (a) also illustrates a consistent pattern of producer (PA) and user accuracies (UA) across the fire prone months. Generally the PAs were lower than the UAs. In 2013, the overall accuracy increased from 70%
in May to about 81% in August (Figure 2.3 (a)). A slight deviation was noted in the month of May 2013 where PA (75) was slightly higher than the user accuracy (62). In 2014 (Figure 2.3 (b)) the overall accuracy was high (75 - 80%), however, there was a slight decrease in overall accuracy towards the month of September. Figure 2.3 (c and d) shows the allocations of agreements and disagreements derived using the Pontius and Millone’s (2011) procedure. Generally high allocations of agreement can be observed across all the burning months in 2013 and 2014. Overall, the magnitude of accuracy in detecting burned areas illustrated by MODIS fire products was comparable to that of the newly launched Landsat 8 OLI data.
2013 2014
(a) (b)
Figure 2.3: An accuracy assessment of MODIS in estimating fire occurrences relative to Landsat 8 OLI.
Producer (PA), User (UA) and Overall Accuracies for the years 2013 and 2014 are illustrated in (a and b), respectively, while Commission Disagreement (CD), Agreement (A) and Omission Disagreement (OD) for 2013 and 2014 are illustrated on parts c and d.
2.5 Discussion
This study sought to evaluate the magnitude of MODIS data accuracy in detecting and mapping fire in relation to Landsat 8 OLI and field data. Results of this study demonstrated a high level of agreement between burned areas derived from MODIS burned area products and field data (87%) as well as MODIS and Landsat 8 OLI (70 - 80%), in both the 2013 and 2014 burning months. The user accuracies ranged from 70-90%, which demonstrated that the area identified as burnt areas by MODIS, corresponded with the actual burned areas derived from Landsat 8 OLI maps thus exhibiting good accuracy by the MODIS burned fire products. These findings suggest that MODIS burned area products can map fires across the South African grasslands with optimal accuracies. The high allocation of agreement between fires scars mapped from MODIS and those mapped using Landsat 8 OLI, particularly in the fire prone months of June to August, indicates the robustness of the spatial and spectral settings of MODIS data in detecting and mapping burned areas. Furthermore, improvements in signal to noise reduction in Landsat 8 OLI coupled with efficient data pre-processing procedures of MODIS burned products could explain the high correlation between the two data sets. This includes intensive atmospheric correction for clouds and other noise as well as comprehensive geolocation and calibration procedures which makes both data sets to be sensitive in detecting and mapping burnt areas.
However, the 1-day temporal resolution of MODIS makes it a better source of burnt area data when compared to Landsat with a 16 day temporal resolution. The near-daily repeat cycle of MODIS products indicates that the satellite product has strong potential for a near real-time fire observation compared to Landsat. Therefore,
(c) (d)
MODIS can be used to reconstruct a long time series of fire regime as well as provide good burned area estimates. Generally, MODIS emerged as a more consistent and dependable source of data, as it provided access to a complete set of burned area data for the entire 10-year study period. Furthermore, MODIS burned area products do not require much expertise, time and costs in deriving burned areas as opposed to Landsat imagery. These findings are consistent with those of Giglio et al. (2009) and Roy and Boschetti (2009a) who also attained high accuracies in validating the MODIS burned area products with reference data derived from Landsat 7 ETM. Meanwhile, Roy and Boschetti (2009a) attributed the high accuracy attained in their study to the quality of the algorithms used to generate the MODIS burned area products, compared with L3JRC and GlobCarbon. Also, the study by Giglio et al. (2009) which validated MODIS burned and active fire data with LandsatTM/ETM+, demonstrated that MODIS yielded a high burned area estimate (RMSE = 0.9), due to the high geolocation accuracy of the product and the temporal resolution which is suitable for sampling daily fire cycles. The high accuracies obtained by Giglio et al. (2009) could be attributed to the fact that they used burned area products coupled with active data sets which were not considered in this study.
Generally, results of this study exhibited high omission errors (23 – 38%) than commission errors (9 - 17%) over the study region. This could be attributed to the fact that burned area data developers decrease commission errors at the expense of increasing the omission errors (Bastarrika et al., 2011, Cardozo et al., 2014, Roy and Boschetti, 2009a, Tsela et al., 2014). This is because the commission errors are recognised as a component of the product quality assessment, and also, this is done mainly to avoid field verification in areas where fires did not previously occur. This aforementioned pattern has been observed in a number of validation studies (Bastarrika et al., 2011, Cardozo et al., 2014, Roy and Boschetti, 2009a, Tsela et al., 2014). For instance, Roy and Boschetti (2009a) suggested that MODIS burned area products omit about 25% of burnt area from high resolution satellites in South Africa.
In this study, a high omission error (±38) was particularly displayed in May 2013. These results may be attributed to a number of factors. Firstly, the 500 m spatial resolution of the MODIS product promotes the detection of large burn scars, especially in the savanna. This consequently limits the size of the smallest burned area that can be detected by MCD45A1, thus resulting in omission errors. The findings of this study are similar to those of Cardozo et al. (2014) who illustrated high correlation between MODIS and Landsat products (between 81% and 96%) in areas dominated by large fire scars. Furthermore, Tsela et al. (2014), noted a 100%
fire detection in areas of more than 500 ha in the savanna biome. The results of Tsela et al. (2014) conclusively showed that MCD45A1 provided relatively accurate data for mapping for both small and large area burns when compared to other MODIS products in the different grassland sites.
Furthermore, the high omission errors recorded in May 2013 may be attributed to high moisture content which decreases the fuel load resulting in low occurrence of fires (Bucini and Lambin, 2002, Bond and Keeley, 2005,
Govender et al., 2006). The low intensity fires that occur during the early fire season result in the fragmentation of burned areas. Our results in this study are in agreement with those of Laris (2005) who also noted high omission errors by MODIS burned area products in the early fire season due to small or fragmented burned areas.
Generally, the commission errors were low throughout the burning months, with a slight increase in August 2014 and July 2016. This overestimation may be attributed to the algorithm classifying features (bare areas/dark soil/urban areas) that are spectrally similar to burned areas, as burned areas (Boschetti et al., 2004, Bastarrika et al., 2011). These results concur with those of Bastarrika et al. (2011) and Boschetti et al. (2004) which illustrated that moderate spatial resolution sensors often confused burned areas with features that had similar spectral characteristics such as cleared unburned forest. Under such conditions, the MODIS product will often map areas that are bare, cleared, or dark as burned areas.
2.6 Conclusion
This study evaluated the utility of MODIS burned area products in mapping burned areas in the southern African grasslands. Based on our results, we conclude:
That the freely available MODIS burned area products provide accurate, timely and credible fire data at regional scales.
We also conclude that MODIS is a better data source than Landsat despite the limited spatial resolution of MODIS when compared to Landsat.
These findings suggest that MODIS burned area products can provide a comprehensive understanding of the spatial and temporal distribution of veld fires for grassland monitoring and management purposes, especially at a landscape scale. Nevertheless, the limitations that arise from using MODIS burned area products, such as its inability to detect small fragmented burned areas as well as the spectral similarity of burned areas with that of dark soils, bare land or cleared areas should not be overlooked. Therefore there is need for improving MODIS data products processing to ensure that accurate fire data is available for effective ecosystems monitoring at a landscape scale. Despite these plausible results, there is still need to map and quantify the spatial extent of burnt areas across the different grasslands types such as those of KwaZulu-Natal so as to enhance the planning strategies for managing these natural resources.
CHAPTER 3: REMOTE SENSING FIRE ACTIVITIES IN KZN
GRASSLANDS USING MODIS SATELLITE DATA
A SPATIAL AND TEMPORAL ASSESSMENT OF FIRE REGIMES ON DIFFERENT VEGETATION TYPES USING MODIS BURNED AREA PRODUCTS
This chapter is based on a paper :Buthelezi, N.L., Mutanga, O., Rouget, M. and Sibanda, M., 2016. A spatial and temporal assessment of fire regimes on different vegetation types using MODIS burnt area products. Bothalia-African
Biodiversity & Conservation 46(2), 1-9.
3.1 Abstract
The role of fire in maintaining grassland ecosystems has been widely recognised. However, its effect in KwaZulu-Natal grasslands is still rudimentary. In that regard, understanding fire regimes of different vegetation types is a critical step towards the development of effective management strategies that are specific to each vegetation type. This study, therefore, assessed the effect of different vegetation types on fire regimes in KwaZulu-Natal using moderate resolution imaging spectroradiometer (MODIS) burnt fire products. Ten years of fire data for four different vegetation types (Ngongoni Veld, KwaZulu-Natal Sandstone Sourveld, Eastern Valley Bushveld and KwaZulu-Natal Coastal Belt) was extracted from the MODIS products and used as a basis to establish three parameters: annual burnt areas, fire season and fire frequency. The total burnt area within each vegetation type over the 10-year period was quantified. The findings of this study showed that KwaZulu-Natal Sandstone Sourveld had a high-burnt area of 80% in 2009 with KwaZulu-Natal Coastal Belt having the least burnt area of less than 5%. The Ngongoni Veld and KwaZulu-Natal Sandstone Sourveld had the highest fire frequency, while the coastal region had low fire frequencies. Results showed high fire prevalence during the late period of the dry season (which extends from June to August) across all the vegetation types. This study highlights the potential of remotely sensed data in providing a comprehensive view of fire patterns in different vegetation types.
Keywords: fire regimes; burnt area; MODIS; vegetation types
3.2 Introduction
Characterising the spatial and temporal regimes of fire are essential for improving our knowledge and management of fire, biodiversity and vegetation species composition (Barbosa et al., 1999a, Uys et al., 2004).
In a savanna and grassland ecology, fire plays an important role of maintaining the health and diversity of ecosystems in these biomes (Bond et al., 2003, Hudak et al., 2004). Specifically, fire is critical in the savannas for maintaining the grass-tree harmony that characterizes this biome (Mbow et al., 2000, Bond et al., 2003).
According to Bond et al. (2003), most fires that occur in sub-Saharan grasslands and savanna are a result of anthropogenic activities. Due to limited urbanisation, the majority of rural communities regularly burn their landscapes for a variety of purposes ranging from hunting, increasing croplands and grasslands productivity for livestock as well as clearing paths around homesteads (Bond et al., 2003, Laris, 2005). However, because of enormous spatial and temporal scales, their impacts range from local to global implications. Continuous burning of landscapes, for example, may result in excessive removal of vegetation, which in turn will reduce the soil stability, while increasing soil erosion susceptibility (Cardozo et al., 2014, Laris, 2005). Furthermore, the release of voluminous amounts of carbon increases greenhouse gases that largely contribute to the global
climate change (Bucini and Lambin, 2002). Considering these reasons, priorities and efforts by the international research platforms and programs have been directed towards developing accurate and efficient fire mapping and monitoring systems.
The challenge that has been hindering the accurate and efficient mapping of fires has been the lack of near real-time spatial data, covering lager spatial scales for monitoring purposes. Earth observation facilities offer an alternative data source that is now widely used in monitoring fires and vegetation changes at various scales (Govender et al., 2006). Remotely sensed datasets provide relatively cheap, consistent and unbiased observations of fire activities. It also provides critical characteristics of fire regimes, such as timing, location and spatial extent (Archibald and Roy, 2009, Laris, 2005). The remotely sensed burned area data products that have been used to map fire scars over large areas include Advanced Very High Resolution Radiometer (AVHRR), L3JRC, Globcarbon, Landsat and MODIS burned area products (Mitri and Gitas, 2013, Pereira, 2003).
The MODIS burned area products provide an improved spatial resolution of 500 m, better spectral resolution and a high temporal resolution compared to the more traditional sensors (Bastarrika et al., 2011, Martín et al., 2002, Roy and Boschetti, 2009a). Furthermore, the temporal resolution (1-2 days) of MODIS makes it a better source of burnt area data when compared to other sensors such as Landsat with a 16 day temporal resolution (Tsela et al., 2014). MODIS also allows for a long time series of burnt area mapping, courtesy of its high temporal resolution compared to other sensors. Thus, MODIS burned area products can map fire regimes at better accuracy and provide temporal trends as well as the spatial extent of burned area in a given region (Archibald and Roy, 2009). Previous studies have employed MODIS satellite data products to map burnt areas (Devineau et al., 2010, Levin and Heimowitz, 2012, Pereira, 2003). For instance, Pereira (2003) used MODIS to detect and map burnt area in tropical savanna with high accuracies. In West Africa, Devineau et al. (2010) conducted a savanna fire regime assessment using MODIS fire products and examined their relationship to land cover change. Lastly, Levin and Heimowitz (2012) mapped the spatial and temporal patterns of Mediterranean wildfires using MODIS satellite data.
Although the previous studies have successfully mapped fires in savanna and grassland ecosystems using MODIS products, the main challenge in monitoring fires at regions such as the sub-Saharan Africa is that portions of land that are subjected to burning vary across different ecosystems (Archibald et al., 2009). The response of a particular ecosystem to the occurrence of fire as well as the impact on it is determined by the fire duration, intensity, season and frequency (Bond and Parr, 2010, Guyette et al., 2002). Furthermore, the plant structure (biological), micro-climate (climatic) and topography (physical) influence plant recovery period as well as the ability of certain species to resist fires (Guyette et al., 2002, Laris, 2005). These variations trigger different responses between and within plant species. For instance, grasslands which are characterised
by fine dry fuels will experience higher burning than deciduous vegetation with a high moisture content (Barbosa et al., 1999b, Govender et al., 2006, Uys et al., 2004). The moisture content depends on the seasonal patterns of rainfall, where vegetation types that receive rainfall throughout the year will experience less burning than vegetation types experiencing high summer rainfall and long dry winter periods (Archibald et al., 2010, Laris, 2005).
KwaZulu-Natal (KZN) is an example of an area with high summer rainfall and long dry winter periods. The majority of the vegetation types in KZN have been labelled as endangered because they are being transformed by human activities such as intense fire, grazing and urbanisation (Mucina et al., 2005b). Despite the small portion under conservation and management, knowledge about the fire regimes in KZN vegetation types is still rudimentary. Altered fire regimes threaten the existence of endemic species in various vegetation types, particularly the drier regions that are more susceptible to frequent fires (Archibald et al., 2009). Currently, 2.5% of South African grasslands are formally conserved, while more than 60% are now permanently transformed. In that regard, it is important to map and understand the historical fire regimes across the different vegetation types to achieve proper management strategies specific to a certain vegetation type.
In this study, we therefore evaluate the fire regime variations across different vegetation types over a decade, using MODIS burned area data products. Specifically, ten years of fire data for four different vegetation types (Ngongoni Veld, KwaZulu-Natal Sandstone Sourveld, Eastern Valley Bushveld and KwaZulu-Natal Coastal Belt) was extracted from the MODIS products and used as a basis to establish three parameters: annual burnt areas, fire season and fire frequency.
3.3 Materials and methods 3.3.1 Study area
The study area is located in the Eastern part of the KwaZulu-Natal Province situated within five municipalities, S29 58 4.79, E30 33 17.99. The area is characterised by a variety of vegetation types, but for the purpose of this study, emphasis was placed on only four types. These are the Ngongoni Veld, Eastern Valley Bushveld, KZN Coastal Belt and KZN Sandstone Sourveld (Figure 1). These vegetation types were selected because their heterogeneity provides a fire-prone environment that influences fire patterns and behaviour (Bucini and Lambin, 2002). The region experiences hot summers and cool dry winter months, which promote the occurrence of fire, at the same time maintaining the integrity of the different vegetation types. The region receives precipitation ranging from 800 to 1200 mm annually. The maximum temperatures in summer may range from 27C to 32C, with winter temperatures dropping to between 4.7C and 15.1C.
Figure 3.1: Location of the study site and the spatial extent of the Ngongoni Veld, KZN Sandstone Sourveld Grassland, Eastern Valley Bushveld and KZN Coastal Belt vegetation types.
Table 3.1: The spatial extent (ha) of the Ngongoni Veld, KZN Sandstone Sourveld Grassland, Eastern Valley Bushveld and KZN Coastal Belt.
Vegetation type Area (ha)
Ngongoni Veld 189,973
KwaZulu-Natal Coastal Belt 202,707
KwaZulu-Natal Sandstone Sourveld 56,103
Eastern Valley Bushveld 99,180
KZN Coastal Belt Grassland occurs at very low elevations (20–450 m) and is dominated by Themeda triandra.
It is classified as Endangered (Mucina et al., 2005a). Ngongoni Veld is dominant in low elevation areas (400–
900 m). This veld is dominated by Aristida junciformis and wooded vegetation in higher altitudes. This vegetation type is also classified as endangered with less than 1% under conservation. KZN Sandstone Sourveld occurs between 500 and 1100 m. This species-rich grassland is also characterised by Proteaceae and shrubs (Mucina et al., 2005a). The grassland is endangered as much of its original extent has been transformed by human activities. The Eastern Valley Bushveld occurs at high elevations, ranging from 100 to 1000 m. Fire tends to be less abundant in this vegetation compared to other areas because species in this vegetation type tend to retain more moisture in their tissues in the dry season making them less susceptible to fire damage (Mucina and Rutherford, 2006). Savanna woodlands and succulents flourish in this vegetation community.
The vegetation is the least threatened but only 0.8 % is formally conserved (Mucina et al., 2005a). This is because the Eastern Valley Bushveld occurs in areas less suitable for development and is subjected to slow habitat transformation compared to the other vegetation types.
3.3.2 Fire data derived from satellite imagery
MODIS (MCD45A1) burnt area data sets covering a period of 10 years (2004–2013) were used to map fires in the above-mentioned vegetation types. The MODIS burnt area data sets have a temporal resolution of 8 days and spatial resolution of 500 m covering the period from 1 April 2001 till the present day (Roy et al., 2005). The sensor estimates the exact date of the fire and provides the location of fires (Roy et al., 2005).
Furthermore, the accuracy assessment study conducted showed that MODIS can successfully be utilised to map burnt areas across local and regional scales.
The Modified Fill Algorithm developed by Archibald and Roy (2009) was used to identify individual fires from the burnt areas. The algorithm uses the Julian dates to group neighbouring pixels that burnt in 8 days/1 km and gives them a unique identity as in Archibald et al. (2010). Polygons that had the same identity were dissolved to form a single individual fire. The algorithm was applied throughout the data set until all the