Bidens pilosa extract and sub-fractions induce adipogenesis and exert glucose uptake in 3T3-L1 adipocytes
BY TOLO MM
MASTER OF SCIENCE In
BIOCHEMISTRY In the
Faculty of science and Agriculture (School of molecular and life sciences)
at the
University of Limpopo 2020
Supervisor: Prof M.P. Mokgotho Co-supervisor: Prof L.J. Mampuru Dr V.P. Bagla Dr K.W Poopedi
i
DECLARATION
I Mantwampe Motse Tolo declare that the dissertation under the title Bidens pilosa extract and sub-fractions induce adipogenesis and exert glucose uptake in 3T3-L1 adipocytes is my own work in design and execution, that it has not been submitted for any degree or examination in any other University and that all the sources I have quoted or used have been duly acknowledged.
Signature:
Date : 01/12/2020
ii
DEDICATION
I would like to dedicate this study to my family for their endless support, more especially to my late aunt Enicah Mantsho Rankwe who passed on after suffering from diabetes and lastly to everyone out there battling with diabetes.
iii
ACKNOWLEDGEMENTS
I would like to acknowledge the people and institutions listed below for their contributions to the success of this work:
• The Almighty God for giving me the strength, wisdom, courage and being with me throughout this journey. His everlasting love, grace and favours never cease to amaze me.
• My supervisors Prof M.P. Mokgotho for his guidance and supervisory rules.
• My co-supervisor Prof L.J. Mampuru for his academic advices, encouragement, scientific inputs and critics.
• My co-supervisor Dr V.P. Bagla for his laboratory guidance, proof reading, scientific writing and constructive feedback.
• Dr K.W. Poopedi for her constant support, encouragement, laboratory assistance and guidance, scientific inputs and proofreading my work.
• A special thanks to the South African Medical Research Council (SAMRC) for providing me with financial support, giving me an opportunity to proceed with my study until completion.
• My parent Mr and Mrs Tolo for believe in me, constant support, unconditional love throughout the study.
• My siblings Kgopolo and Pebetsi for their constant love and always encouraging me to never give up.
• A big thanks to my colleagues and friends Ms Raboshakga, Mr Moloantoa and Mr Njanje for their time, teamwork, encouragement, scientific knowledge and contribution throughout the study.
• All the staff members of the BMBT (Biochemistry, Microbiology and Biotechnology) for their continual support and assistance.
“The secret of getting ahead is getting started” ~ Mark Twain
iv
TABLE OF
Contents
LIST OF ABREVIATIONS ... i
Poster presentations ... iv
Oral presentations ... iv
ABSTRACT ... v
Chapter 1: Introduction ... 1
1.1 Diabetes mellitus ... 1
1.2 Prevalence of diabetes mellitus ... 1
1.3 Classification of diabetes mellitus ... 2
1.3.1 Type I diabetes mellitus ... 2
1.3.2 Type II diabetes mellitus ... 2
1.3.3 Gestational diabetes mellitus ... 3
1.4.1 Carbohydrates digestion enzymes ... 4
1.5 Glucose metabolism and regulation ... 4
1.6 β-cell hormones ... 5
1.7 Glucose uptake and transport in skeletal muscle and adipose tissue ... 6
1.8 Complications of diabetes mellitus ... 7
1.8.1 Microvascular disease complications of diabetes. ... 7
1.8.1.2 Diabetic retinopathy ... 7
1.8.1.2 Diabetic nephropathy ... 8
1.8.2 Protein glycation and its implications in diabetic complications ... 9
1.9 The relationship between obesity and diabetes... 9
1.10 Macronutrient intake and inflammation ...10
1.12 Diagnosis of diabetes mellitus ...12
1.12.1 Fasting and 2-Hour Plasma Glucose ...12
1.13 Treatment and management of diabetes mellitus ...12
1.13.1 Non-pharmacological management of diabetes mellitus ...13
1.13.1.1 Physical activity therapy ...13
1.13.1.2 Nutrition therapy ...13
1.13.2 Pharmacological therapies...14
1.13.2.2 Oral therapies ...14
v
1.14 Current antidiabetic drugs and their shortcomings ...15
1.14.1 Biguanides ...15
1.14.2 Sulfornylureas ...16
1.14.3 Thiazolidinedione ...16
1.14.4 Alpha- Glucosidase inhibitors ...16
2.1 Traditional herbal remedies for primary health care ...17
2.2 Medicinal plants as antioxidant ...18
2.3 Bioactive compounds in plants ...18
2.3.1 Phenolic compounds ...19
2.3.2 Flavonoids ...19
2.3.3 Glycosides ...21
2.3.4 Saponins ...21
2.3.5 Tannins ...22
2.3.6 Terpenes ...23
2.4 Anti-diabetic properties of medicinal plants ...23
2.5 Potential of medicinal plants in inhibiting protein glycation ...24
2.5.1 Botany ...25
2.5.2 Traditional uses ...25
2.6 Toxicity and safety concern of the medicinal plants ...27
2.7 Background and study rationale ...28
2.8 Aim of the study ...30
2.9 Objectives ...30
The objectives of the study were:...30
3.1 Plant collection, extraction and sub-fractionation ...31
3.2 Qualitative phytochemical analysis ...32
3.2.1Thin layer chromatography Profiling ...32
3.2.2 Chemical tests for various secondary metabolites ...32
3.2.2.1 Test for phenols ...32
3.2.2.2Test for tannins ...32
3.2.2.3Test for terpenoids ...32
3.2.2.5 Test for flavonoids ...33
3.3 Quantitative phytochemical analysis ...33
3.3.1 Total phenolic content ...33
3.3.2 Total Flavonoid Content ...33
vi
3.4 Quantitative antioxidant activity ...34
3.4.1 Free radical scavenging activity ...34
3.4.2 Ferric ion reducing power ...34
3.5 Anti-glycation activity ...35
3.7 Cell culture maintenance ...36
3.7.1 C2C12 muscle cell differentiation ...36
3.7.2 3T3-L1 pre-adipocyte cell differentiation ...37
3.8 Cytotoxicity assay ...37
3.8.1 MTT assay ...37
3.11 Statistical analysis ...39
Chapter 4: Results ...40
4.1 Plant extraction and yield quantification ...40
4.1 Phytochemical analysis ...41
4.1.1 The qualitative phytochemical analysis and UV active compound profile on thin layer chromatography plates ...41
4.1.2 Chemical tests for secondary metabolites ...44
4.1.3 Qualitative antioxidant ...45
4.1.3 Quantitative phytochemical analysis ...46
4.1.3.1 Total phenolic content ...46
3.1.3.2 Total flavonoid content ...47
4.1.3.2 Quantitative antioxidant analysis ...50
4.1.3.3 Ferric ion reducing power (FRP) ...51
4.2 Antiglycation activity ...53
4.3 Partial α-amylase inhibitory activity ...54
4.4 Cytotoxicity assay ...55
Differentiation of C2C12 cells from murine myoblast cells to fibroblast cells ...60
Differentiation of 3T3-L1 pre-adipocytes into 3T3-L1 adipocytes ...61
4.5 Glucose uptake assay ...62
Chapter 5: Discussion and conclusion ...71
Chapter 6: References ...84
vii
LIST OF FIGURES AND TABLES
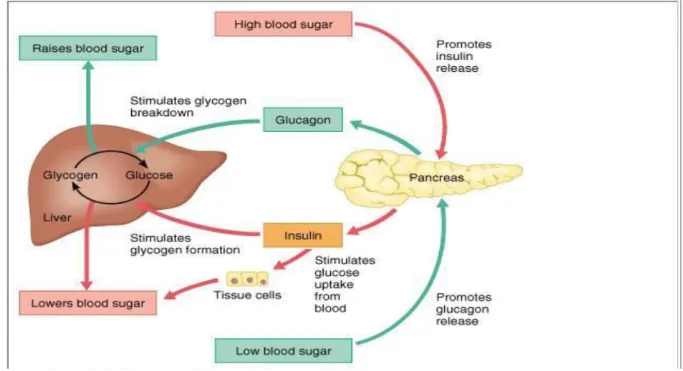
Figure 1: Depiction of metabolism of glucose and regulation of blood glucose levels controlled by a sophisticated hormonal system.
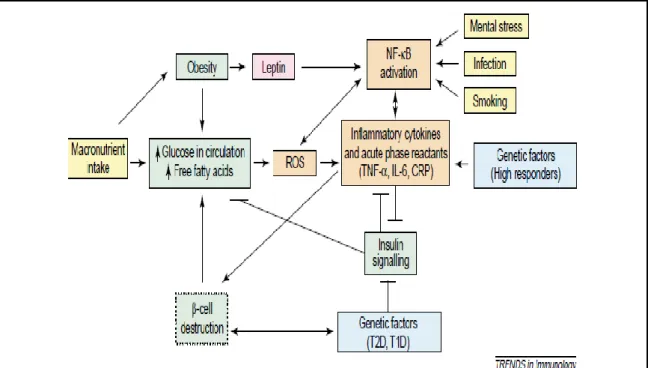
Figure 2: The induction of reactive oxygen species (ROS) generation and inflammation (NF-kB activation) by macronutrient intake, obesity, free fatty acids, leptin, infection, smoking, mental stress and genetic factors.
Figure 3: Basic structures of some pharmacologically important plant derived phenolics.
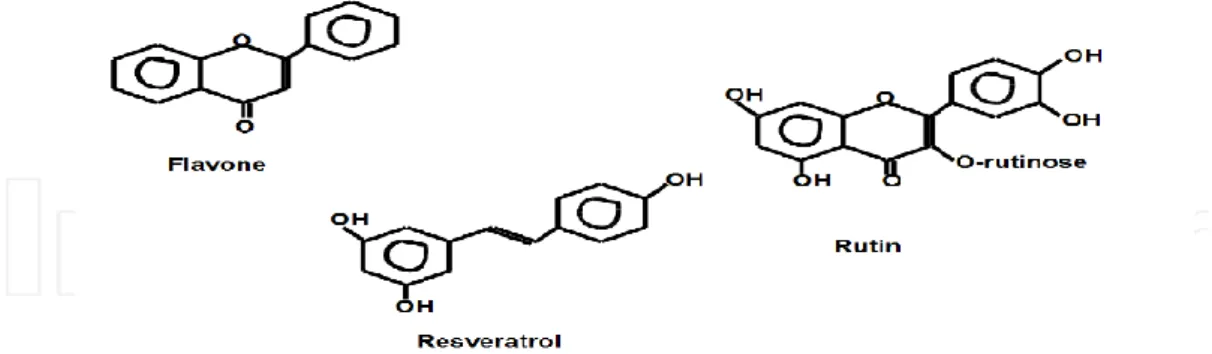
Figure 4: Basic structures of some pharmacologically important plant derived flavonoids.
Figure 5: Basic structures of some pharmacologically important plant derived glycosides.
Figure 6: Basic structure of some pharmacologically important derived tannins.
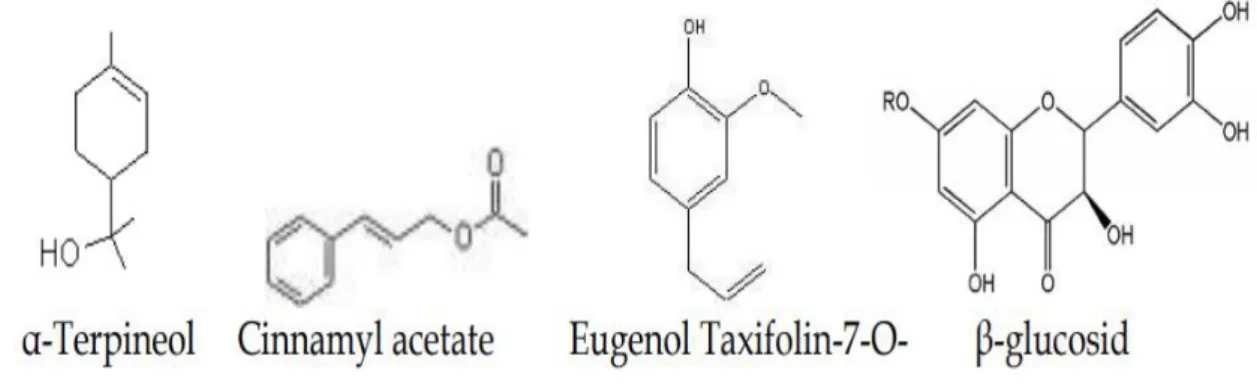
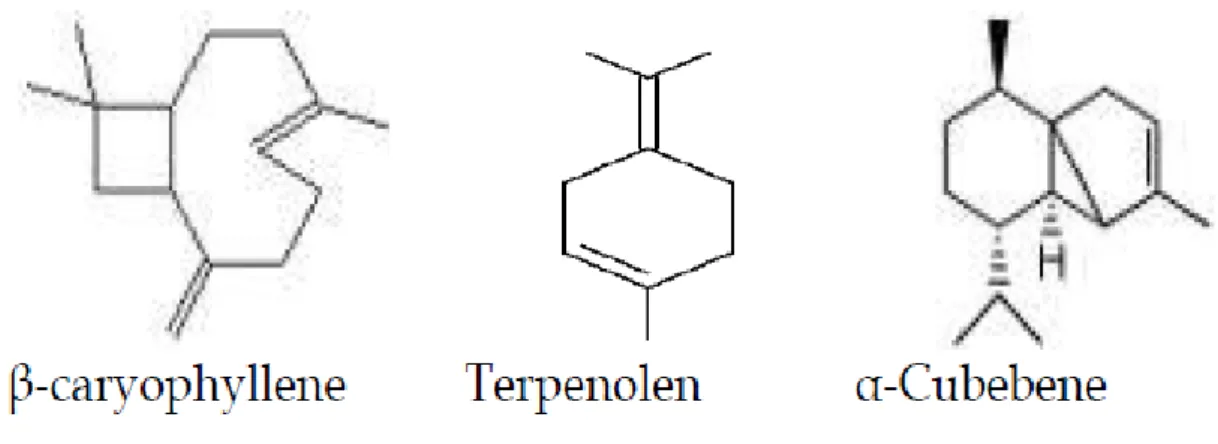
Figure 7: Basic structures of some pharmacologically important plant derived terpenes.
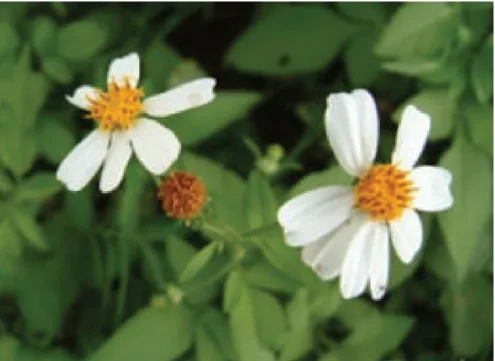
Figure 8: A representative image of Bidens pilosa.
Figure 9: Solvent-solvent fractionation diagram obtained from method of Suffness and Douros in 1979.
viii
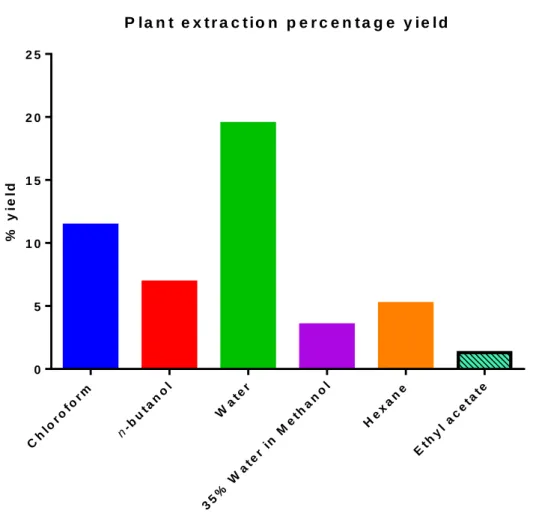
Figure 10: The percentage yields of B. pilosa sub-fractions obtained after solvent- solvent sub-fractions from crude methanol extract.
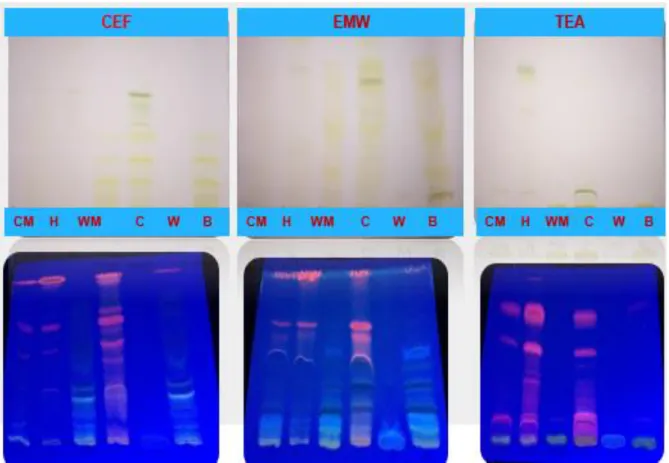
Figure 11: TLC fingerprint profile and UV active compounds of B. pilosa crude methanol and sub-fractions. CM=Crude Methanol, H=Hexane, WM=35% Water in Methanol, C=Chloroform, W=Water, B=n-Butanol.
Figure 12: TLC fingerprint plates sprayed with p-Anisaldehyde and acidic vanillin.
CM=Crude Methanol, H=Hexane, WM=35% Water in Methanol, C=Chloroform, W=Water, B=n-Butanol.
Table 1: The presence and absence of various secondary metabolites of B. pilosa crude extract and sub-fractions.
Figure 13: TLC plates sprayed with DPPH for visualisation of antioxidants compounds. CM=Crude Methanol, H=Hexane, WM=35% Water in Methanol, C=Chloroform, W=Water, B=n-Butanol.
Figure 14: Standard curve of phenolic content constructed using tannic acid.
Figure 15: Total phenolic content of B. pilosa crude extract and sub-fractions represented as tannic acid equivalents (TAE mg/g).
Figure 16: Standard curve used to quantify flavonoids. The standard used was Quercetin.
Figure 17: Total flavonoids content of B. pilosa crude extract and sub-fractions represented as quercetin equivalents (QE mg/g).
Figure 18: The percentage of the DPPH free radical scavenged by different concentration of B. pilosa crude extract and sub-fractions. Ascorbic acid was used at the positive control.
Figure 19: The percentage of the DPPH free radical scavenged by different concentration of B. pilosa sub-fractions. Ascorbic acid was used at the positive control.
ix
Figure 20: The absorbance ferric ion reduced by different by different concentrations of B. pilosa crude extract and sub-fractions. Ascorbic acid is used at the positive control.
Figure 21: The percentage of antiglycation potential in different concentration of B. pilosa crude extract and sub-fractions. Arbutin was used as a positive control.
Figure 22: Percentage inhibition of α-amylase enzyme using different concentrations of B. pilosa crude extract and sub-fractions. Acarbose was used as a positive control.
Figure 23: The cytotoxic effects of B. pilosa crude extract and sub-fractions (water and n-butanol) using different concentration on C2C12 muscle cells treated at different concentrations (15.63 µg/ml -500 µg/ml). The experiment was carried out for 24 hours using MTT assay. Untreated cells and Curcumin were used as experimental and positive controls respectively. DMSO (Dimethylsulphoxide) was used as a negative control.
Figure 24: The effect of B. pilosa sub-fractions (Chloroform, 35% water in methanol and hexane) on C2C12 muscle cells treated at different concentrations (15.63 µg/ml -500 µg/ml). The experiment was carried out for 24 hours using MTT assay.
Untreated cells and Curcumin were used as experimental and positive controls respectively. DMSO was used as a negative control.
Figure 25:the effect of B. pilosa crude methanol and sub-fractions (water and n- butanol) on 3T3-L1 pre-adipocytes treated at different concentrations (15.63 µg/ml - 500 µg/ml). The experiment was carried out for 24 hours using MTT assay. Untreated cells and Curcumin were used as experimental and positive controls respectively. DMSO was used as a negative control.
Figure 26: The effect of B. pilosa sub-fractions (Chloroform, 35% water in methanol and hexane) on 3T3-L1 pre-adipocytes treated at different concentrations (15.63µg/ml -500µg/ml). The experiment was carried out for 24 hours using MTT assay. Untreated cells and Curcumin were used as experimental and positive controls respectively. DMSO was used as a negative control.
x
Figure 27: The change in morphology as an indication of differentiation of murine myoblast cells to myo-tubules from day 0 to day 6 in differentiation media.
Figure 28: The transition of 3T3-L1 pre-adipocytes in to mature adipocytes from day 0 today 8 in differentiation media.
Figure 29: The effects of B. pilosa crude extract in the presence, absence and combination of insulin and metformin at a concentration of 15 µg/ml in stimulating glucose uptake in differentiated C2C12 cells. Untreated cells and cells treated with DMSO were used as experimental and negative controls respectively. Insulin and metformin were used as positive controls.
Figure 30: The effects of chloroform sub-fraction at a concentration of 15µg/ml in stimulating glucose uptake in differentiated C2C12 cells at 3 hours and 6 hours treatment. Untreated cells and cells treated with DMSO were used as experimental and negative controls respectively. Insulin and metformin were used as positive controls.
Figure 31: The effects of n-butanol sub-fraction at a concentration of 15 µg/ml in stimulating glucose uptake in differentiated C2C12 cells at 3 hours and 6 hours treatment. Untreated cells and cells treated with DMSO were used as experimental and negative controls respectively. Insulin and metformin were used as positive controls.
Figure 32: The effects of water sub-fraction at a concentration of 15 µg/ml in stimulating glucose uptake in differentiated C2C12 cells at 3 hours and 6 hours treatment. Untreated cells and cells treated with DMSO were used as experimental and negative controls respectively. Insulin and metformin were used as positive controls.
Figure 33: The effects of crude methanol at a concentration of 15 µg/ml in stimulating glucose uptake in 3T3-L1adipocytes at 3 hours and 6 hours treatment. Untreated cells and cells treated with DMSO were used as experimental and negative controls respectively. Insulin and metformin were used as positive controls.
xi
Figure 34: The effects of chloroform sub-fraction at a concentration of 15 µg/ml in stimulating glucose uptake 3T3-L1adipocytes at 3 hours and 6 hours treatment.
Untreated cells and cells treated with DMSO were used as experimental and negative controls respectively. Insulin and metformin were used as positive controls.
Figure 35:The effects of n-butanol sub-fraction at a concentration of 15 µg/ml in stimulating glucose uptake in differentiated 3T3-L1adipocytes at 3 hours and 6 hours treatment. Untreated cells and cells treated with DMSO were used as experimental and negative controls respectively. Insulin and metformin were used as positive controls.
Figure 36: The effects of water sub-fraction at a concentration of 15 µg/ml in stimulating glucose uptake in 3T3-L1adipocytes at 3 hours and 6 hours treatment.
Untreated cells and cells treated with DMSO were used as experimental and negative controls respectively. Insulin and metformin were used as positive controls.
Figure 37: The effects of B. pilosa crude methanol extract and sub-fractions (chloroform, water and n-butanol) on adipogenesis using 3T3-L1 adipocytes. Cells were treated with non-cytotoxic concentrations of the extracts. Adipocyte differentiation medium was used as a positive control. Untreated cells were used as experimental control.
xii
i
LIST OF ABREVIATIONS α Alpha
β Beta
°C Degrees Celsius µg Microgram µL Microlitre
ACE Angiotensin-converting enzyme ADA American diabetes association ADM Adipocyte differentiation medium AGEs Advanced glycation end-products ANOVA Analysis of Variance
ATP Adenosine triphosphate BMI Body mass index BSA Bovine serum albumin
CC50 Cytotoxic concentration exhibiting 50% activity CEF Chloroform: ethyl acetate: formic acid
CO2 Carbon dioxide DEX Dexamethasone DM Diabetes mellitus
DMEM Dulbecco’s minimum-eagle medium DMSO Dimethylsulphoxide
DPPH 2,2-diphenyl-1-picrylhydrazyl
EC50 Concentration exhibiting 50% activity EMW Ethyl acetate methanol water
FBS Foetal bovine serum
ii
FPG Fasting plasma glucose FRP Ferric reducing power g Gram
GAE Gallic acid equivalence GDM Gestational diabetes mellitus
GIP Glucose-dependent insulinotropic peptide GLP-1 Glucagon-like peptide 1
Glut4 Glucose transporter4 H2SO4 Sulphuric acid
HCL Hydrochloric acid
IDF International Diabetes Federation IGT Impaired glucose tolerance IL6 Interleukin-6
IR Insulin receptors l litre
Mg/ml Milligram per millilitre ml Millilitre
mM Millimolar
MTT 3-(4,5-dimethylthiozyl-2-yl)-2,5-diphenyl tetrazolium bromide NaOH Sodium hydroxide
NIDDM Non-insulin dependent insulin diabetes mellitus OGTT Oral glucose tolerance test
PBS Phosphate buffered saline QE Quercetin equivalence ROS Reactive oxygen species RS Receptive species
iii
TCA Trichloroacetic acid
TEA Toluene: ethyl acetate: ammonia hydroxide TIDM Type I diabetes mellitus
TLC Thin layer chromatography TNFα Tumour necrotic factor alpha T2DM Type II diabetes mellitus TZDs Thiazolidinediones
USA United States of America UV Ultraviolet
v/v Volume to volume W/V Weight per volume WAT White adipose tissue WHO World Health Organization
iv
CONFERENCES AND PRESENTATIONS Poster presentations
Tolo, M.M., Bagla, V.P., Poopedi, K.W., Mampuru, L.J. and Mokgotho, M.P. (2018).
Antiglycation and α-amylase inhibition potential and cytotoxicity studies of Bidens pilosa crude extract and sub-fractions extract and sub-fractions using 3T3-L1 adipocytes. The South African society of Biochemistry and Molecular Biology conference (SASBMB) (Potchefstroom University).
Tolo, M.M., Bagla, V.P., Poopedi, K.W., Mampuru, L.J. and Mokgotho, M.P. (2019).
Bidens pilosa extracts and sub-fractions induce adipogenesis and exert glucose uptake activities in 3T3-L1 adipocytes. South African Medical Research Council (SAMRC) (Cape Town).
Oral presentations
Tolo, M.M., Bagla, V.P., Poopedi, K.W., Mampuru, L.J. and Mokgotho, M.P. (2018).
Phytochemical constituent profiles and antioxidant activity of six different extraction formulations for analysis of Bidens pilosa crude extract and its sub- fractions. South African Medical Research Council (SAMRC) (Cape Town).
Tolo, M.M., Bagla, V.P., Poopedi, K.W., Mampuru, L.J. and Mokgotho, M.P. (2019).
Bidens pilosa extracts and sub-fractions induce adipogenesis and exert glucose uptake activities in 3T3-L1 adipocytes. South African Medical Research Council (SAMRC)(Kwazulu-Natal).
Tolo, M.M., Poopedi, K.W., Mampuru, L.J. and Mokgotho, M.P. (2019). Evaluation of the efficiency of Bidens pilosa extracts in management of diabetes mellitus and its effect on adipogenesis. The science and Agricultural Faculty Research Day (Protea hotel, The range), University of Limpopo.
v
ABSTRACT
Diabetes mellitus has become a global epidemic, particularly type 2 diabetes.
Obesity is one of the causes of type 2 diabetes mellitus due to its link with induced insulin resistance. There is no cure for diabetes mellitus and, as such, it is managed by using standard drugs which have side effects, and can be toxic, expensive and unavailable. People have resorted to the use of medicinal plants to treat diabetes and its complications. The aim of this study was to test the anti-obesity and anti- diabetic properties of Bidens pilosa crude extract and its sub-fractions using C2C12 myoblasts and 3T3-L1 adipocytes. The crude extract and the most active sub- fractions were selected for further analysis because of their ability to stimulate glucose uptake and induction of adipogenesis.
Bidens pilosa leaves were selected for this current study. They were firstly extracted using absolute methanol and further subjected to solvent-solvent fractionation to obtain the n-butanol, ethyl acetate, water, hexane, chloroform and 35% water in methanol sub-fractions. Qualitative phytochemical analysis was performed using thin layer chromatography (TLC) and standard chemical tests. Total phenolic and flavonoid content were determined quantitatively using a calorimetric method with Folin-Ciocalteu’s reagent. For their antidiabetic potential, the extracts were evaluated chromogenically and calorimetrically for antiglycation and α-amylase inhibitory activity. The cytotoxicity of the extracts on 3T3-L1 preadipocytes and C2C12 myotubes were determined using the MTT assay. The adipogenesis inducing effect of the extract was tested using the adipogenesis kit.
More compounds were found on chromatograms eluted in EMW mobile phase (Ethyl acetate: methanol: water). The extracts were shown to contain a variety of secondary metabolites, and high phenolic and flavonoids contents. Crude, chloroform, n- butanol and water sub-fractions had high antioxidant activity. Alpha amylase activity was highly inhibited in the crude extract and all sub-fractions, with the highest inhibitory activity observed in the crude extract and the chloroform, n-butanol and water Sub-fractions (IC50 1.25 ± 2.5 mg/ml). The cytotoxic profiles indicated that all extracts are non-cytotoxic at concentrations of 15.63 µg/ml. Extracts at a concentration of 31.25 µg/ml were shown to stimulate the accumulation of triglycerides using 3T3-L1 adipocytes. The extracts also exhibited significant
vi
(P < 0.05) glucose uptake activity. In conclusion, Bidens pilosa contains constituents that inhibit α-amylase, antiglycation formation and modulates uptake of glucose in 3T3-L1 adipocytes. The use of B. pilosa in combination with insulin revealed the synergistic effects in facilitating glucose uptake in both C2C12 myotubes and 3T3- L1 adipocytes. This suggests that there might be some binding compounds found in the plant extracts that are responsible for the stimulation of expression of several genes that encode for proteins involved in the metabolism of glucose. However, the use of B. pilosa, in combination with metformin, results in a decreased glucose uptake. Bidens pilosa have the fast-acting insulin mimetic properties. Furthermore, the plant was shown to stimulate the accumulation of triglycerides in 3T3-L1 adipocytes, signifying the plant can induce adipogenesis at 30µg/ml.
1
Chapter 1: Introduction
1.1 Diabetes mellitus
Diabetes mellitus is a metabolic condition characterised by an increase in the level of glucose due to the deficiency in insulin secretion and/or resistance associated with this hormone. Diabetes mellitus is partially caused by the excessive presence of carbohydrates in the diet, and abnormal protein and fat metabolism (American Diabetes Association, 2010). If blood glucose levels remain high, over a long period of time, this can result in long-term damage of organs such as the kidneys, eyes, nerves, heart and blood vessels. Complications in some of these organs can lead to death (Ziegler et al., 2009).
There are many pathologic processes involved in the development of diabetes. One such process involves the destruction of pancreatic β-cells, which are responsible for the production of insulin, thus leading to deficiency or abnormalities in insulin and resistance to insulin action. The deficiency in insulin action occurs as a result of improper insulin secretion and or destroyed responses of tissues to insulin at one or more points in the complex pathways of hormone action (Ozougwu et al., 2013).
1.2 Prevalence of diabetes mellitus
Diabetes mellitus is one of the largest metabolic epidemics the world has faced, in both the developed and developing nations. In 2019, a total of 463 million people are estimated to be living with diabetes, representing 9.3% of the global adult population (20–79 years). This number is expected to increase to 578 million (10.2%) in 2030 and 700 million (10.9%) in 2045 (Saeedi et al., 2019). The prevalence of diabetes in women in 2019 is estimated to be 9.0%, and 9.6% in men. The increase of diabetes with age leads to a prevalence of 19.9% (111.2 million) in people aged 65–79 years.
In 2045, diabetes prevalence is projected to reach 11.9%, 11.8% and 4.7% in high- , middle- and low-income countries, respectively (Ajlouni et al., 2019). Of all people living with diabetes, 67.0% are living in urban areas, prevalence being higher in urban than in rural areas (10.8% vs. 7.2%) (Saeedi et al., 2019).
2
1.3 Classification of diabetes mellitus
Diabetes mellitus is classified into three groups, according to their primary causes, namely: type I, type II and gestational diabetes mellitus (Kenneth, 2006). A huge factor underlying these different types of diabetes is the deficiency in insulin, defective insulin or lack of tissue responsiveness to insulin.
1.3.1 Type I diabetes mellitus
Type I diabetes mellitus (TIDM) is known as a chronic autoimmune disease which is characterised by elevated blood glucose levels, known as hyperglycaemia, due to insulin deficiency that occurs as a consequence of the loss of pancreatic islet β-cells (Search study group, 2004; Eisenbarth 1986; Atkinson et al., 2014). Type I diabetes mellitus is a common endocrine and metabolic condition occurring in children. In the majority of patients (70-90%), the destruction of β-cells is a result of TIDM-related autoimmunity (concomitant with the formation of TIDM-associated autoantibodies).
There are factors contributing to type I diabetes mellitus which are heterogenous:
environmental factors, such as diet and chemical agents among individuals genetically predisposed, are major factors contributing to the autoimmune activity of the pancreas (Marshall et al., 2013).
1.3.2 Type II diabetes mellitus
Type II diabetes mellitus (T2DM) is defined as a disease caused by dysregulation of carbohydrate, lipid and protein metabolism, and results from impaired insulin secretion, insulin resistance or a combination of both. T2DM is the most common type as it accounts for more than 90% of all cases. It is caused mainly by continuously impaired insulin secretion by pancreatic β-cells, usually upon a background of pre- existing insulin resistance in skeletal muscle, liver and adipose tissue (DeFronzo, 2009). Type II diabetes mellitus is an on growing global health problem, closely related to the epidemic of obesity. Individuals affected with type II diabetes have a higher chance of microvascular and macrovascular complications. The development or causes of diabetes mellitus are not fully understood, nonetheless, environmental factors such as unhealthy diet, lack of physical activities and obesity and genetic disorders have been shown to contribute to the development and pathophysiological
3
disturbances that are responsible for impaired glucose homeostasis in T2DM (DeFronzo et al., 2015).
1.3.3 Gestational diabetes mellitus
Gestational diabetes is a type of diabetes which occurs during pregnancy. In previous years, any form of hyperglycaemia which occurred during pregnancy was referred to as gestational diabetes mellitus (GDM), regardless of whether the condition occurred before the pregnancy or continued after the pregnancy. Recently, GDM is diagnosed in the second or, more commonly, third trimester and differs from type I and type II diabetes (American Diabetes Association, 2016). Women with GDM are mostly asymptomatic, so screening is important for detection. In a normal pregnancy, insulin resistance develops in the second trimester and continues until birth. The mode of action is not fully understood but is known to be associated with the production of hormones, cytokines or adipokines by the placenta. Insulin secretion also increases, resulting in standardised glucose concentrations.
Gestational diabetes normally develops because of pre-existing elevated insulin resistance and reduced insulin secretion. The imbalance between insulin resistance and secretion that occurs during pregnancy may lead to hyperglycaemia. Gestational diabetes is associated with maternal and foetal complications (Whalen and Taylor, 2017).
4
1.4 Carbohydrate metabolism
Carbohydrate metabolism is the biochemical process accountable for the metabolic production, breakdown and interconversion of carbohydrates in the body (Maughan, 2009). Humans consume a lot of carbohydrates, and digestion breaks down complex carbohydrates into a few simple monomers (monosaccharides) for metabolism:
glucose, fructose, and galactose (Hall, 2015).
1.4.1 Carbohydrates digestion enzymes
Alpha amylase and alpha glucosidase enzymes play a role in the digestion of carbohydrates into glucose molecules. Alpha amylase is responsible for breaking down long chain carbohydrates into oligosaccharides and disaccharides, and alpha glucosidase responds to the end product by breaking down starch and disaccharides to glucose molecules (Bhosale and Hallale, 2011). Improvement in meal tolerance and diabetic control leads to a decrease in the rate of carbohydrate intake and post prandial blood glucose level. Alpha amylase and glucosidase inhibitors are the potential targets in the development of lead compounds for the treatment of diabetes (Anderson and Chen, 1979).
1.5 Glucose metabolism and regulation
The rate at which glucose enters the blood circulation is called plasma glucose concentration. It is well balanced by the measure of glucose removal from the circulation (glucose disappearance). Circulating glucose is derived from three sources namely: intestinal absorption during the fed state, glycogenolysis and gluconeogenesis. Other sources of circulating glucose originate directly from hepatic processes: glycogenolysis, the breakdown of glycogen, the polymerized storage form of glucose; and gluconeogenesis, the formation of glucose primarily from lactate and amino acids during the fasting period (Wallum et al., 1992). Glucagon is a hormone which plays a huge role in glycogenolysis and gluconeogenesis during the fasting period. Glycogenolysis is the major procedure by which glucose is produced during the first 8– 12 hours of fasting. Glucagon promotes this process and thus enables glucose appearance in the circulation. Over longer periods of fasting, glucose, produced by gluconeogenesis, is released from the liver.
5
Glucoregulatory hormones, such as insulin, glucagon, amylin, GLP-1, glucose- dependent insulinotropic peptide (GIP), epinephrine, cortisol and growth hormone, are responsible for maintaining circulating glucose concentrations in a relatively narrow range (Aronoff et al., 2004). Amongst these, insulin and amylin originate from the β-cells and glucagon from the α-cells of the pancreas, and GLP-1 and GIP from the L-cells of the intestine. The glucoregulatory hormones of the body are structured to keep circulating the concentration of glucose in a moderately small range. During the fasting process, glucose leaves the circulation at a steady rate. To keep pace with the removal of glucose, the endogenous glucose formation is fundamental.
Renal gluconeogenesis contributes considerably to the foundational glucose pool only during times of serious starvation. After reaching a post-meal peak, blood glucose gradually decreases during the next few hours, eventually returning to the fasting state. In the prompt post-feeding process, elimination of glucose into skeletal muscle and adipose tissue is driven mainly by insulin (Gerich et al., 2001).
1.6 β-cell hormones
Insulin, a small protein composed of two polypeptide chains containing 51 amino acids, is a key anabolic hormone secreted in response to increased blood glucose and amino acids, following ingestion of a meal. Insulin applies its mechanism of action through binding to specific receptors found on a lot of cells of the body, including fat, liver and muscle cells. The major function of insulin is to stimulate glucose disappearance. Insulin helps control postprandial glucose in three ways:
Initially, insulin signals the cells of insulin-sensitive peripheral tissues, and primarily skeletal muscle, to increase their uptake of glucose (Gerich et al., 1974). Secondly, insulin acts on the liver to stimulate glycogenesis. Lastly, insulin simultaneously inhibits glucagon secretion from pancreatic β-cells, thus signalling the liver to stop producing glucose via glycogenolysis and gluconeogenesis. Another mode of action of insulin involves the activation of fat synthesis, development of triglyceride accumulation in fat cells, formation of synthesis of protein in the liver and muscle and proliferation of cell growth (Cryer et al.,1993). Insulin action is attentively regulated in response to circulating glucose concentrations. Insulin is not stimulated when the blood glucose concentration is ≤ 3.3 mmol/l but is stimulated as the glucose concentration increases over this threshold. Postprandially, theproduction of insulin appears in two stages: The first rapid release of preformed insulin, followed by
6
elevated insulin synthesis and release in response to blood glucose. Long-term stimulation of insulin occurs when there is high concentration of glucose (D'Alessio et al., 2004).
1.7 Glucose uptake and transport in skeletal muscle and adipose tissue
The transport of glucose in the skeletal muscle is the first step and categorised under physiological conditions, such as glucose metabolism, as the rate limiting step (Zeil et al., 1988). As such, transportation of glucose in cells and the possibilities of disturbance in glucose homeostasis is of major regulatory significance. For decades, it has been established that the uptake, utilisation and disposal of glucose in skeletal muscles and adipose tissues are enhanced by insulin. The pattern of molecular events directing the insulin-mediated glucose transport is initiated at the muscle cell membrane where insulin binds to the receptors of the plasma membrane (Khan et al., 1976).
Figure 1.1: Metabolism of glucose and regulation of blood glucose levels are controlled by a sophisticated hormonal system (Cummings, 2001).
7
1.8 Complications of diabetes mellitus
The complications of diabetes mellitus are much less in people who have well controlled blood sugar levels. These complications include hypoglycaemia, hyperglycaemia, diabetic coma and nonketotic hyperosmolar coma. Chronic complications occur because of a mix of microangiopathy, macrovascular disease and immune dysfunction in the form of autoimmune disease or poor immune response, most of which are difficult to manage. Macrovascular problems can lead to cardiovascular disease and erectile dysfunction. Female infertility may be due to endocrine dysfunction with impaired signalling on a molecular level (Nathan, 1993).
Other health problems compound the chronic complications of diabetes such as smoking, obesity, high blood pressure, elevated cholesterol levels and lack of regular exercise which are accessible to management as they are modifiable. Non- modifiable risk factors of diabetic complications are the type of diabetes, age of onset, and genetic factors (Moore et al., 2009).
1.8.1 Microvascular disease complications of diabetes.
1.8.1.2 Diabetic retinopathy
Diabetic retinopathy is the most common microvascular complication of diabetes, classified by a lesion that arises on the retina of the eye. This means that there are alterations in vascular permeability, capillary micro aneurysms, capillary degeneration and excessive formation of new blood vessels (neovascularization). It contributes to
~ 10,000 new cases of blindness every year (Fong et al., 2004). The chances of developing diabetic retinopathy, or other microvascular complications of diabetes, relies upon both the span and the severity of hyperglycaemia. Development of diabetic retinopathy in patients with type II diabetes was found to identify with both the severity of hyperglycaemia and the presence of hypertension. Most patients with type I diabetes are shown to have signs and symptoms of retinopathy after 20 years of diagnosis (Keenan et al., 2007). This is opposite to type II diabetes as development of retinopathy may begin as early as 7 years before the diagnosis of diabetes. There are a few proposed pathological pathways by which diabetes may cause the development of retinopathy. Aldose reductase may be a major contributor in the
8
development of diabetes complications. Aldose reductase is the initial enzyme in the intracellular polyol pathway. This pathway converts glucose into glucose alcohol (sorbitol). High glucose levels give rise to the flux of sugar molecules through the polyol pathway, which leads to sorbitol accumulation in cells. Osmotic pressure from sorbitol accumulation has been hypothesised as a basic component in the improvement of diabetic microvascular inconveniences, including diabetic retinopathy (Gabby, 1975).
Proliferative stages of diabetic retinopathy occur in the development of new blood vessels, blindness and visual impairment (Tarr et al., 2013). Frequent increase of glucose in the blood stream, in combination with an increase in blood pressure and high cholesterol, are the major causes of retinopathy. Regular eye check-ups and managing glucose levels at or close to normal concentrations is required (Chistiakov, 2011).
1.8.1.2 Diabetic nephropathy
Diabetic nephropathy is the leading cause of kidney failure in diabetes. It is classified by the presence of proteinuria with microalbuminuria. Diabetic patients with microalbuminuria normally develop proteinuria and overt diabetic nephropathy. This progression occurs in both type I and II diabetes. The initial treatment of diabetic nephropathy, as for other complications of diabetes, is prevention. Like other microvascular complications of diabetes, there is a strong link between glucose control (as estimated by hemoglobin A1c [HbA1c]) and the risk of developing diabetic nephropathy. Treatment to maintain the minimal safe glucose level is required to prevent or manage diabetic nephropathy (Fowler, 2008). Treatment with angiotensin- converting enzymes (ACE) inhibitors have not appeared to improve microalbuminuria in patients with type I diabetes but has been shown to lower the risk of having nephropathy and cardiovascular occasions in patients with type II diabetes (Ruggenenti and Remuzzi, 1998).
9
1.8.2 Protein glycation and its implications in diabetic complications
Glycation is known to be a key molecular feature of diabetes complications resulting from chronic hyperglycaemia. Glycation is characterised by the carbonyl group of reducing sugars reacting non-enzymatically with the amino group of proteins, nucleic acids and other molecules in order to initiate glycation, also known as Amadori products or fructose products (Singh et al., 2011). Subsequently, Amadori products go through a sequence of irreversible reactions forming highly reactive carbonyl species (RCS), such as glyoxal, methylglyoxal and 3-deoxy-glucosone (Negre‐
Salvayre et al., 2008). At the end, these reactive carbonyls react with the amino, sulfhydryl and guanidine functional groups of intracellular and extracellular proteins to form the stable advanced glycation end products (AGEs). The reactive carbonyl species can also be produced from sugar glycoxidation contributing to the AGE formation (Muthenna et al., 2012). Accumulation of AGEs has been implicated as a major pathogenic connection between hyperglycaemia and long complications of diabetes (Matsuura et al., 2002)
1.9 The relationship between obesity and diabetes
Obesity is defined as state of inflammation. The plasma concentration of inflammatory mediators, such as tumour necrosis factor-a (TNF-α) and interleukin-6 (IL-6), are raised in the insulin resistant status of obesity and type II diabetes (Hotamisligil et al.,1993). This brings about the mechanisms involved in obesity which lead to the development of type II diabetes mellitus. There are two mechanisms which may be involved in the pathogenesis of inflammation. Firstly, glucose and macronutrient intake lead to oxidative stress and inflammatory alterations. Chronic conditions such as excessive food intake (obesity) might thus be a proinflammatory state with oxidative stress. Secondly, the increased concentrations of TNF-α and IL-6, linked with obesity and type II diabetes, might inhibit insulin action by blocking insulin signal transduction. This might prevent the anti-inflammatory effect of insulin, which in turn might result in the development of inflammation (Yudkin et al., 1999).
10
1.10 Macronutrient intake and inflammation
An increase in the concentration of fibrinogen has an insightful value in the formation of obesity itself. Glucose intake stimulates acute oxidative stress and inflammation at the cellular and molecular level for a period of three hours (Esposito et al., 2002), and a mixed fast-food meal also influences the same responses for the upcoming four hours. However, restriction of a diet in the obese for a certain time period causes a significant decrease in oxidative stress, which is noticeably enhanced in the obese (Dandona et al., 2001). Fasting for a period of 48 hours might cause 50% decrease in reactive oxygen species (ROS) generation by leucocytes and a reduction in the expression of NADPH oxidase, the enzyme that converts molecular oxygen to the superoxide radical. The superoxide radical is responsible for the activation of the redox sensitive proinflammatory transcription factor, NF-kB, which activates the transcription of most proinflammatory genes. Hence, the pro-oxidant and proinflammatory effects of a lot of macronutrient intakes in normal subjects are the same as those found in the obese in their basal fasting state. There are high probabilities that the proinflammatory state of the obese is linked to chronic excessive macronutrient intake. Therefore, increased concentrations of inflammation sensitive proteins, fibrinogen, ceruloplasmin, orosomucoid and x- antitrypsin are predictive of future weight gain. In type II diabetes, the presence of hyperglycaemia further exacerbates the proinflammatory state (Niess and Simon, 2007).
1.11 Anti-inflammatory effect of insulin
The state of insulin resistance influences inflammation since insulin exerts an anti- inflammatory effect at the cellular and molecular level in vitro and in vivo. A small dose infusion of insulin (2.5 IU h21) reduces ROS generation by mononuclear cells, diminishes NADPH oxidase expression and intranuclear NF-kB binding, stimulates IkB expression and represses plasma intercellular adhesion molecule-1 (ICAM-1) and monocyte chemotactic protein-1 (MCP-1) concentrations (Aljada et al., 2002).
Mental health contributes to the rise in plasma IL-6 concentrations. Mental stress might stimulate an inflammatory state (Padgett and Glaser, 2003). However, the mode of action is not fully understood as to how stress could result in worsening
11
ofglucose homeostasis in known diabetics, or whether stress can cause diabetes on its own (Surwit et al., 1992).
Figure 1.2: The induction of reactive oxygen species (ROS) generation and inflammation (NF-kB activation) by macronutrient intake, obesity, free fatty acids, leptin, infection, smoking, mental stress and genetic factors. Interference with insulin signalling (insulin resistance) leads to hyperglycaemia and proinflammatory changes. Abbreviations: CRP, C-reactive protein; T1D, type I diabetes; T2D, type II diabetes (Dandona et al 2004).
12
1.12 Diagnosis of diabetes mellitus
Diagnosis of diabetes mellitus remain a challenge due to the fact that it is a slow progressive pathogenesis disease. The early detection of the disease is difficult because it is asymptomatic at this stage. Diabetes may be diagnosed based on plasma glucose criteria, either the fasting plasma glucose (FPG) or the 2-h plasma glucose (2-h PG) value during a 75-g oral glucose tolerance test (OGTT) (Welsh et al., 2016).
1.12.1 Fasting and 2-Hour Plasma Glucose
The fasting plasma glucose (FPG) measures the fasting glucose level, an FPG with greater or equal to 7 mmol/L or 126 mg/dL is taken to be diabetic. Another method to diagnose a diabetic patient is to measure the plasma glucose concentration. A plasma glucose concentration greater or equal to 11.1 mmol/L or 200 mg/dL, measured after 2 hours administration of 75 g glucose, is considered to be diabetic. However, factors such as age, race, ethnicity, hemoglobinopathies, family background and concomitant, plays a vital role in reliability of the diagnosis and therapy (Diabetes Care, 2018).
1.13 Treatment and management of diabetes mellitus
Diabetes mellitus is a complex disease which requires serious management, continuous medical care and multifactorial risk-reduction strategies beyond glycaemic control. Continuous self-care management education by the patients and support are important to prevent complications and to minimize the risk of long-term complications (American Diabetes Association, 2018).
Ninety years on, the management of type I and type II diabetes aims on improving glycaemic control, by ways of changing lifestyle and pharmacological treatment, with the aim of decreasing microvascular and macrovascular complications. Technology plays a major role in monitoring and delivery of treatment in diabetes and communication with healthcare professionals, while new therapies for lowering glucose are used to target key pathophysiological deficiencies in the development of diabetes (Rösen et al., 2001). Besides major improvements in care, there is still no
13
cure for diabetes mellitus. Nonetheless, considerable research is being carried on in these fields. It has been discovered that obesity is the major factor contributing to the development of diabetes mellitus. Therefore, what is needed is to cut down or decrease the amount of food normally consumed; carbohydrate must be specially restricted, and the patient should concentrate more on protein and fat. Organised instruction programs are viewed as fundamental to enhance patient inspiration and strengthening of self-administration skills (American Diabetes Association, 2018).
1.13.1 Non-pharmacological management of diabetes mellitus
1.13.1.1 Physical activity therapy
There are various advantages to physical activity in patients with diabetes, and these extend to the elderly. The advantages incorporate weight loss or maintenance, lower blood pressure, improved cardiovascular fitness, improved lipid profile and an increased sense of well-being (Wheeler, 1999). Exercise increases glucose uptake into active muscles maintained by the production of hepatic glucose, with an increased dependence on carbohydrate to fuel muscle activity as exercise intensifies. A decrease in blood glucose levels has been reported with both aerobic and resistance exercise up to 72 hours post exercise. Although exercise improves blood glucose levels and insulin action in the short term, the risk for hypoglycaemia among patients who do not take insulin or insulin secretagogues is minimal (Powers et al., 2017).
1.13.1.2 Nutrition therapy
Nutrition is regarded as the “cornerstone of diabetes care”. It is a complex, controversial and evolving area. Dietary administration of diabetes has the goal of improving or maintaining quality of life, in addition to the physiological health and nutritional status of patients. Up to 10% of the daily energy needed can take the form of added sugars, such as table sugar and/or sugar containing products, without impairing diabetes control in most Type II patients (Wolever et al., 1999). The amount of nutritional dietary intake plays a role in the post-prandial blood glucose concentration. Therefore, a proper planned meal prescribed by a qualified dietician
14
can help in the management and regulation of blood glucose level (Morris and wylie- Rosett, 2010).
1.13.2 Pharmacological therapies 1.13.2.1 Insulin therapy
Insulin is a hormone produced in the pancreas by the islets of Langerhan, which regulates the amount of glucose in the blood stream. Insulin therapy is the mainstay of hyperglycaemia treatment in diabetic patients (White et al., 2003). Endogenous basal insulin maintains glucose homeostasis by regulating hepatic glucose production. The ideal strategy for managing insulin therapy in diabetic patients involves a basal-bolus approach, using a combination of a long-acting basal insulin and bolus doses of a rapid- or short-acting insulin prior to meals (Umpierrez et al., 2012). Administering roughly half of the total daily insulin requirement as a basal insulin, once or twice daily, maintains consistent blood glucose concentrations at night and between meals. Giving the other half of the everyday insulin requirement in divided bolus doses before meals prevents postprandial hyperglycaemia.
Supplemental amendment portions of a fast or short-acting insulin might be utilised to address excursions in blood glucose, with dosing guided by blood glucose estimations and insulin affectability, which relies on patient-explicit variables such as capacity to eat dinners, age and renal hindrance (Teuscher, 2007).
1.13.2.2 Oral therapies
Since the 1950s, metformin and sulfonylurea have been used for the treatment of type II diabetes and still stand to be the first- and second-line choices following diagnosis. Current studies have shown that metformin specifically prevents the development of the mitochondrial isoform of glycerophosphate dehydrogenase, decreases cytosolic dihydroxyacetone phosphate and elevates the cytosolic NADH- NAD ratio. This results in decreased plasma glucose and lactate levels, and reduced gluconeogenesis, hepatic glucose secretion and endogenous glucose production.
Metformin can be used with all other diabetes therapies, including, insulin and is also used normally for managing gestational diabetes and polycystic ovary syndrome.
15
Metformin is related to improved cardiovascular outcomes in patients with diabetes (Kahn et al., 2014).
Insulin sensitizers like sulfonylurea and meglitinides induce insulin secretion from the β cells of the pancreas and are thus related to hypoglycaemia and gaining of weight. They are productive at decreasing HbA1c and rapidly decrease glucose levels, which is helpful in highly symptomatic patients following diagnosis. Older generation sulfonylurea, such as tolbutamide and glibenclamide, have been superseded by new versions such as glimepiride, which are short acting, reducing the risk of hypoglycaemia and are more effective, although more expensive (American Diabetes Association, 2009).
Thiazolidinediones (TZD, PPARγ agonists) have been used for over 20 years. The mode of action involves a decreased free fatty acid accumulation, reduction in inflammatory cytokines, elevation in adiponectin levels and preservation of β cell structure and function, which leads to improvement in insulin resistance and β cell failure. The incretin treatments incorporate the subcutaneously injectable GLP-1 receptor agonists, exenatide, liraglutide, lixisenatide, dulaglutide and albiglutide, and the oral DPP-IV inhibitors sitagliptin, saxagliptin, vildagliptin, linagliptin and alogliptin.
GLP-1 receptor agonists initiate GLP-1 receptors in the little digestive system and DPP-IV inhibitors inactivate the catalyst DPP-IV, which ordinarily separates GLP-1.
These drugs have been shown to increase insulin discharge by means of β cells and decrease glucagon emission, hepatic glucose generation and glucose take-up from the stomach, also advancing satiety. All these modes of actions result in improved glycaemic control (HbA1c decrease up to 1.6%) with less risk of hypoglycaemia and frequently significant weight reduction (up to 8 kg) with GLP-1 agonists, and weight neutrality with DPP-IV inhibitors (Achakzai et al., 2009).
1.14 Current antidiabetic drugs and their shortcomings 1.14.1 Biguanides
The most commonly used biguanides is metformin, it is normally used to monitor overweight or obese patients. Metformin activates adenosine monophosphate- activated protein kinase in the liver, causing hepatic uptake of glucose and inhibiting gluconeogenesis through complex effects on the mitochondrial enzymes. Although
16
the drug is effective it has been associated with possible gastrointestinal disturbances (Lorenzati et al., 2010)
1.14.2 Sulfornylureas
Sulfonylureas decreases blood glucose level by increasing insulin secretion in the pancreas by blocking the KATP channels. They also lower gluconeogenesis in the liver. Sulfonylureas decrease breakdown of lipids to fatty acids and reduce clearance of insulin in the liver. Hypoglycemia is the major side effect of all sulfonylureas, while minor side effects such as headache, dizziness, nausea, hypersensitivity reactions, and weight gain are also common (Ronacher et al., 2015).
1.14.3 Thiazolidinedione
Thiazolidinedione decrease plasma glucose and insulin level and improve some of the abnormalities of lipid metabolism. Mechanisms of action include diminution of free fatty acid accumulation, reduction in inflammatory cytokines, rising adiponectin levels, and preservation of β-cell integrity and function, all leading to improvement of insulin resistance and β-cell exhaustion. However, there are a lot of concerns of risks overcoming the benefits. Namely, combined insulin-TZD therapy causes heart failure. Thus, TZDs are not preferred as first-line or even step-up therapy. There is high risk of bone fractures predominately in women (Inzucchi et al., 2015)
1.14.4 Alpha- Glucosidase inhibitors
Alpha-glucosidase inhibitors such as acarbose, miglitol and voglibose are used for tratement of type II diabetes. They work by preventing the digestion of carbohydrates such as starch and table sugar. These agents are commonly effective for postprandial hypoglycaemia but have side effects such as flatulence and diarrhoea (Olokoba et al., 2012).
17
Chapter 2: Literature review
2.1 Traditional herbal remedies for primary health care
Traditional medicinal plants, also referred to as herbal medicines, botanical medicines or phytomedicines, are attributed to the medicinal products of plant roots, stems, leaves, bark, seeds and foods grown from the ground that can be utilized to advance general wellbeing and treat ailments. The various product of plants may be utilised straightforwardly in a prescription formula or processed into different ready- to-use products. Traditional systems of medicines, such as herbal medicines, have been practised for hundreds of years for health care by people in countries of the South-East Asia region, as well as in other parts of the world. Traditional medicine is still a significant and a valuable source of remedies that has been practiced by millions of people around the world to secure their health. It has been developed from experimental encounters and from perceptions made by people who use them.
It encapsulates age-old wisdom and information obtained over thousands of years and forms an integral part of the social and cultural heritage of people and countries.
The system has been acquired from one generation to the next by custom and tradition (WHO, 2010).
Traditional medicine is increasingly popular as a cost-effective alternative to standard drugs. The World Health Organization (WHO) states that 80% of the population in some Asian and African nations rely upon traditional medication for essential medicinal health needs. Traditional medicinal products constitute multi- billion-dollar industries worldwide. Traditional and folklore medication, obtained from age to age, is rich in domestic formulas and collective practice. Incorporating ideas and techniques for the protection and reclamation of wellbeing, traditional medicine has produced a fount elective drug, new pharmaceuticals and healthcare products.
The utilization of traditional medicine and medicinal plants in most developing countries, as a normative basis for the maintenance of good health, has been widely observed (UNESCO, 1997). Furthermore, an increasing dependence on the utilisation of medicinal plants in the developed countries has allowed for the extraction and improvement of a few medications and chemotherapeutics from these plants as well as from traditionally used rural herbal remedies (UNESCO, 1997).
18
2.2 Medicinal plants as antioxidant
Several epidemiological studies have discovered that there is a link between the intake of food rich in polyphenols (for example, fruits, vegetables and grains) and the risk of age-related diseases in humans. This association is mostly assigned to the capability of the antioxidant activities of flavonoids and different polyphenols, as established in vitro, to scavenge a wide range of oxygen, nitrogen and chlorine species (Ketsawatsakul et al., 2000, Pannala et al., 1997 and Silva et al., 2002). An antioxidant is characterised as ''any substance that delays, prevents or expels oxidative harm to a target molecule (Halliwell and Gutteridge, 2015). Therefore, antioxidants may serve to manage the level of free radicals and other ''receptive species" (RS) to limit oxidative damage. There is a lot of anecdotal proof on protective effects of medicinal plants. Some of these effects include antidiabetic, antimicrobial, antiviral, anti-inflammatory, antiallergic, immunosuppressive, immunostimulatory and cancer chemoprevention effects (Huseini et al., 2006).
These beneficial effects are mostly assumed to be antioxidant mechanisms because medicinal plants are rich sources of polyphenols.
2.3 Bioactive compounds in plants
There are two types of compounds found in plants, primary metabolites and secondary metabolites. Primary metabolites are chemical substances which are involved in direct growth, reproduction and development of plants. These includes respiration, carbon fixation and photosynthesis (Achakzai et al., 2009). Secondary metabolites are the chemical substances that are not directly involved in the growth and development of plants. They lead to the biosynthesis of simple to complex metabolites, utilising the intermediates from the primary metabolites through specific pathways. The function of secondary metabolites in defence may include deterrence, anti-feedant activity, toxicity or acting as precursors to physical defence systems.
Some of the important secondary metabolites include phenolics, alkaloids, terpenoids, vitamins etc. Most secondary metabolites take a role in defensive mechanism against biotic factors like protection from attack of pathogens, herbivores and allelopathy, etc., (Athanasiadou and Kyriazakis, 2004, Khan and Singh, 2008).
19
2.3.1 Phenolic compounds
Phenolic compounds are secondary metabolites that are derived from pentose phosphate, shikimate and phenylpropanoid pathways involved in plants (Randhir et al., 2004). Phenolic compounds are one of the most extensively appearing group of phytochemicals, which are of major physiological and morphological importance in plants. These includes properties such as anti- allergenic, antioxidant, anti-microbial, anti-inflammatory, anti-thrombotic, cardioprotective and vasodilatory effects (Benavente-Garcia et al., 1997). Phenolic compounds have been associated with the health benefits obtained from high intake of fruits and vegetables (Hertog et al.,1993). The compounds could be a dominant determining factor of the antioxidant potential of food. They are classified into different groups namely (i) phenolic acids (ii) flavonoid polyphenolics (flavonones, flavones, xanthones and catechins) and (iii) non-flavonoid polyphenolics. Phenolics essentially serve as a host of natural antioxidants, which are used as nutraceuticals, found in apples, green tea and red wine, with the ability to combat cancer, and are also thought to prevent heart ailments to an appreciable degree and sometimes are anti-inflammatory agents.
Figure 2.1: Basic structures of some pharmacologically important plant derived phenolics (Doughari, 2012).
2.3.2 Flavonoids
Flavonoids are an important group of polyphenols mostly distributed among the plant flora. Structurally, they are made of more than one benzene ring (a range of C15 aromatic compounds) and several studies support their use as antioxidants or free
20
radical scavengers (Kar, 2007). The compounds are formed from parent compounds known as flavans. There are more than four thousand flavonoids and some are pigments in higher plants. Quercetin, kaempferol and quercitrin are common flavonoids present in about 70% of plants. Other group of flavonoids include flavones, dihydroflavons, flavans, flavonols, anthocyanidins, proanthocyanidins, calchones and catechin and leucoanthocyanidins.
Figure 2.2: Basic structures of some pharmacologically important plant derived flavonoids (Doughari, 2012).
21
2.3.3 Glycosides
Glycosides are a group of chemical compounds known as condensation products of sugars, such as polysaccharides, with a host of different varieties of organic hydroxy (occasionally thiol) compounds (invariably monohydrate in character), in such a manner that the hemiacetal entity of the carbohydrate must essentially take part in the condensation. Glycosides are classified as colourless, crystalline carbon, hydrogen and oxygen-containing (some contain nitrogen and sulphur) water-soluble phytoconstituents, found in the cell sap. Chemically, glycosides have carbohydrate (glucose) and a non-carbohydrate part (aglycone or genin) (Kar, 2007; Firn, 2010).
Alcohol, glycerol or phenol represents aglycones. Glycosides are neutral in reaction and may be readily hydrolysed into its components with ferments or mineral acids.
Glycosides are characterised based on the type of sugar component, chemical nature of aglycone or pharmacological action. The rather older or trivial names of glycosides usually has a suffix ‘in’ and the names essentially included the source of the glycoside.
Figure 2.3: Basic structures of some pharmacologically important plant derived glycosides (Doughari, 2012).
2.3.4 Saponins
The word saponins is obtained from Saponaria vaccaria (Quillaja saponaria), a plant which abounds in saponins and was once used as soap. Therefore, saponins carry out ‘soap like’ behaviour in water, i.e. they produce foam. On hydrolysis, an aglycone is produced, which is called sapogenin. There are two types of sapogenin: steroidal and triterpenoidal. Usually, the sugar is attached at C-3 in saponins, because in most
22
sapogenins there is a hydroxyl group at C-3. Quillaja saponaria is known to contain toxic glycosides, quillajic acid and the sapogenin senegin. Quillajic acid is strenutatory and senegin is toxic.
2.3.5 Tannins
Tannins are a large group of phenolic compounds which have high molecular weight and are mostly found in plant flora. Tannins are soluble in water and alcohol and are found in the root, bark, stem and outer layers of plant tissue. Tannins have a similar property to tan i.e. to convert things into leather. They are acidic in reaction and the acidic reaction is attributed to the presence of phenolics or a carboxylic group (Kar, 2007).Tannins interact with proteins, carbohydrates, gelatin and alkaloids. They are grouped into hydrolysable tannins and condensed tannins. Hydrolysable tannins, upon hydrolysis, produce gallic acid and ellagic acid and, according to the type of acid they produce, the hydrolysable tannins are called gallotannins or egallitannins.
On heating, they form pyrogallic acid. Tannins are used as an antiseptic and this activity is due to the presence of the phenolic group. Common examples of hydrolysable tannins include the aflavins (from tea), daidezein, genistein and glycitein.
Figure 2.4: Basic structures of some pharmacologically important plant derived Tannins (Doughari, 2012).
23
2.3.6 Terpenes
Terpenes are among the largest outspread and chemically diverse groups of natural products. They are flammable unsaturated hydrocarbons, found in liquid form, mostly in essential oils, resins or oleoresins (Firn, 2010). Terpenoids constitute hydrocarbons of plant origin of general formula (C5H8)n and are classified as mono-, di-, tri- and sesquiterpenoids based on the number of carbon atoms. Examples of most known terpenes are terpinen-4-ol, thujone, camphor, eugenol and menthol. Diterpenes (C20) such as resins and taxol, the anticancer agent, are common example. Examples of triterpenes (C30) are steroids, sterols and cardiac glycosides with anti-inflammatory, sedative, insecticidal or cytotoxic activity. Common triterpenes: amyrins, ursolic acid and oleanic acid. Sesquiterpene (C15), like monoterpenes, are important parts of many essential oils (Martinez et al., 2008). The sesquiterpene behaves as an irritant when tested externally and. when consumed internally. their action resembles that of a gastrointestinal tract irritant. Several sesquiterpene lactones have been screened and generally they have antimicrobial (particularly antiprotozoal) and neurotoxic action.
Figure 2.5: Basic structures of some pharmacologically important plant derived tarpenes (Doughari, 2012).
2.4 Anti-diabetic properties of medicinal plants
Free radicals have been involved in the cause of age-related diseases, such as diabetes mellitus. Compounds that can scavenge free radicals have great potential