http://bo.adu.org.za
An electronic journal published by the Animal Demography Unit at the University of Cape Town
The scope of Biodiversity Observations consists of papers describing observations about biodiversity in general, including animals, plants, algae and fungi. This includes observations of behaviour, breeding and flowering patterns, distributions and range extensions, foraging, food, movement, measurements, habitat and colouration/plumage variations. Biotic interactions such as pollination, fruit dispersal, herbivory and predation fall within the scope, as well as the use of indigenous and exotic species by humans. Observations of naturalised plants and animals will also be considered. Biodiversity Observations will also publish a variety of other interesting or relevant biodiversity material: reports of projects and conferences, annotated checklists for a site or region, specialist bibliographies, book reviews and any other appropriate material. Further details and guidelines to authors are on this website.
Lead Editor: Arnold van der Westhuizen
BIRD DISTRIBUTION DYNAMICS 12 –
THE KINGFISHERS OF SOUTH AFRICA, LESOTHO AND SWAZILAND
Caitlin C D Smith, Les G Underhill and Michael Brooks
Recommended citation format:
Smith CCD, Underhill LG, M Brooks 2017. Bird distribution dynamics 12 – the kingfishers of South Africa, Lesotho and Swaziland. Biodiversity Observations 8.18: 1–41.
URL: http://bo.adu.org.za/content.php?id=313 Published online: 18 April 2017
BIRD DISTRIBUTION DYNAMICS
BIRD DISTRIBUTION DYNAMICS 12 –
THE KINGFISHERS OF SOUTH AFRICA, LESOTHO AND SWAZILAND
Caitlin C D Smith, Les G Underhill and Michael Brooks
Animal Demography Unit, Department of Biological Sciences, University of Cape Town, Rondebosch 7701 South Africa Introduction
This is the 12th paper on bird distribution dynamics in
Biodiversity Observations. The objective of this series of papers is to report on theranges of bird species as revealed by the Second Southern African Bird Atlas Project (SABAP2, 2007 onwards) and to describe how their ranges have changed since the first bird atlas (SABAP1, mainly 1987–
1991), about two decades apart.
This series of papers is also made feasible by the development of two new standards for the presentation of maps, firstly pentad-scale distribution maps derived from SABAP2 data, and secondly range- change maps showing how distributions have changed between SABAP1 and SABAP2 (Underhill 2015, Underhill & Brooks 2016a, b).
Because all papers in this series use these maps, the rules for interpretation are not provided in each paper in this series.
In this paper, we deal with the 10 species of kingfishers which occur in South Africa, Lesotho and Swaziland. For each species, four items of information are presented: the SABAP1 distribution map using quarter-degree grid cells, the SABAP2 distribution map, using pentads (five-minute grid cells, so there are nine pentads per quarter-degree grid cell), the range-change map, showing estimated changes in
relative abundance between SABAP1 and SABAP2, and a table which provides counts of the numbers of grid cells shaded each of six colours in the range change map. In contrast to earlier papers in this series, minimal commentary on each species is provided.
Pied Kingfisher Ceryle rudis
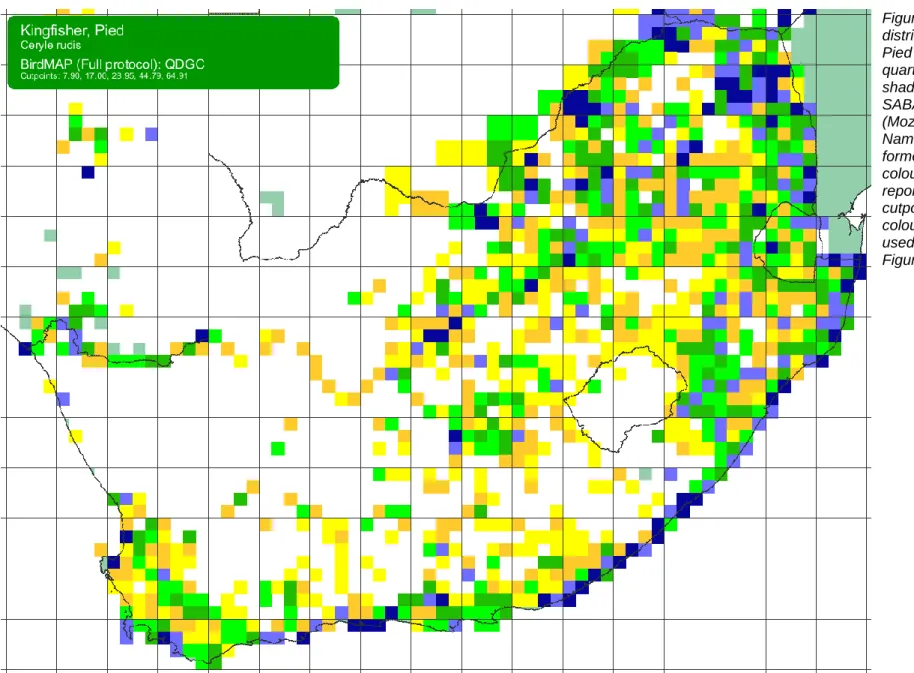
During SABAP1, the Pied Kingfisher (Figure 1) was recorded along the southern and eastern coast of South Africa, continuing into the northern, more mesic interior of South Africa (Figure 2). The species followed a distinctive pattern along the Orange River in the Northern Cape. The same broad pattern is visible in the SABAP2 distribution, but on the finer pentad scale resolution (Figure 3). Overall, there appear to be more grid cells in which the species has decreased rather than it has increased (Figure 4, Table 1).
Figure 1. Pied Kingfisher, Rietvlei Nature Reserve, Gauteng. Photographer © Robbie Aspeling. Record 1991 in the BirdPix section of the ADU Virtual Museum. Full details at http://vmus.adu.org.za/?vm=BirdPix-1991
Figure 2. SABAP1 distribution map for the Pied Kingfisher. Note that quarter degree grid cells shaded turquoise had no SABAP1 data
(Mozambique, Botswana, Namibia and one in the former Transkei). The colours represent reporting rates, and the cutpoints for the different colours are the same as used for SABAP2, see Figure 3.
Figure 3. SABAP2 distri- bution map for the Pied Kingfisher, downloaded 4 April 2017. The detailed interpretation of this map is provided by Underhill &
Brooks (2016a) and see text. Pentads with four or more checklists are either shaded white, species not recorded, or in colour, with shades based on reporting rate: yellow 0–
7.9%, orange 7.9–17.0%, light green 17.0–28.9%, dark green 28.9–44.8%, light blue 44.8–64.9% and dark blue 64.9–100%.
Figure 4. Range-change map between SABAP1 and SABAP2 for the Pied Kingfisher, downloaded 12 April 2017. Red, orange and yellow represent quarter-degree grid cells with very large, large, and small relative decreases and blue, dark green and light green represent grid cells with very large, large and small relative increases.
A count of the number of grid cells in each category is provided in Table 1.
Only grid cells with at least four checklists in both SABAP1 and SABAP2 are shown.
Fuller information on the interpretation of this range-change map is provided in Underhill &
Brooks (2016b).
Table 1. Range-change summary for the Pied Kingfisher between SABAP1 and SABAP2. Numbers (and percentages) in each colour category of Figure 4, for which there are at least four checklists per quarter degree grid cell in both SABAP1 and SABAP2. Also shown are the same summaries when the analysis is restricted to grid cells with at least 30 checklists for both SABAP1 and SABAP2.
Status 4+ checklist for SABAP1 and SABAP2
30+ checklist for SABAP1 and SABAP2
Count % Count %
Red (very large decrease) 454 39 207 35
Orange (large decrease) 219 19 150 26
Yellow (small decrease) 134 12 89 15
Light green (small
increase) 100 9 65 11
Dark green (large increase) 75 7 36 6
Blue (very large increase) 168 15 41 7
Total 1150 100 588 100
Giant Kingfisher Megaceryle maximus
Overall, the Giant Kingfisher (Figure 5) follows a similar distribution pattern to the Pied Kingfisher. Both follow a distinctive linear distribution along the Orange River in the Northern Cape. This pattern can be seen in both the SABAP1 and SABAP2 distribution maps (Figures 6 & 7). Overall, there appear to be more grid cells in which the species has decreased rather than increased (Figure 8, Table 2).
Figure 5. Male Giant Kingfisher, quarter degree grid cell 2231AC, Limpopo.
Photographer © Lia Steen. Record 31 in the BirdPix section of the ADU Virtual Museum. Full details at http://vmus.adu.org.za/?vm=BirdPix-31
Figure 6. SABAP1 distribution map for the Giant KIngfisher. Note that quarter degree grid cells shaded turquoise had no SABAP1 data (Mozambique, Botswana, Namibia and one in the former Transkei). The colours represent reporting rates, and the cutpoints for the different colours are the same as those used for SABAP2, see Figure 7.
Figure 7. SABAP2 distri- bution map for the Giant Kingfisher, downloaded 4 April 2017. The detailed interpretation of this map is provided by Underhill &
Brooks (2016a) and see text. Pentads with four or more checklists are either shaded white, species not recorded, or in colour, with shades based on reporting rate: yellow 0–
6.1%, orange 6.1–10.6%, light green 10.6–17.1%, dark green 17.1–24.9%, light blue 24.9–38.5% and dark blue 38.5–100%.
Figure 8. Range-change map between SABAP1 and SABAP2 for the Giant Kingfisher, downloaded 11 April 2017. Red, orange and yellow represent quarter- degree grid cells with very large, large, and small relative decreases and blue, dark green and light green represent grid cells with very large, large and small relative increases.
A count of the number of grid cells in each category is provided in Table 2.
Only grid cells with at least four checklists in both SABAP1 and SABAP2 are shown.
Fuller information on the interpretation of this range-change map is provided in Underhill &
Brooks (2016b).
Table 2. Range-change summary for the Giant Kingfisher between SABAP1 and SABAP2. Numbers (and percentages) in each colour category of Figure 8, for which there are at least four checklists per quarter degree grid cell in both SABAP1 and SABAP2. Also shown are the same summaries when the analysis is restricted to grid cells with at least 30 checklists for both SABAP1 and SABAP2.
Status 4+ checklist for SABAP1 and SABAP2
30+ checklist for SABAP1 and SABAP2
Count % Count %
Red (very large decrease) 414 39 196 34
Orange (large decrease) 208 19 158 27
Yellow (small decrease) 99 9 68 12
Light green (small
increase) 69 6 48 8
Dark green (large increase) 100 9 49 8
Blue (very large increase) 178 17 60 10
Total 1068 100 579 100
Half-collared Kingfisher Alcedo semitorquata
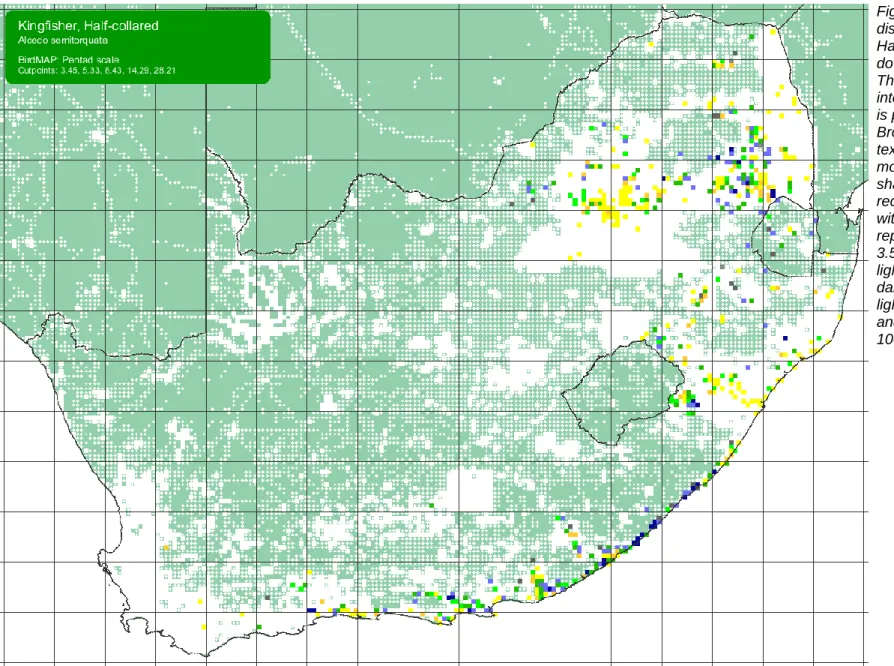
During SABAP1, the Half-collared Kingfisher (Figure 9) – the most typical habitat is along fast flowing mountain streams – was recorded along the coastal plain, and in the north-eastern parts of South Africa (Figure 10). This distribution pattern continues in SABAP2 (Figure 11).
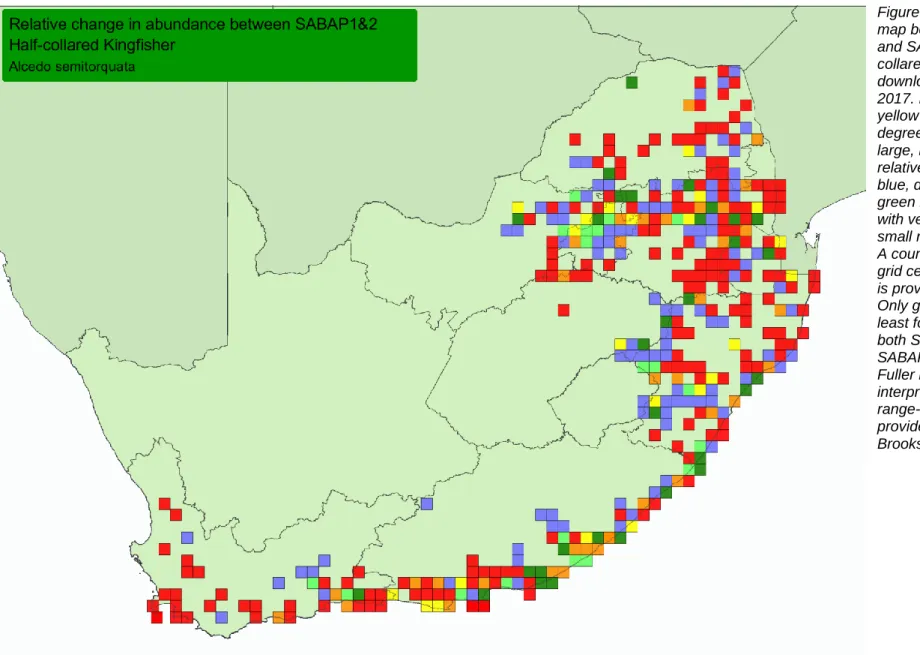
There are many scattered decreases across the country (Figure 12, Table 3). The regional conservation status of the Half-collared Kingfisher is “Near-threatened” (Taylor et al. 2015).
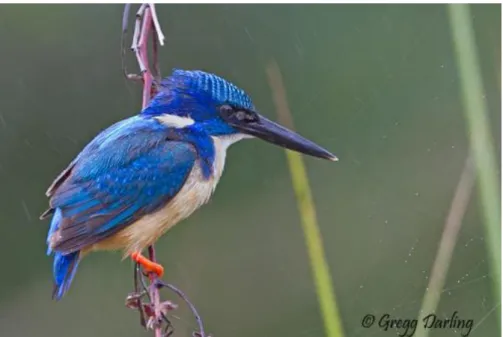
Figure 9. Half-collared Kingfisher, Honeyclough, Eastern Cape.
Photographer © Gregg Darling and Des Darling. Record 4609 in the BirdPix section of the ADU Virtual Museum. Full details at
http://vmus.adu.org.za/?vm=BirdPix-4609
Figure 10. SABAP1 distribution map for the Half-collared Kingfisher.
Note that quarter degree grid cells shaded turquoise had no SABAP1 data
(Mozambique, Botswana, Namibia and one in the former Transkei). The colours represent reporting rates, and the cutpoints for the different colours are the same as those used for SABAP2, see Figure 11.
Figure 11. SABAP2 distribution map for the Half-collared Kingfisher, downloaded 4 April 2017.
The detailed
interpretation of this map is provided by Underhill &
Brooks (2016a) and see text. Pentads with four or more checklists are either shaded white, species not recorded, or in colour, with shades based on reporting rate: yellow 0–
3.5%, orange 3.5–5.3%, light green 5.3–8.4%, dark green 8.4–14.3%, light blue 14.3–28.2%
and dark blue 28.2–
100%.
Figure 12. Range-change map between SABAP1 and SABAP2 for the Half- collared Kingfisher, downloaded 11 April 2017. Red, orange and yellow represent quarter- degree grid cells with very large, large, and small relative decreases and blue, dark green and light green represent grid cells with very large, large and small relative increases.
A count of the number of grid cells in each category is provided in Table 3.
Only grid cells with at least four checklists in both SABAP1 and SABAP2 are shown.
Fuller information on the interpretation of this range-change map is provided in Underhill &
Brooks (2016b).
Table 3. Range-change summary for the Half-collared Kingfisher between SABAP1 and SABAP2. Numbers (and percentages) in each colour category of Figure 12, for which there are at least four checklists per quarter degree grid cell in both SABAP1 and SABAP2. Also shown are the same summaries when the analysis is restricted to grid cells with at least 30 checklists for both SABAP1 and SABAP2.
Status 4+ checklist for SABAP1 and SABAP2
30+ checklist for SABAP1 and SABAP2
Count % Count %
Red (very large decrease) 181 46 132 44
Orange (large decrease) 38 10 34 11
Yellow (small decrease) 22 6 19 6
Light green (small
increase) 19 5 18 6
Dark green (large increase) 31 8 28 9
Blue (very large increase) 100 26 72 24
Total 391 100 303 100
Malachite Kingfisher Alcedo cristata
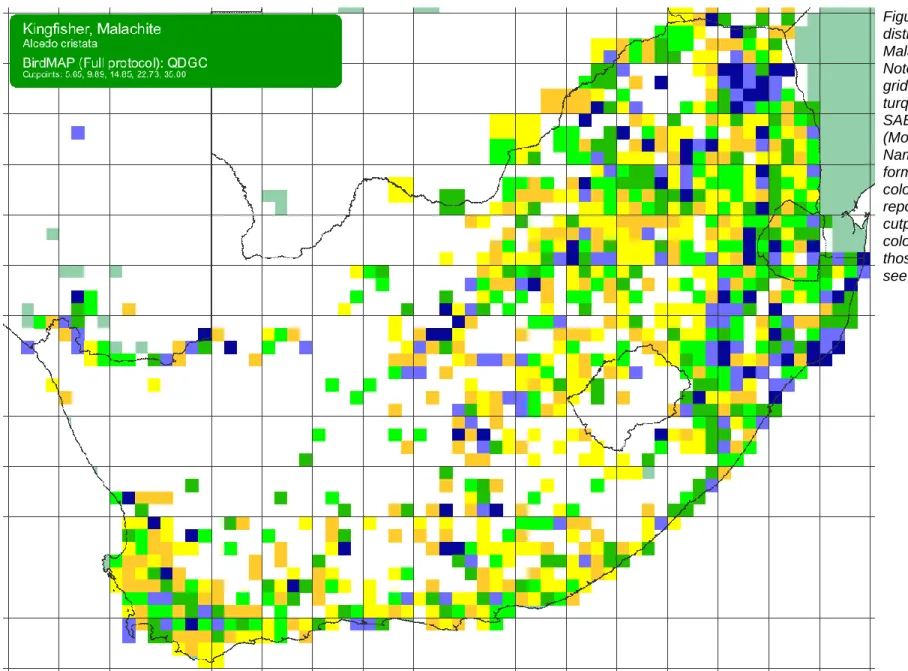
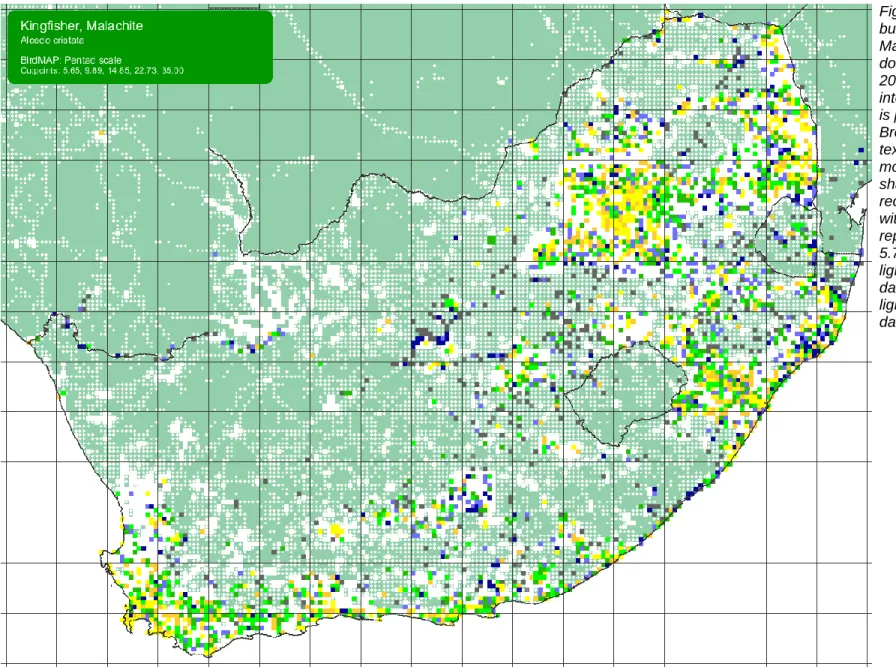
In broad terms, the Malachite Kingfisher (Figure 13) had the same distribution for SABAP1 (Figure 14) as it has for SABAP2 (Figure 15).
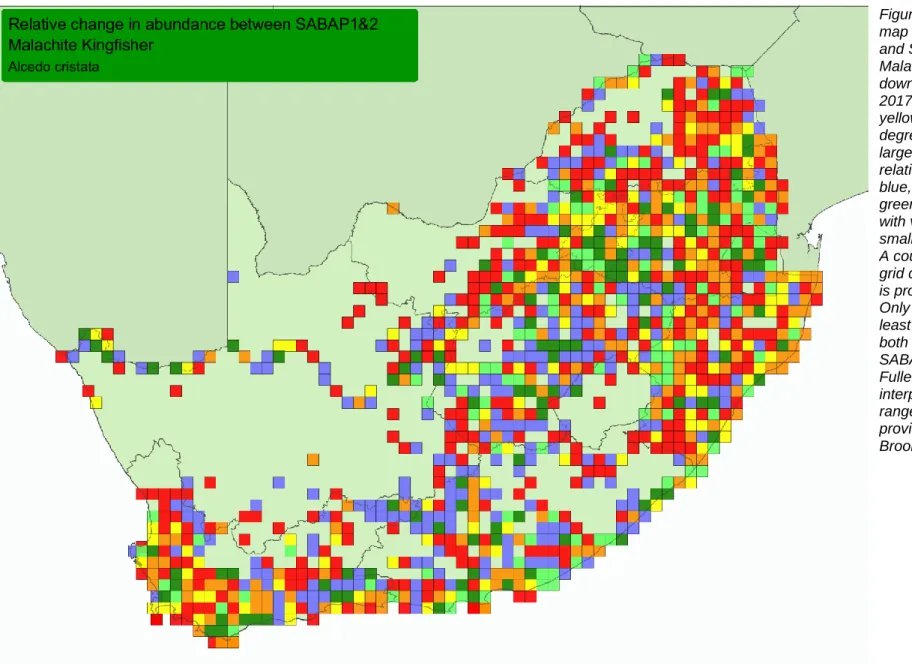
As with the Pied and Giant Kingfishers, it occurs throughout the mesic eastern and southern zones of the South Africa, with a distribution trail that follows the Orange River through the arid Northern Cape. There are more grid cells showing decreases than increases, and these seem scattered across the country without any obvious regional patterning (Figure 16, Table 4).
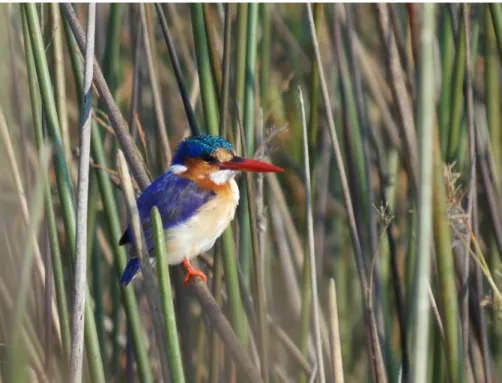
Figure 13. Malachite Kingfisher, Okavango Delta, Botswana. This is the pale- fronted subspecies which occurs in northern Botswana. Photographer © David Kennedy. Record 598 in the BirdPix section of the ADU Virtual Museum. Full details at http://vmus.adu.org.za/?vm=BirdPix-598
Figure 14. SABAP1 distribution map for the Malachite Kingfisher.
Note that quarter degree grid cells shaded turquoise had no SABAP1 data
(Mozambique, Botswana, Namibia and one in the former Transkei). The colours represent reporting rates, and the cutpoints for the different colours are the same as those used for SABAP2, see Figure 15.
Figure 15. SABAP2 distri- bution map for the Malachite Kingfisher, downloaded 11 April 2017. The detailed interpretation of this map is provided by Underhill &
Brooks (2016a) and see text. Pentads with four or more checklists are either shaded white, species not recorded, or in colour, with shades based on reporting rate: yellow 0–
5.7%, orange 5.7–9.9%, light green 9.9–14.9%, dark green 14.9–22.7%, light blue 22.7–35.0% and dark blue 35.0–100%.
Figure 16. Range-change map between SABAP1 and SABAP2 for the Malachite Kingfisher, downloaded 12 April 2017. Red, orange and yellow represent quarter- degree grid cells with very large, large, and small relative decreases and blue, dark green and light green represent grid cells with very large, large and small relative increases.
A count of the number of grid cells in each category is provided in Table 4.
Only grid cells with at least four checklists in both SABAP1 and SABAP2 are shown.
Fuller information on the interpretation of this range-change map is provided in Underhill &
Brooks (2016b).
Table 4. Range-change summary for the Malachite Kingfisher between SABAP1 and SABAP2. Numbers (and percentages) in each colour category of Figure 16, for which there are at least four checklists per quarter degree grid cell in both SABAP1 and SABAP2. Also shown are the same summaries when the analysis is restricted to grid cells with at least 30 checklists for both SABAP1 and SABAP2.
Status 4+ checklist for SABAP1 and SABAP2
30+ checklist for SABAP1 and SABAP2
Count % Count %
Red (very large decrease) 347 30 150 25
Orange (large decrease) 190 17 131 22
Yellow (small decrease) 131 11 84 14
Light green (small
increase) 116 10 81 14
Dark green (large increase) 117 10 72 12
Blue (very large increase) 246 21 77 13
Total 1147 100 595 100
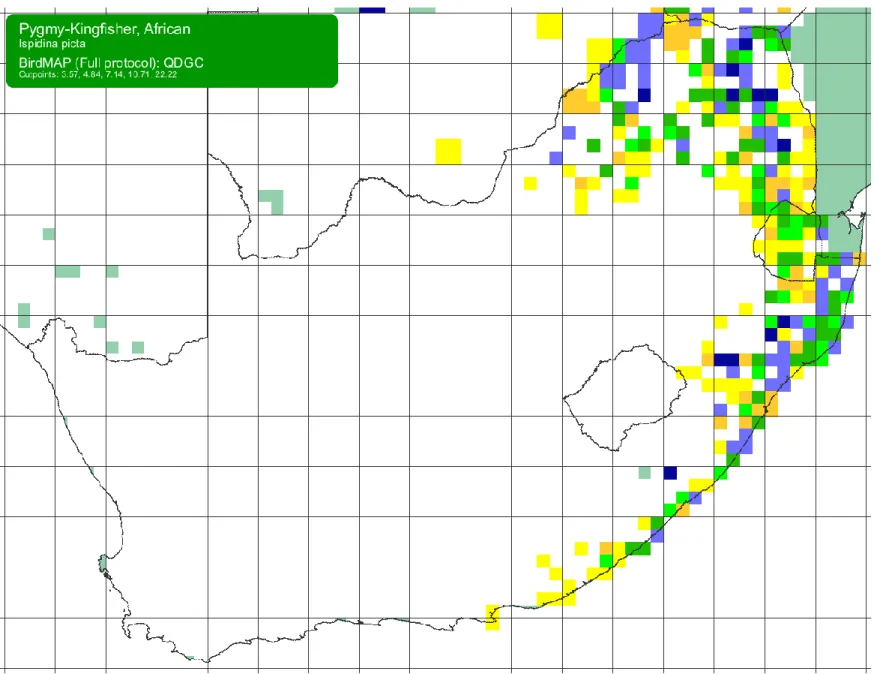
African Pygmy-Kingfisher Ispidina picta
During SABAP1, the African Pygmy-Kingfisher (Figure 17) was recorded along the coast of the Eastern Cape province, northwards through Swaziland, and the Kruger National Park, extending westwards mainly across Limpopo province (Figure 18). The SABAP2 distribution follows this same overall pattern (Figure 19). However, very large and large decreases are estimated to have occurred in about 50% of its grid cells (Figure 20, Table 5). However, the blue quarter degree grid cells in Figure 20 are mainly on the western edge of the distribution, hinting at the possibility of a minor westwards range expansion for the African Pygmy-Kingfisher.
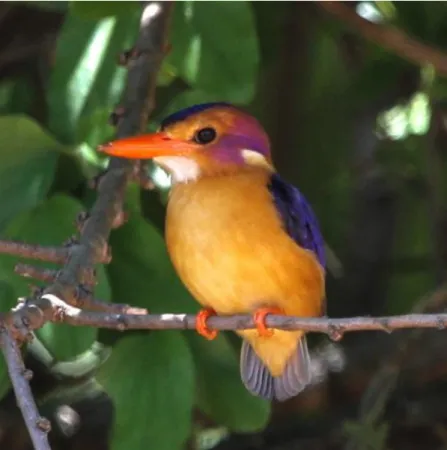
Figure 17. African Pygmy-Kingfisher, Tshipise, Limpopo.
Photographer © John Wilkinson. Record 1148 in the BirdPix section of the ADU Virtual Museum. Full details at
http://vmus.adu.org.za/?vm=BirdPix-1148
Figure 18. SABAP1 distribution map for the African Pygmy-Kingfisher.
Note that quarter degree grid cells shaded turquoise had no SABAP1 data
(Mozambique, Botswana, Namibia and one in the former Transkei). The colours represent reporting rates, and the cutpoints for the different colours are the same as used for SABAP2, see Figure 19.
Figure 19. SABAP2 distri- bution map for the African Pygmy-Kingfisher, down- loaded 11 April 2017. The detailed interpretation of this map is provided by Underhill & Brooks (2016a) and see text.
Pentads with four or more checklists are either shaded white, species not recorded, or in colour, with shades based on reporting rate: yellow 0–
3.6%, orange 3.6–4.8%, light green 4.8–7.1%, dark green 7.1–10.7%, light blue 10.7–22.2% and dark blue 22.2–100%.
Figure 20. Range-change map between SABAP1 and SABAP2 for the African Pygmy-Kingfisher, downloaded 11 April 2017. Red, orange and yellow represent quarter- degree grid cells with very large, large, and small relative decreases and blue, dark green and light green represent grid cells with very large, large and small relative increases.
A count of the number of grid cells in each category is provided in Table 5.
Only grid cells with at least four checklists in both SABAP1 and SABAP2 are shown.
Fuller information on the interpretation of this range-change map is provided in Underhill &
Brooks (2016b).
Table 5. Range-change summary for the African Pygmy-Kingfisher between SABAP1 and SABAP2. Numbers (and percentages) in each colour category of Figure 20, for which there are at least four checklists per quarter degree grid cell in both SABAP1 and SABAP2. Also shown are the same summaries when the analysis is restricted to grid cells with at least 30 checklists for both SABAP1 and SABAP2.
Status 4+ checklist for SABAP1 and SABAP2
30+ checklist for SABAP1 and SABAP2
Count % Count %
Red (very large decrease) 142 40 81 35
Orange (large decrease) 45 13 39 17
Yellow (small decrease) 26 7 21 9
Light green (small
increase) 21 6 18 8
Dark green (large increase) 23 6 13 6
Blue (very large increase) 101 28 58 25
Total 358 100 230 100
Woodland Kingfisher Halcyon senegalensis
The Woodland Kingfisher (Figure 21) is a breeding migrant to the atlas region from November to April, moving to central Africa during the remainder of the year. During SABAP1 it was recorded in the savanna woodland of South Africa north of 26°N, extending southward in eastern Swaziland and north-eastern KwaZulu-Natal (Figure 22).
There was a distinct gap separating eastern and western populations in Limpopo (Figure 22). The same overall pattern is forming in SABAP2 (Figure 23). Two-thirds of quarter degree grid cells show increases, with almost a third showing very large increases (Table 4).
The range-change map (Figure 24) hints at a range expansion to the south for the Woodland Kingfisher.
Figure 21. Woodland Kingfisher, Manyeleti Game Reserve, Limpopo.
Photographer © Vaughan Jessnitz. Record 1862 in the BirdPix section of the ADU Virtual Museum. Full details at
http://vmus.adu.org.za/?vm=BirdPix-1862
Figure 22. SABAP1 distribution map for the Woodland Kingfisher.
Note that quarter degree grid cells shaded turquoise had no SABAP1 data
(Mozambique, Botswana, Namibia and one in the former Transkei). The colours represent reporting rates, and the cutpoints for the different colours are the same as used for SABAP2, see Figure 23.
Figure 23. SABAP2 distri- bution map for the Woodland Kingfisher, downloaded 4 April 2017.
The detailed
interpretation of this map is provided by Underhill &
Brooks (2016a) and see text. Pentads with four or more checklists are either shaded white, species not recorded, or in colour, with shades based on reporting rate: yellow 0–
9.1%, orange 9.1–18.6%, light green 18.6–27.6%, dark green 27.6–36.7%, light blue 36.7–46.2% and dark blue 46.2–100%.
Figure 24. Range-change map between SABAP1 and SABAP2 for the Woodland Kingfisher.
downloaded 12 April 2017. Red, orange and yellow represent quarter- degree grid cells with very large, large, and small relative decreases and blue, dark green and light green represent grid cells with very large, large and small relative increases.
A count of the number of grid cells in each category is provided in Table 6.
Only grid cells with at least four checklists in both SABAP1 and SABAP2 are shown.
Fuller information on the interpretation of this range-change map is provided in Underhill &
Brooks (2016b).
Table 6. Range-change summary for the Woodland Kingfisher between SABAP1 and SABAP2. Numbers (and percentages) in each colour category of Figure 24, for which there are at least four checklists per quarter degree grid cell in both SABAP1 and SABAP2. Also shown are the same summaries when the analysis is restricted to grid cells with at least 30 checklists for both SABAP1 and SABAP2.
Status 4+ checklist for SABAP1 and SABAP2
30+ checklist for SABAP1 and SABAP2
Count % Count %
Red (very large decrease) 35 11 15 8
Orange (large decrease) 31 10 16 9
Yellow (small decrease) 49 15 28 16
Light green (small
increase) 46 14 34 19
Dark green (large increase) 60 19 34 19
Blue (very large increase) 99 31 53 29
Total 320 100 180 100
Mangrove Kingfisher Halcyon senegaloides
The Mangrove Kingfisher (Figure 25) is classified regionally as
“Endangered” (Taylor et al. 2015). It is coastal species, associated with streams and rivers in coastal forest and with mangrove swamps.
The SABAP1 showed a fairly continuous distribution along the coastlines of KwaZulu-Natal and the former Transkei region of the Eastern Cape (Figure 26). The finer scale SABAP2 distribution reveals now fragmented this distribution of the Mangrove Kingfisher really is (Figure 27). The range-change map shows population decreases in the most developed and populated part of the KwaZulu-Natal coastline, in the south of the province (Figure 28). There is a fairly even distribution of increases and decreases in grid cells for this species (Table 7).
Figure 25. Mangrove Kingfisher, Sofala, Mozambique. Photographer © M Booysen. Record 10676 in the BirdPix section of the ADU Virtual Museum.
Full details at http://vmus.adu.org.za/?vm=BirdPix-10676
Figure 26. SABAP1 distribution map for the Mangrove Kingfisher.
Note that quarter degree grid cells shaded turquoise had no SABAP1 data
(Mozambique, Botswana, Namibia and one in the former Transkei). The colours represent reporting rates, and the cutpoints for the different colours are the same as used for SABAP2, see Figure 27.
Figure 27. SABAP2 distri- bution map for the Mangrove Kingfisher downloaded 4 April 2017.
The detailed
interpretation of this map is provided by Underhill &
Brooks (2016a) and see text. Pentads with four or more checklists are either shaded white, species not recorded, or in colour, with shades based on reporting rate: yellow 0–
7.4%, orange 7.4–16.7%, light green 16.7–20.0%, dark green 20.0–29.5%, light blue 29.5–50.0% and dark blue 50.0–100%.
Figure 28. Range-change map between SABAP1 and SABAP2 for the Mangrove Kingfisher.
downloaded 12 April 2017. Red, orange and yellow represent quarter- degree grid cells with very large, large, and small relative decreases and blue, dark green and light green represent grid cells with very large, large and small relative increases.
A count of the number of grid cells in each category is provided in Table 7.
Only grid cells with at least four checklists in both SABAP1 and SABAP2 are shown.
Fuller information on the interpretation of this range-change map is provided in Underhill &
Brooks (2016b).
Table 7. Range-change summary for the Mangrove Kingfisher between SABAP1 and SABAP2. Numbers (and percentages) in each colour category of Figure 28, for which there are at least four checklists per quarter degree grid cell in both SABAP1 and SABAP2. Also shown are the same summaries when the analysis is restricted to grid cells with at least 30 checklists for both SABAP1 and SABAP2.
Status 4+ checklist for SABAP1 and SABAP2
30+ checklist for SABAP1 and SABAP2
Count % Count %
Red (very large decrease) 10 34 7 35
Orange (large decrease) 3 10 2 10
Yellow (small decrease) 1 3 0 0
Light green (small
increase) 3 10 1 5
Dark green (large increase) 4 14 3 15
Blue (very large increase) 8 28 7 35
Total 29 100 20 100
Grey-headed Kingfisher Halcyon leucocephala
The Grey-headed Kingfisher (Figure 29) is a relatively uncommon species in the atlas region, far more abundant farther north. During SABAP1, it was recorded mainly in the Kruger National Park and the Limpopo River valley, with scattered records farther south (Figure 30).
The SABAP2 distribution is similar, but the extent of fragmentation of occurrence is clearly revealed (Figure 31). The range-change map hints at a increase in abundance in south-western Limpopo, and the adjacent sections of Mpumalanga, Gauteng and North West (Figure 32). Overall, there are more grid cells showing increases in abundance for the Grey-headed Kingfisher than cells showing decreases (Figure 32, Table 8).
Figure 29. Grey-headed Kingfisher, on the coastline of Lake Malawi,
Malawi. Photographer © Gary Brown and Fiona Brown. Record 17603 in the BirdPix section of the ADU Virtual Museum. Full details at
http://vmus.adu.org.za/?vm=BirdPix-17603
Nd thkkkkkkkkkkk
Figure 30. SABAP1 distribution map for the Grey-headed Kingfisher.Note that quarter degree grid cells shaded turquoise had no SABAP1 data
(Mozambique, Botswana, Namibia and one in the former Transkei). The colours represent reporting rates, and the cutpoints for the different colours are the same as used for SABAP2, see Figure 31.
Figure 31. SABAP2 distri- bution map for the Grey- headed Kingfisher, downloaded 12 April 2017. The detailed interpretation of this map is provided by Underhill &
Brooks (2016a) and see text. Pentads with four or more checklists are either shaded white, species not recorded, or in colour, with shades based on reporting rate: yellow 0–
4.4%, orange 4.4–6.7%, light green 6.7–10.0%, dark green 10.0–16.7%, light blue 16.7–27.9% and dark blue 27.9–100%.
Figure 32. Range-change map between SABAP1 and SABAP2 for the Grey-headed Kingfisher.
downloaded 11 April 2017. Red, orange and yellow represent quarter- degree grid cells with very large, large, and small relative decreases and blue, dark green and light green represent grid cells with very large, large and small relative increases.
A count of the number of grid cells in each category is provided in Table 8.
Only grid cells with at least four checklists in both SABAP1 and SABAP2 are shown.
Fuller information on the interpretation of this range-change map is provided in Underhill &
Brooks (2016b).
Table 8. Range-change summary for the Grey-headed Kingfisher between SABAP1 and SABAP2. Numbers (and percentages) in each colour category of Figure 32, for which there are at least four checklists per quarter degree grid cell in both SABAP1 and SABAP2. Also shown are the same summaries when the analysis is restricted to grid cells with at least 30 checklists for both SABAP1 and SABAP2.
Status 4+ checklist for SABAP1 and SABAP2
30+ checklist for SABAP1 and SABAP2
Count % Count %
Red (very large decrease) 40 30 22 27
Orange (large decrease) 15 11 8 10
Yellow (small decrease) 9 7 8 10
Light green (small
increase) 6 4 5 6
Dark green (large increase) 11 8 11 13
Blue (very large increase) 54 40 28 34
Total 135 100 82 100
Brown-hooded Kingfisher Halcyon albiventris
During SABAP1, the core of the distribution of the Brown-hooded Kingfisher (Figure 33) in the atlas region was in the savanna woodlands along the escarpment in Limpopo and Mpumalanga, continuing southwards through Swaziland and along the coastal plain of KwaZulu-Natal (Figure 34). It occurred throughout the woodland north of 26°S. The grid cells shaded yellow and orange in the Free State and the Western Cape had then fairly recently been colonized.
The SABAP2 distribution, on the finer pentad grid scale (Figure 35), provides a more detailed description of the range of the Brown-hooded Kingfisher. The coarse-scaled distribution across the Free State and Western Cape is replaced by a more nuanced distribution, highlighting that the distributions here are fragmented.
Figure 33 Brown-hooded Kingfisher, Mpumalanga. Photographer © Derek Solomon. Record 9740 in the BirdPix section of the ADU Virtual Museum.
Full details at http://vmus.adu.org.za/?vm=BirdPix-9740
Between SABAP1 and SABAP2, the distribution of the Brown- hooded Kingfisher has continued to expand; the area west of Kimberley has been colonised and so has the southern Karoo (Figure 36). Records are starting to occur along the Orange River (Figures 35 and 36). In Table 9, the percentages of grid cells in Figure 36 of each colour are fairly even. Although details of
distribution patterns in the atlas region appear to be changing, overall
abundance has probably not changed a great deal .
Figure 34. SABAP1 distribution map for the Brown-hooded Kingfisher.
Note that quarter degree grid cells shaded turquoise had no SABAP1 data
(Mozambique, Botswana, Namibia and one in the former Transkei). The colours represent reporting rates, and the cutpoints for the different colours are the same as used for SABAP2, see Figure 35.
Figure 35. SABAP2 distri- bution map for the Brown- hooded Kingfisher, downloaded 12 April 2017. The detailed interpretation of this map is provided by Underhill &
Brooks (2016a) and see text. Pentads with four or more checklists are either shaded white, species not recorded, or in colour, with shades based on reporting rate: yellow 0–
15.2%, orange 15.2–
28.8%, light green 28.8–
43.8%, dark green 43.8–
57.9%, light blue 57.9–
73.7% and dark blue 73.7–100%.
Figure 36. Range-change map between SABAP1 and SABAP2 for the Brown-hooded Kingfisher.
downloaded 12 April 2017. Red, orange and yellow represent quarter- degree grid cells with very large, large, and small relative decreases and blue, dark green and light green represent grid cells with very large, large and small relative increases.
A count of the number of grid cells in each category is provided in Table 9.
Only grid cells with at least four checklists in both SABAP1 and SABAP2 are shown.
Fuller information on the interpretation of this range-change map is provided in Underhill &
Brooks (2016b).
Table 9. Range-change summary for the Brown-hooded Kingfisher between SABAP1 and SABAP2. Numbers (and percentages) in each colour category of Figure 36, for which there are at least four checklists per quarter degree grid cell in both SABAP1 and SABAP2. Also shown are the same summaries when the analysis is restricted to grid cells with at least 30 checklists for both SABAP1 and SABAP2.
Status 4+ checklist for SABAP1 and SABAP2
30+ checklist for SABAP1 and SABAP2
Count % Count %
Red (very large decrease) 193 19 74 15
Orange (large decrease) 189 19 113 23
Yellow (small decrease) 159 16 91 18
Light green (small
increase) 136 14 83 17
Dark green (large increase) 123 12 62 12
Blue (very large increase) 199 20 75 15
Total 999 100 498 100
Striped Kingfisher Halcyon chelicuti
The SABAP1 distribution of the Striped Kingfisher (Figure 37) was is broadly similar to that of the Woodland Kingfisher (Figure 38, compare with Figure 22): the woodland savanna north of 26°S, eastern Swaziland and north-eastern KwaZulu-Natal. The SABAP2 distribution shows essentially the same overall pattern (Figure 39).
However, the range-change map (Figure 40) indicates that, unlike the Woodland Kingfisher, this is species which might be getting into a steep decrease; 47% of grid cells are shaded red, indicating very large decreases in abundance, and a further 12% have large decreases, making a total of 59% of grid cells with either very large, or large, decreases (Figure 40, Table 9). The Striped Kingfisher is a species that needs, in the atlas region at least, to be put on the “conservation watch list.”
Figure 37. Striped Kingfisher, St. Lucia, KwaZulu Natal. Photographer © Richard Alan Johnstone. Record 24276 in the BirdPix section of the ADU Virtual Museum. Full details at http://vmus.adu.org.za/?vm=BirdPix-24276
Figure 38. SABAP1 distribution map for the Striped Kingfisher. Note that quarter degree grid cells shaded turquoise had no SABAP1 data (Mozambique, Botswana, Namibia and one in the former Transkei). The colours represent reporting rates, and the cutpoints for the different colours are the same as used for SABAP2, see Figure 39.
Figure 39. SABAP2 distri- bution map for the Striped Kingfisher, downloaded 12 April 2017. The detailed interpretation of this map is provided by Underhill & Brooks (2016a) and see text.
Pentads with four or more checklists are either shaded white, species not recorded, or in colour, with shades based on reporting rate: yellow 0–
4.9%, orange 4.9–9.1%, light green 9.1–17.9%, dark green 17.9–27.9%, light blue 27.9–47.1% and dark blue 47.1–100%.
Figure 40. Range-change map between SABAP1 and SABAP2 for the Striped Kingfisher.
downloaded 11 April 2017. Red, orange and yellow represent quarter- degree grid cells with very large, large, and small relative decreases and blue, dark green and light green represent grid cells with very large, large and small relative increases.
A count of the number of grid cells in each category is provided in Table 10.
Only grid cells with at least four checklists in both SABAP1 and SABAP2 are shown.
Fuller information on the interpretation of this range-change map is provided in Underhill &
Brooks (2016b).
Table 10. Range-change summary for the Striped Kingfisher between SABAP1 and SABAP2. Numbers (and percentages) in each colour category of Figure 40, for which there are at least four checklists per quarter degree grid cell in both SABAP1 and SABAP2. Also shown are the same summaries when the analysis is restricted to grid cells with at least 30 checklists for both SABAP1 and SABAP2
Status 4+ checklist for SABAP1 and SABAP2
30+ checklist for SABAP1 and SABAP2
Count % Count %
Red (very large decrease) 179 47 75 41
Orange (large decrease) 47 12 25 14
Yellow (small decrease) 36 9 21 12
Light green (small
increase) 20 5 13 7
Dark green (large increase) 19 5 11 6
Blue (very large increase) 79 21 36 20
Total 380 100 181 100
Acknowledgements
This paper is part of a series which celebrates the contributions of thousands of citizen scientists to the databases of the first and second bird atlas projects in southern Africa (SABAP1 and SABAP2). From 2007 to March 2017, SABAP2 (Underhill 2016) was a partnership project of SANBI (South African National Biodiversity Institute), BirdLife South Africa and the Animal Demography Unit in the Department of Biological Sciences at the University of Cape Town.
Vincent Parker made valuable input.
References
Taylor MR, Peacock F, Wanless RM (eds) 2015. The 2015 Eskom Red Data Book of birds of South Africa, Lesotho and Swaziland.
BirdLife South Africa, Johannesburg.
Underhill LG 2016. The fundamentals of the SABAP2 protocol.
Biodiversity Observations 7.42: 1–12. Available online at
http://bo.adu.org.za/content.php?id=235Underhill LG, Brooks M 2016a. Pentad-scale distribution maps for bird atlas data. Biodiversity Observations 7.52: 1–8. Available online at http://bo.adu.org.za/content.php?id=245
Underhill LG, Brooks M 2016b. Displaying changes in bird distributions between SABAP1 and SABAP2. Biodiversity Observations 7.62: 1–13. Available online at
http://bo.adu.org.za/content.php?id=255