This is because resistance to blotch in most genotypes in Zambia is insufficient. Many thanks to CIMMYT- Mexico for providing some of the wheat germplasm I used in the study.
Socio-economic constraints
Abiotic constraints
In view of the above, there is a need to breed for heat tolerance to improve wheat production and productivity in Zambia as most of the cultivars grown are not heat resistant.
Biotic constraints
A study by Joshi et al. 2004) showed three additional genes controlling the inheritance of resistance to blotch disease in wheat. Therefore, this study was designed to determine the mode of action of genes of inheritance of blotch disease resistance in rain-fed wheat cultivars.
Research objectives
Identification of a source of resistance in wheat germ to the blotch disease caused by Bipolaris sorokiniana. McNab, editors, Proceedings of the International Workshop on Helminthosporium blight of wheat: Spot Blotch and Tan Spot.
Introduction
Origin and history of wheat
Rain-fed wheat production in Zambia
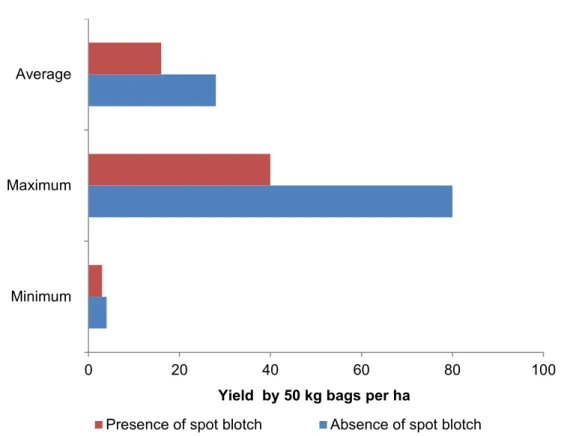
Spotted spot (Helminthosprium spp.) is the most devastating of the diseases causing high yield losses of more than 85% (Raemaekers, 1988). Thus, the productivity of rain-fed wheat could be improved by using varieties resistant to blotch.
Spot blotch disease and its distribution
Some of which include higher incidences of foliar diseases (Helminthosprium spp. and leaf rust) and aluminum toxicity (Mooleki, 1997).
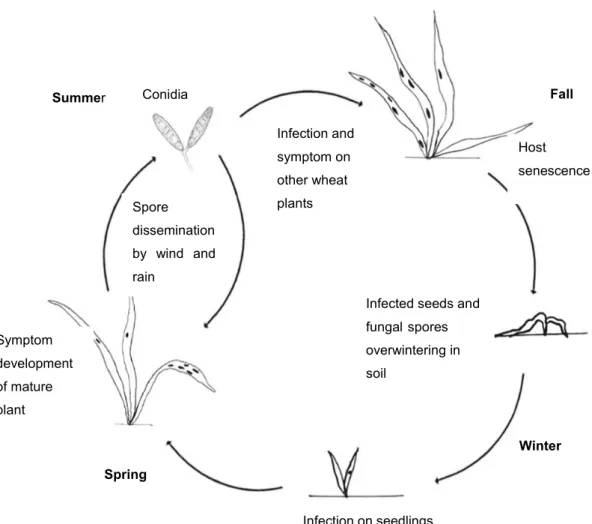
The pathogen ( Bipolaris sorokiniana (Sacc.) Shoem) and its life cycle
This means that the infected seed provides inoculum for the growing plant (Duveiller and Dubin, 2002; Malaker et al., 2008). Researchers including Duveiller and Gilchrist (1994) and Reis et al. 1998) showed that spores for Bipolaris sorokiniana (Sacc.) Shoem could survive in soil for about thirty-seven months.
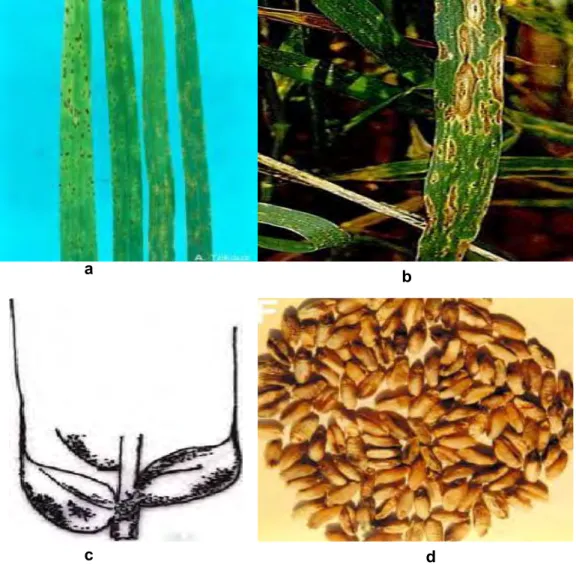
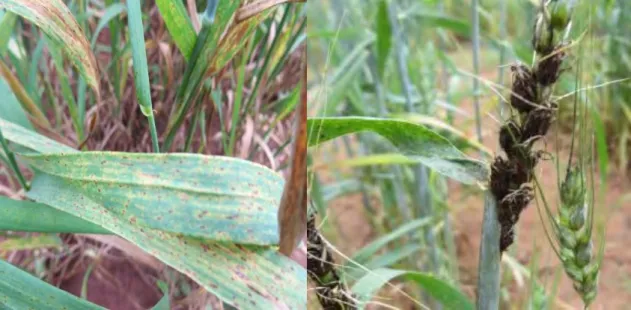
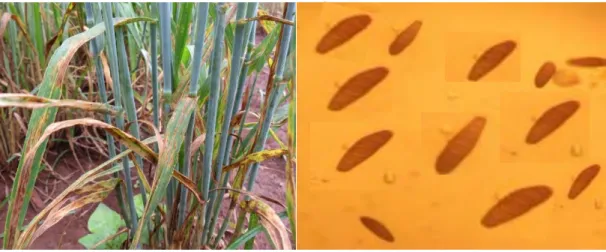
Symptoms of spot blotch on wheat
Effects of spot blotch on wheat
In Zambia, yield losses of over 85% have been reported due to spotting during the summer rainy season (Raemaekers, 1988). In severe infection, complete crop loss (100%) due to leaf spot is possible because the disease attacks all plant parts (Joshi and Chand, 2002; Duveiller et al., 2005).
Management of spot blotch disease
In Zambia for example, delayed summer planting will be important to reduce disease infection as early planting favors the development of spotted spot disease (Aulakh and Rimkus, 1988). In addition to these methods discussed above, the use of varietal mixtures has been reported as a potential alternative for reducing the development of leaf spot disease (Sharma and Dubin, 1996; Duveiller and Sharma, 2009).
Breeding for resistance to spot blotch disease of wheat
- Determination of genetic diversity in wheat
- Sources of resistance
- Screening and rating of spot blotch disease
- Characteristics associated with resistance to spot blotch
- Gene action and inheritance of resistance to spot blotch in summer rain-fed
- Mating designs
- Maternal effects in the inheritance of resistance to diseases
This indicates the importance of investigating the inheritance of resistance to leaf spot disease in summer rainfed wheat cultivars. In wheat, several mating models have been used to understand the genetics of blotch resistance.
Participatory research for crop improvement
In wheat, maternal effects have been reported to have a major influence on grain protein content, grain weight (Millet et al., 1984; Barnard et al., 2002) and number of grains per ear, but not on the number of tillers per plant , the length of the stem and the weight of a thousand grains. (Hussain et al., 2008). Therefore, this study aims to investigate the contribution of maternal effects to spot blotch resistance in wheat.
Summary
Dominant and recessive genes have been reported to control inheritance of spot spot resistance and in some cases epistasis. Major gene controls of field resistance to spot blotch in wheat genotypes Milan/Shanghai# 7'and'Chirya.
Introduction
In Zambia, there is a paucity of information on constraints to rainfed wheat production and farmers' varietal preferences. The objectives of this study were therefore to investigate farmers' constraints in rainfed wheat production and cultivar preferences.
Materials and methods
- Study area description
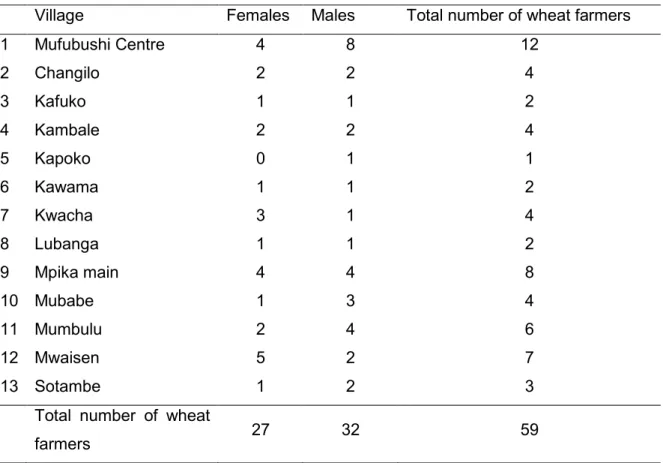
- Selection of farmers
- Data collection
- Data analyses
It is therefore important to include farmers' preferences in the breeding program in an initial phase to increase the chance of adoption of the breeds. During the meeting with the farmers, a member of the research team, who knew the local language of the farmers, explained the purpose of the research that would be conducted in their area.
Results
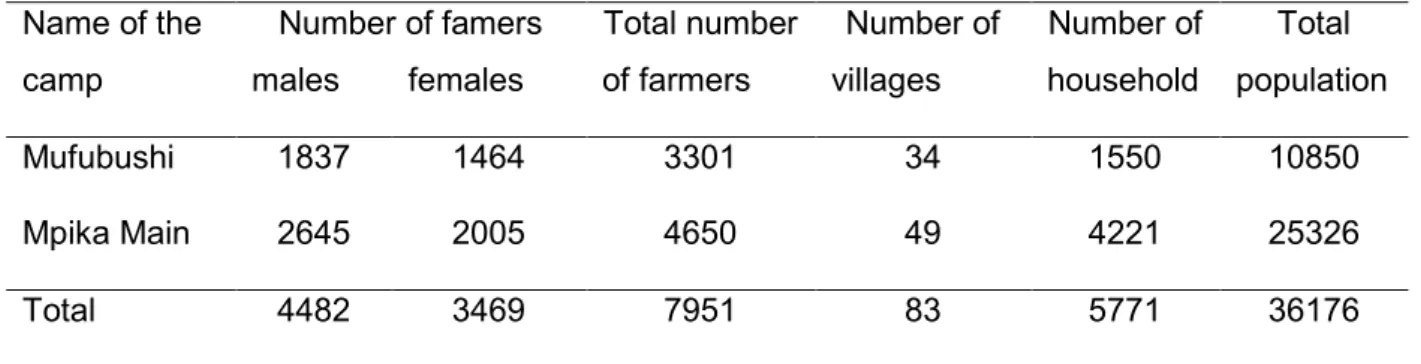
- Social economic and agricultural information of Mufubushi and Mpika-Main areas 44
- Land size and preparation, and agricultural information access
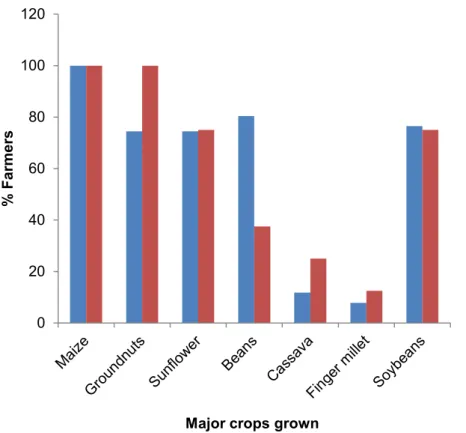
- Food and cash crops grown by farmers
- Wheat production in Mufubushi and Mpika -Main
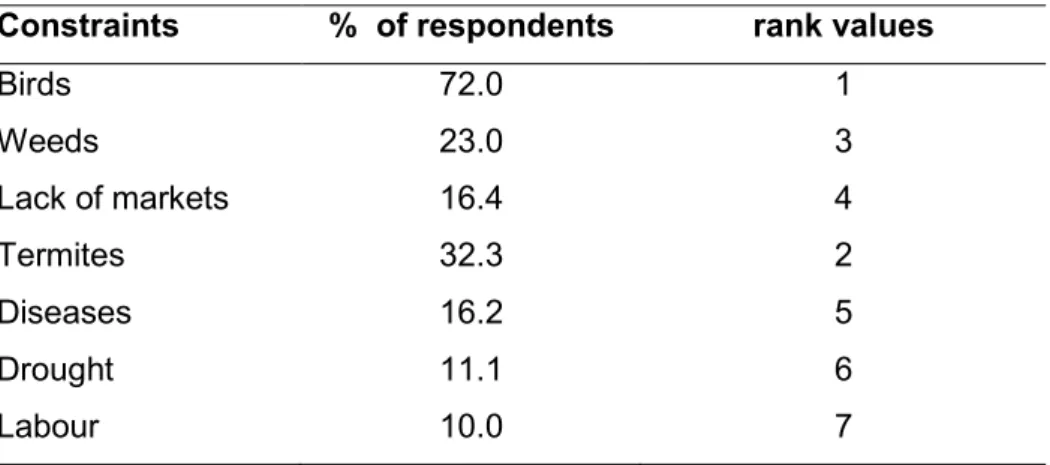
- Wheat production constraints as perceived by farmers
- Farmers’ perception of spot blotch disease and management strategies
- Wheat cultivar preferences
More than 53.8% of farmers used hand hoes to control weeds in their fields, while 46.2% used both chemicals and hand hoes. On average, most farmers interviewed considered bird damage to be the most important factor limiting wheat production. Every little mistake in distinguishing between wheat and tares accidentally led to the removal of the wheat crop.
Discussion
- Social economic and agricultural information of Mufubushi and Mpika-Main areas 51
- Farmers’ perception of spot blotch disease and management strategies
- Wheat cultivar preferences
The production area has the potential to increase if research institutions (the wheat team) can train extension workers in wheat production, who in turn will help farmers improve rain-fed wheat production in their areas. A reliable supply of rain-fed wheat seed from both the private and public sectors is required for sustainable spring wheat production among smallholder farmers. Drought, bird damage and termites were other factors limiting rain-fed wheat production among small-scale farmers.
Conclusion
This therefore confirms the importance of developing new wheat varieties that include farmers' preferred traits for the study areas. Participatory rural assessment of farmers' criteria for selection of maize varieties and constraints on maize production in moist-mid altitude one of Western Kenya. Farmers' desired traits and selection criteria for maize varieties and their implications for maize breeding: A case study from KwaZulu-Natal Province, South Africa.
Introduction
Genetic diversity assessment is the foundation for crop improvement in a wide range of crop species, including wheat (Salem et al., 2008). Moreover, it presents problems in breeding crops for adaptation to biotic and abiotic stress (Dodig et al., 2010). Trait associations in wheat were studied using simple correlation and path analysis (Nukasani et al., 2013).
Materials and methods
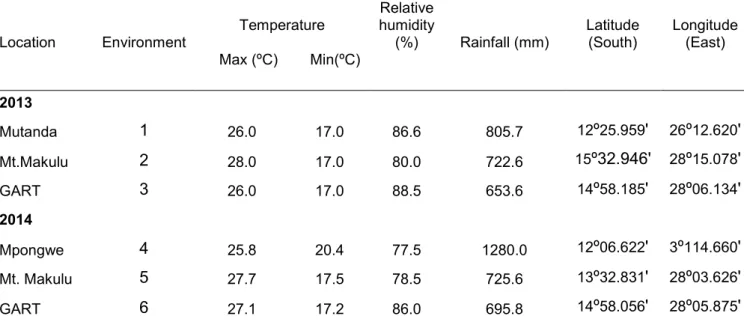
- Experimental sites
- Experimental material, layout of the experiment and crop management
- Measurements
- Data analysis
Tip (ear) length (cm) – was measured from the base to the tip of the tip, average of five tips. The number of grains per ear – was determined by counting the number of grains per ear from the central part of the ear; an average of five spikes. The length of the stalk (cm) was measured from the highest node to the bottom of the ear.
Results
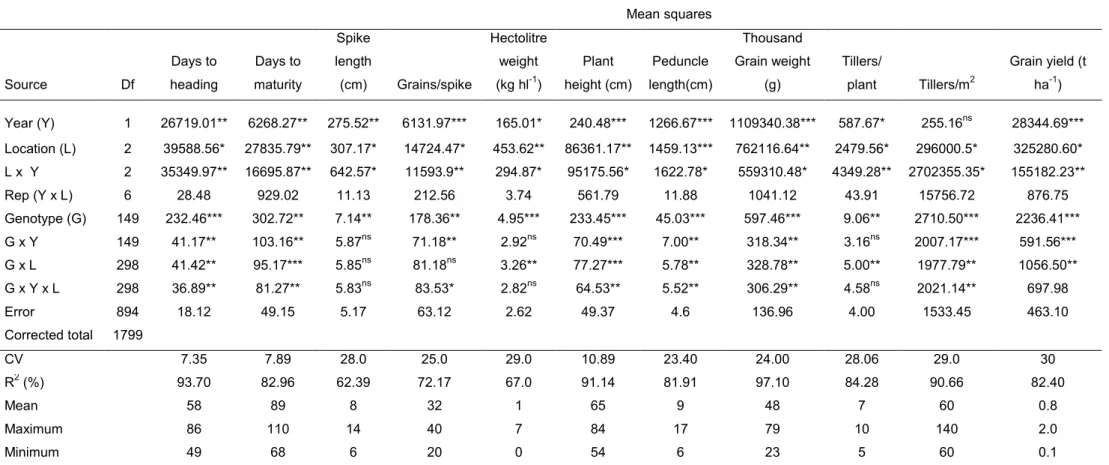
- Variation among the genotypes
- Correlations and path coefficient analysis
- Principal component analysis for agro-morphological traits
- Cluster analysis
Days to maturity were negatively and significantly correlated with hectoliter weight, stalk length, TGW and grain yield. A significant relationship (P<0.01) was also observed between plant height and spike length, hectolitre weight, days to maturity and rosettes/plant. Subgroup I B combined thirty-five genotypes (23.3%) that were intermediate in days to maturity and grain yield.
Discussion
The highly significant and positive correlation observed between chicks/m2 with grains per spike, hectoliter weight, plant height and peduncle length indicates that improvement in abundance/m2 can accelerate the performance of the aforementioned characters. This suggests that improving plant height would see improved performance of these other characters. Two principal components (PC1 and PC2) were used to cluster the genotypes to observe the relationship that existed between the genotypes as they contributed more than half of the total variation (Ajmal et al., 2013).
Conclusion
Investigation of genetic diversity in wheat (Triticum aestivum L.) using random amplified polymorphic DNA (RAPD) markers. Genetic diversity of wheat (Triticum aestivum L.) genotypes based on cluster and principal component analyzes for breeding strategies. Survey of genetic diversity among Indian bread wheat (Triticum aestivum L.) cultivars released during the last 100 years.
- Introduction
- Materials and methods
- Experimental sites and location
- Wheat germplasm
- Experimental design and crop management
- Disease assessment
- Data analysis
- Results
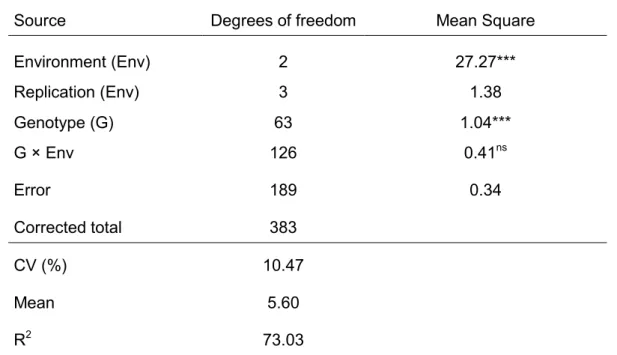
- Combined analysis of variance
- Reaction of the wheat genotypes to spot blotch disease across seasons
- GGE biplot analysis of environments and genotypes on spot blotch severity
- Discussion
- Conclusion
In addition to these effects, spotting also reduces the quality and quantity of wheat (Kumar et al., 2002). In Zambia, limited information is available on sources of resistance to spotted spot. The analysis of variance revealed variability for resistance to blotch among the 150 genotypes across study environments.
HRWN= high rainfall wheat screening farm, HEWITT= high rainfall wheat yield trial, SAWSN= semi-arid wheat screening farm and SB= 2nd CSISA spot blotch farm.
HRWSN= high-rainfall wheat screening nursery, HRWYT= high-rainfall wheat yield trial, SAWSN= semi-arid wheat screening nursery, and SB= CSISA second spot.
Introduction
The effects of genes for the inheritance of resistance to blotch disease are not well established as there are conflicting reports regarding the type of gene action controlling resistance (Joshi et al., 2004b; Goel et al., 2010). It is clear that more information about the inheritance of resistance and the type of gene action controlling spot resistance is needed for successful disease resistance breeding. The objectives of this study were therefore to determine the gene action and mode of inheritance of spot resistance in rain-fed wheat.
Materials and methods
- Diallel analysis
- Experimental sites
- Plant materials and generation of segregating population
- Experimental layout for the evaluation of trials
- Data collection
- Generation of mean analysis
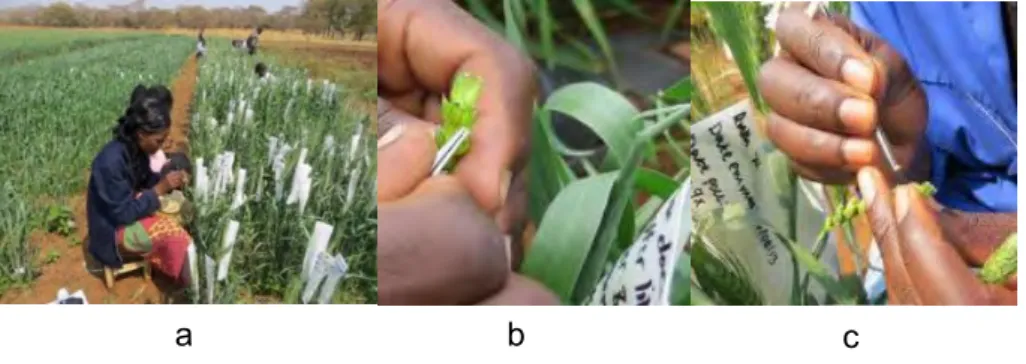
- Experimental layout and scoring of diseases
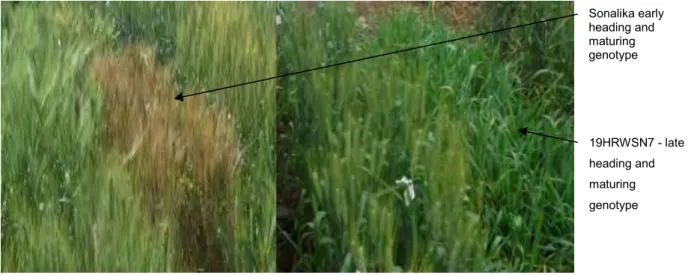
To create sufficient disease pressure on the plants, a line of the susceptible parent SB50 (Sonalika) was planted in alleys and borders (Joshi et al., 2004a). On a scale of 0-9, 0 was scored on leaves with no symptoms, 1 was scored on leaves that had one or two necrotic spots to score 9 on leaves with many extensive necrotic spots with pronounced chlorosis as shown in Table 5.2. 1 < 1% One or two small necrotic spots without chlorosis Resistant 2 1-3 Few small necrotic spots without chlorosis Resistant 3 4-6 Few small necrotic spots with chlorosis Resistant.
Data analysis
- Diallel analysis
- The adequacy of additive–dominance model
- Estimation of genetic variance components
- Graphical analysis
- Generation mean analysis
The adequacy of the additive-dominance model was tested through Wr-Vr analysis of variance, regression analysis and t2 test (uniformity of Wr, Vr) as described by Singh and Chaudhary (1995) and Dabholkar (1999). Parents with array point located in the middle of the regression line had equal frequencies of dominant and recessive genes. The regression analysis was weighted based on the inverse of the variance of means and matrix parameter (Checa et al., 2006).
Results
- Analysis of variance (diallel)
- Performance of parents and crosses at different sites and across sites
- Genetic analysis - Hayman Approach
- Analysis of a diallel table
- The additive – dominance model
- Genetic components of variation
- Graphical representation
- Generation mean analysis
- Genetic effects
- Gene effects estimates
- Heritability estimates and degree of dominance
Analysis of variance of Wr - Vr and Wr + Vr (Table 5.6) to test the fit of the additive-dominant model indicated that Wr-Vr and Wr + Vr were non-significant for spot disease resistance. Variance component estimates (Table 5.8) showed that additive variance (D) and environmental variance (E) were highly significant (P < 0.001) for controlling blotch disease resistance. Analysis of variance for generation means for spot disease reaction (Table 5.11) revealed highly significant differences for additive effects (P < 0.001).
Discussion
- Diallel analysis
- Generation mean analysis
The results showed that additive gene effects predominated in controlling the inheritance of resistance to blotch. The negative value of h2 provided further evidence of the absence of dominant genes in the inheritance of resistance to spotted spot disease. This study showed the complete absence of epistasis in the control of inheritance of resistance to spotting.
Conclusion
In this study, non-allelic interactions were found not to be important in controlling resistance to leaf spot. Therefore, 30SAWSN10 (P1), 30SAWSN5 (P3), Coucal (P4) and 19HRWSN6 could be further incorporated into breeding program to improve leaf spot resistance. Heritability estimates of spot resistance and its relationship with other traits in crosses of spring wheat.
- Introduction
- Materials and methods
- Plant material
- Phenotypic evaluation
- Genotypic evaluation
- Results
- Phenotypic evaluation
- Molecular marker analysis
- Discussion
- Conclusion
Quantitative trait loci (QTL) and simple sequence repeat (SSR) markers associated with resistance to Bipolaris sorokiniana have been identified in wheat. Marker Xgwm437 also showed an association with resistance to Bipolaris sorokiniana considering the significance of the regression coefficient (P=0.03) (Anandhan et al., 2010). Marker Xgwm437 previously reported by Kumar et al. 2005) to be associated with resistance to Bipolaris sorokiniana was also confirmed in this study.
Introduction
Summary of research findings and implications
- Production constraints and farmers’ preferences of summer rain-fed wheat
- Genetic diversity using agro-morphological traits and the association between
- Genetic variability among wheat ( Triticum aestivum L.) germplasm for resistance
- Genetic analysis of resistance to spot blotch disease
- Validation of molecular markers linked with resistance to spot blotch disease
Additive gene effects were important in controlling resistance to blotch disease, an indication that blotch resistance can be improved by selection. Older genotypes exhibiting maximum number of dominant genes can be used in breeding for spot spot resistance. The study confirmed that the association of SSR markers Xgwm570, Xgwm544 and Xgwm437 previously reported is linked to resistance to spotted spot disease.
Recommendations and way forward
Sixty-six wheat genotypes comprising 11 parental genotypes and 55 F2 progeny were screened with SSR markers Xgwm570, Xgwm544 and Xgwm437 to confirm their reported association with resistance. The marker explained 14% of the phenotypic variance and gave a high adjusted R2 of 11.0%, indicating a strong association with resistance. Therefore, the markers can be used to identify genotypes resistant to Bipolaris sorokiniana in marker-assisted selection.