CAUSES OF HOSPITAL RE-ADMISSIONS OF HIV/AIDS CHILDREN AT
DR GEORGE MUKHARI HOSPITAL DURING THE YEAR 2003
By
Manthodi Alina Malebye
A dissertation submitted in partial fulfilment of the requirements for the degree of
Masters in Public Health (MPH)
in the FACULTY OF HEALTH SCIENCES (School of Health Care Sciences) at the
UNIVERSITY OF LIMPOPO, MEDUNSA CAMPUS
SUPERVISOR: Dr. Sphiwe Madiba CO-SUPERVISOR: Dr. Paul Chelule
2011
DECLARATION
I, Manthodi Alina Malebye, hereby declare that the work on which this dissertation is based, Causes of Hospital re-admissions of HIV/AIDS children admitted at Dr George Mukhari Hospital during 2003, is original (except where acknowledgements indicate otherwise) and that neither the whole work nor any part of it has been, is being, or shall be submitted for another degree at this or any other university, institution for tertiary education or examining body.
M.A. Malebye 2011-08-11
Signature Date
ACKNOWLEDGEMENTS
I wish to acknowledge the following individuals for their contributions, assistance and support towards this study. The Department of Paediatrics at Dr George Mukhari Hospital, for giving me permission to conduct the study at this hospital. Sister Mashele in ward 19 and Sister Rhenoster in ward 23 and the nursing staff both in the two paediatric wards, the two admin clerks at the filing room, Mr Jones and Mr Skosana. They have been very helpful in the data collection stage and I thank them very much.
My sincerest gratitude goes to the supervisor Dr. Sphiwe Madiba and co-supervisor Dr. Paul Chelule, I thank you for your patience, love and endless support provided during the enduring duration of the study. You never gave up in me.
I would like to thank my Almighty God for giving me courage and strength to complete this research study. To my dear friends Dankiso and Magdeline, thank you for all of your contributions.
Finally, and not least, to thank my family, my husband Bogatsu, children Thato and Olerato, for their unflinching love and support they gave me throughout the study.
ABSTRACT
Introduction
HIV/AIDS is major cause of child mortality and an increase in the number of sick children presenting to health services worldwide (UNICEF 2008). A significant number of children live with HIV/AIDS in South Africa. Research indicates that in poor resourced countries, there is an increase in the prevalence of hospital admissions and re-admissions among HIV infected children as compared to developed countries. Research data on hospital admissions, treatment and care of HIV positive children South Africa is limited.
Objectives
This study was therefore initiated to determine the demographic and clinical causes of HIV positive children admitted and readmitted at the paediatric ward of Dr George Mukhari Hospital (DGMH), South Africa in the year 2003.
Methods
This was mainly a descriptive quantitative study using medical records of HIV infected children admitted and readmitted in the paediatric ward of DGMH from 1st January to 31st December 2003. A full census of all the records of children admitted in the two paediatric wards was carried out. Descriptive and inferential statistics were used to analyze data.
Results
The study comprised 74 children, 28 (37.8%) female and 48 (62.2%) males. The average mean of initial admission length of hospital stay was 12.3 days and (SD = 12.1) days. The different diagnoses were classified in accordance with World Health Organization (WHO) Clinical Staging of HIV disease for infants and children with established HIV infection.
Out of a total of 581 initial admissions, 74 (12.7%) children were readmitted. The mean interval days between the discharge date and readmission date was 9.8 days (SD = 7.0 days) and 94.6% of the readmissions occurred within the first two weeks of discharge date.
Second readmission decreased by 75.3% as only 18 patients were readmitted. A further
The commonest causes of admission with HIV were broncho-pneumonia, gastro-enteritis, vomitting, oral thrush, immunosuppression with symptoms like fever,cough, respiratory distress. Causes of readmissions were broncho-pneumonia, oral thrush, diarrhoea, vomitting, immunosuppression, pulmonary tuberculosis, wasting and failure to thrive, dehydration associated with symptoms like fever, cough, respiratory distress and upper respiratory distress.
Conclusion
The rate of readmission was (12.7%) and majority of the readmitted children were in the 0- 2-year age group. The study results show a high prevalence of diseases of the respiratory system with a high frequency of broncho-pneumonia and a high prevalence of diseases of the digestive system with a high frequency of gastro-enteritis.
The average mean of the initial hospital admission stay was 12.3 days, which was significantly higher than other studies previously conducted. The probable reason for a long hospital stay could be the high prevalence of co-infections among the children admitted.
ACRONYMS AND ABBREVIATIONS
AIDS Acquired Immune Deficiency Syndrome ARF Acute Respiratory Failure
ARV Antiretroviral (drug) ART Antiretroviral Therapy BPN Broncho-Pneumonia
cART Combination Antiretroviral Therapy CMR Child mortality rate
CMV Cytomegalovirus
CNS Central Nervous System CP Cerebral Palsy
DGMH Doctor George Mukhari Hospital DOT Directly Observed Therapy FTT Failure to thrive
GE Gastro-Enteritis
HAART Highly Active Antiretroviral Therapy HB Haemoglobin
HIV Human Immunodeficiency Virus IA Initial Admission
LIP Lymphoid Interstitial Pneumonitis LOS Length of Hospital Stay
MDG Millennium Development Goal MRC Medical Research Council
PCP Pneumocystis Carinii Pneumonia PEM Protein energy malnutrition
PMTCT Prevention from Mother to Child Transmission RA Repeated admission
RVF Recto Vaginal Fistula
UNICEF United Nations Children’s Fund
USAID United States Agency for International Development UNAIDS Joint United Nations Programme on HIV/AIDS
UNGASS United Nations General Assembly USA United States of America
WHO World Health Organization
Table of Contents
DECLARATION ... i
ACKNOWLEDGEMENTS ... ii
ABSTRACT ... iii
ACRONYMS AND ABBREVIATIONS ... v
Table of Contents ... vii
LIST OF TABLES ... x
LIST OF FIGURES ... x
CHAPTER 1: BACKGROUND AND INTRODUCTION ... 1
1.1 Background of the study ... 1
1.2 Problem statement ... 4
1.3 Study rationale ... 5
1.4 Aim ... 6
1.5 Research Question ... 6
1.5.1 Specific Questions ... 6
1.5.2 Objectives ... 6
1.6 Significance of the study ... 6
CHAPTER 2: LITERATURE REVIEW ... 8
2.1 Introduction ... 8
2.2 HIV infection in children... 8
2.3 Hospital admissions of HIV/Aids patients ... 9
2.3.1 Malnutrition ... 10
2.3.2 AIDS-Related diseases ... 11
2.3.3 Readmissions ... 12
2.3.4 Length of stay in hospital ... 12
2.4 Mortality in children ... 13
2.4.1 Mortality in children born to HIV infected mothers ... 14
2.5 Treatment of HIV-infected children ... 16
2.6 Impact of HIV/AIDS on health services and Human Resources ... 18
CHAPTER 3: METHODS AND MATERIALS ... 21
3.1 Introduction ... 21
3.2 Study Design ... 21
3.3 Study Setting and Population... 21
3.4 Sampling ... 22
3.5 Data Collection ... 22
3.6 Data Analysis ... 23
3.7 Validity and Reliability ... 23
3.8 Bias ... 24
3.9 Ethical Considerations ... 24
CHAPTER 4: DATA ANALYSIS ... 25
4.1 Introduction ... 25
4.2. Socio-economic demographics of HIV positive children ... 25
4.2.1 Age of children ... 25
4.2.2 Admission diagnosis ... 27
4.2.3 Co-infections... 29
4.2.4 Discharge... 30
4.2.5 Hospital stay ... 31
4.3 Admission diagnosis ... 31
4.4 Co-infections ... 34
4.5 Discharge ... 34
4.6 Hospital stay ... 35
4.7 Admission diagnosis ... 35
4.8 Discharge ... 36
4.9 Cross - tabulation of repeated admission ... 37
CHAPTER 5: DISCUSSION ... 38
5.1. Introduction ... 38
5.2 Socio-economic demographics ... 38
5.3 Clinical conditions ... 39
5.4 Discharge ... 40
5.5 Limitations and Challenges ... 41
5.6 Conclusion ... 41
5.8 Recommendations ... 42
REFERENCES ... 43
APPENDIXES AND ANNEXURES ... 49
Clinical Stage I: ... 51
Clinical Stage II:... 51
Clinical Stage III: ... 51
Clinical Stage IV: ... 51
Annexure 1: Letter of permission by Medunsa Research and Ethic Committee to conduct study. . 54
Annexure 2: Letter of permission by Head of Unit Department of Paediatrics and Child Health .... 56
Annexure 3: Letter of permission by Head of Clinical Services at Dr George Mukhari Hospital ... 57
LIST OF TABLES
Table 4.1: Distribution of age of children……….….25
Table 4.2: Number of diagnoses at first admission………....27
Table 4.3: The WHO clinical staging of diseases in the first readmission……… …………29
Table 4.4: Distribution of the number of co-infections in first readmission……….30
Table 4.5: Distribution of Discharge Diagnosis in the first readmission.……….…….31
Table 4.6: Number of diagnoses for the second readmission……….31
Table 4.7: Classification of diseases at readmission ………...32
Table 4.8: WHO clinical staging of diseases in second readmission………..………33
Table 4.9: Distribution of the number of co-infections ……….34
Table 4.10: Distribution of discharge diagnosis in second readmission……….….34
Table 4.11: Number of diagnoses in the third readmission……...………..…..35
Table 4.12: Admission when the child was first diagnosed with HIV………...36
Table 4.13: Distribution of discharge diagnosis in the third readmission ……….…….36
LIST OF FIGURES Figure 2.1: Rationing of access to hospital care for children ill with AIDS with increasing levels of infection……….………..…….13
Figure 2.2: Cost of public sector health care by year- constant R2000...……….19
Figure 4.1: Employment status of the caregiver...………...25
Figure 4.2: Place were diagnosis was made……….………....27
Figure 4.3: Classification of diagnoses at first readmission.………...28
CHAPTER 1: BACKGROUND AND INTRODUCTION
1.1 Background of the study
More than twenty years after the first clinical evidence of Acquired Immunodeficiency Syndrome (AIDS) was reported, AIDS has become one of the most devastating diseases humankind has ever faced. The overwhelming suffering already caused by AIDS and the threat it now poses to prospects for human and economic development were recognized by hundred of national leaders at the Millennium Summit in 2000 in New York City when HIV/AIDS was included among the Millennium Goals (UNAIDS/WHO, 2002).
There are 40 million people living with HIV globally and this has increased by 2.6 million since 2004. Among these people, 2.3 million are children under 15 years of age (UNAIDS, 2006). It is estimated that by 2010, there will be about 18.4 million orphans in Sub-Saharan Africa as a result of the HIV/AIDS catastrophe (UNAIDS/UNICEF/USAID, 2004). Subsequently, about 700,000 children become newly infected with HIV annually, mainly through mother- to-child transmission (MTCT). This occurs in various ways such as in-utero, during labour, after birth and through their mother’s breast milk. In this regard, Oniyangi et al. (2009) observed in their study that 93% of children were presumed infected through mother to child, 4.6% through blood transfusion and 2.3% was through an unidentified route. All the parents were in the reproductive age group and there were 6 discordant couples identified (mother HIV positive and father HIV negative). Child mortality rates increase because children born to HIV infected mothers may be infected, and even if these children uninfected themselves, they are more likely to die if they lose their mothers (Ndinga- Muvumba and Pharaoh, 2008).
Maternal viral load has a direct effect on intrauterine, intrapartum and breastfeeding transmission; the higher the viral load the more likely the transmission. However, transmission may occur at low viral load (Karim and Karim, 2005). In 2001 the United Nations General Assembly set a target of 80% of pregnant women and their children to have
access to essential prevention, treatment and care by 2010 to reduce the proportion of infants infected by HIV by 50% (UNGASS, 2009).
In 2007, statistics estimated that 2.1 million children under 15 years old were living with the disease, and 290, 000 children died of AIDS and 420, 000 children were newly infected (UNICEF, 2008). In 2008, an estimated 430, 000 children were newly infected with HIV, nearly all of them through MTCT (WHO, 2009). Worse, still, HIV/AIDS accounts for approximately 50% of all child mortality in some areas with high infection rates (Little et al.
2007). Despite the high number infected children globally, there is lack of sufficient information on hospital care. Therefore, paediatric HIV is one of the leading causes of child morbidity and mortality worldwide.
HIV/AIDS is having a devastating impact on the world’s youngest and most vulnerable citizens. AIDS threatens children’s lives. The impacts of AIDS on children are both complex and multifaceted. The safety, health, and survival of all children in affected countries are increasingly jeopardized due to the effects of AIDS on families and communities. Children suffer psychological distress and material hardship due to AIDS. Many are at risk of exclusion, abuse, discrimination, stigma, and may be required to drop out of school. They face decreased access to adequate nutrition, basic health care, housing, and clothing (USAID, 2004).
The 2001 Declaration of Commitment on HIV/AIDS, promulgated by the UN General Assembly Special Session on HIV/AIDS (UNGASS 2009), mandated care for orphans and other children vulnerable to AIDS as a core element of a comprehensive response to the epidemic, yet the growing orphan crisis has received far too little attention and resources (UNICEF, 2008).
Very little is known about the disease progression and mortality in infected children in poor resourced settings and limited studies are available on treatment and management of children in this setting. In resource rich settings, disease progression in untreated children is rapid especially in the first year of life, but seems to slow down in the later years of life (Little et al. 2007).
HIV progresses differently in children. There are those who progress rapidly (25%-30%), those of whom die before their first birthday. There are those who develop symptoms early in life, then follow a downhill course and die by 3-5 years (50%-60%). Lastly, there are long- term survivors who live beyond 8 years (5-25%). These tend to have Lymphoid Interstitial Pneumonitis (LIP) and are stunted with low weight and height for age (WHO, 2011).
In poor resource settings, morbidity rates are significantly higher among the infected children than those who were uninfected. It is further argued that even though the spectrum of illnesses seen in infected children in resource-rich settings is similar to that seen in uninfected children, age adjusted morbidity rates were found to be much higher in infected than the uninfected children.
Without antiretrovirals (ARV’S) this is a lethal disease and progression to AIDS and death is much more rapid in children than in adults. In Africa where deprivation and other social factors already dictate a high disease burden in poor children, the upper end of mortality in HIV-infected children is in the region of 55% by two years of age, 90% by three years, and 98% by five years (Karim and Karim, 2005).
Saving children’s lives depends on early identification of those who are HIV-infected. It is important that children born to HIV-positive women be tested for HIV. In 2007 the average age of starting children on ART was 4.9 years, but recent research demonstrates that early initiation of ART in infants and children prevents death (WHO 2011). Available research confirms that for infants, acquiring HIV before or around delivery, progression occurs rapidly in the first few months of life and often leads to death.
Violary et al. (2008) investigated antiretroviral-treatment strategies in the Children with HIV Early Antiretroviral Therapy (CHER) trial. They concluded that early HIV diagnosis and early ART reduced early infant mortality by 76% and HIV progression by 75%.
All infants and children should have their HIV exposure status established at their first contact with the health system, ideally before 6 weeks of age (WHO, 2011). Miranda et al.
(2007) observed that perinatally infected infants are at particular risk of death between 2 and 6 months. For children between 12 and 18 months, viral testing is recommended since HIV antibody tests may not accurately reflect infection of the child as a result of the possible
persistence of maternal HIV antibodies. However this group of children should be offered an antibody test and only those who are positive subjected to viral test. Those who are negative on antibody test and have not breastfed for more than 6 weeks are not infected (WHO, 2011).
The antibody test (ELISA or Rapid test) is the most commonly used test in diagnosing HIV especially in outpatients and in health facilities within resource-limited settings. Both rapid test and ELISA test are useful for diagnosing HIV infection in children aged 18 months and above. WHO (2010) recommends Virological test as the most reliable method for diagnosing infants and children less than 18 months of age.
Hospital admissions data from South African studies showed that the length of stay, readmissions and deaths were significantly higher in infected than in the un-infected children (Little et al. 2007; Meyers et al. 2000; Zwi et al. 2000). The vast majority of these deaths are preventable, either through treating opportunistic infections with antibiotics or through antiretroviral treatment. In 2003 an estimated 230,000 children in South Africa were living with HIV/AIDS and an estimated 1.1 million were AIDS orphans (WHO, 2011).
The epidemic is also having a major impact on health service utilization in that 20 to 35 percent of paediatric hospital beds are occupied by HIV-infected children (Zwi et al. 1999).
Despite this large paediatric HIV population, research on care and treatment in this country is limited. This is evidenced by paucity of relevant articles in the subject on performing a literature search. As the HIV epidemic is of major concern in this country, and given the rising prevalence in adults infected with the disease, there is a growing demand for hospital beds for the paediatric patients. Owing to the lack of data on many aspects of HIV management in children, most hospitals are ill prepared to meet this need.
1.2 Problem statement
Paucity of data on the healthcare negatively impacts on the quality of Hospital healthcare.
Statistics from South African studies showed that HIV hospital admission increased by 40%
in their paediatric wards (Meyers et al. 2000 and Zwi et al. 2000).
Dr George Mukhari Hospital (DGM), in the Gauteng Province of South Africa, is an academic hospital that serves many communities out of its catchments area and serves as the epicenter for paediatric HIV management and research. It admits children with HIV-related diseases for a number of years now and the paediatric unit of the hospital shows a steady rise in the number of HIV infected children admitted in its wards. However it has not been documented how the epidemic and the growing population of chronic HIV positive children impacts on the services of the hospital.
There is also no understanding of who these children are, how, when and where they were infected. There is growing evidence also that the aging of the paediatric HIV cohort and in some cases lack of access to ART for the children may have resulted in changes in patterns of healthcare utilization. Since the vast majority of children are admitted in the two paediatric units or who die are not fully investigated, there is very little data on the overall burden of HIV infections occurring at this hospital.
This study aims to provide a baseline data on the status of HIV positive children re-admitted into this hospital and will serve as a bridge to many other studies in the discipline. This study will be confined to data on HIV paediatric patients before ART rollout at DGM hospital. It is anticipated that another large followup study will focus on data right from the initiation of the ART’s in HIV-positive children to date.
1.3 Study rationale
HIV/AIDS is a prominent cause of childhood mortality worldwide, often preventable and or treatable. Academic/public hospitals are the first point of referral for severely ill children and can play a significant role in reducing childhood mortalities caused by HIV. This study will go a long way in providing the much needed data on some of the factors associated with patient admission and readmission to DGM.
1.4 Aim
The aim of this study was to determine factors associated with re-admissions of HIV positive children at Dr George Mukhari Hospital during 2003.
1.5 Research Question
What are the factors associated with re-admission of HIV positive children at Dr George Mukhari Hospital?
1.5.1 Specific Questions
i. What are the socio-economic demographics of HIV positive children with repeated admission at Dr George Mukhari hospital?
ii. What proportion of HIV positive children were repeatedly admitted at Dr George Mukhari hospital?
iii. What clinical conditions are common among HIV positive children with repeated admission at Dr George Mukhari hospital?
1.5.2 Objectives
i. To identify socio-economic demographics of HIV positive children with repeated admission at DR George Mukhari hospital
ii. To determine the proportion of HIV positive children with repeated admission at Dr George Mukhari hospital
iii. To determine the common clinical conditions among HIV positive children with repeated admissions.
1.6 Significance of the study
The study is important because it will assist with regards to:
i. The data base of HIV infection and admission before the ARV era in our hospital or region will serve as a base for comparing admission rates before and after the introduction of ARV’s.
ii. The data will bring new dimension and add to the research knowledge on paediatric HIV. This is because less research has been conducted on this subject in the region, province and country.
iii. Findings from the study will highlight the needs for paediatric HIV. This will influence policy as well as provision for enhancing better treatment and care.
CHAPTER 2: LITERATURE REVIEW
2.1 Introduction
Human Immunodeficiency Virus (HIV) infection, and its full clinical presentation, the Acquired Immunodeficiency Syndrome (AIDS), are now major public health problems in most countries of the world-wide (Kibel and Wagstaff, 2001). Since the epidemic began, more than 60 million people have been infected with the virus. It is estimated that 67 percent of these, are living with HIV/AIDS and 85 percent of the 2. 6 million annual deaths are from sub-Saharan Africa. Within this region, child mortality is higher in rural areas, and among poorer and less educated families. The disease has different clinical presentations in both adults and children. The prevalence of HIV among children in Africa and the morbidity and mortality rates among children is likely to be more severe than experience from the industrialized countries (Colvin, 2005).
2.2 HIV infection in children
Infection of children with HIV is becoming a common family problem that impacts negatively in the medical and socio-economic status of the community and the nation as a whole. Most children get infected through mother-to-child transmission (MTCT) and this can happen before, during and after delivery (Newel, 2001).
HIV-infected children usually present with various clinical symptoms depending on the kind of infections they get exposed to following the infection with HIV. In the third world
countries the clinical symptoms are usually non-specific and include persistent diarrhoea, failure to thrive, bacterial infections, chronic cough and slow development (Little et al.
2007). The proportion of infected children can greatly be reduced by taking antiretroviral drugs a few weeks before giving birth or delivering by caesarean section and by avoiding breastfeeding by infected mothers. The prevention strategy can only work if mothers are advised timeously to follow recommended methods to prevent MTCT (PMCTC) (Little et al.
2007).
The Burden of Disease estimates indicate a trebling of mortality in the 1-5-year age group from 1998 to 2000 due to the HIV-epidemic. The under-5 mortality rate for 1998 showed that deaths in the 1-5-year age group contributed 14 out of the 59 deaths per 1,000 live births. The Burden of Disease estimates of under-5 mortality rates for 2000 show that 36 out of the 95 deaths per 1,000 live births are in the 1-5-year-old age group – reflecting a trebling of deaths in this age group. Through-out Sub-Saharan Africa, poverty and crippled health systems pose enormous challenges to the battle against AIDS.
South Africa has the highest estimated number of adults and children living with HIV/AIDS in the world (5.3 million as of the end of 2003) and is one of the countries hardest hit by the epidemic (UNAIDS, 2004). Since the beginning of the HIV/AIDS epidemic, approximately 2.7 million children have developed AIDS-related diseases (UNAIDS, 2004). Inevitably, as a proportion of these children become ill they ultimately need health care. This poses a substantial burden and challenge to the health services and its resources. There is little data on the effects of HIV/AIDS on the healthcare system.
2.3 Hospital admissions of HIV/Aids patients
Hospital admissions have been on the rise with an increasing proportion due to people with HIV-related disease. The pattern of hospital admissions has also changed with an increase with HIV-infected patients presenting with diseases such as tuberculosis (TB), pneumonia, diarrhoea and malnutrition. Management of HIV-infected patients is complicated when there is no treatment for HIV/AIDS. However, with the announcement in 2003 by the South
African Government to adopt a national antiretroviral roll-out plan, there is renewed optimism that South Africa can turn the tide of the epidemic (Karim and Karim, 2005).
Multiple hospital admission in children is under-researched. Generally childhood hospital rates are increasing. Many South African hospitals experience bed shortages exacerbated by the HIV epidemic.
Research indicates that in poor resourced countries there is an increase in the prevalence of hospital re-admissions among HIV positive children as compared to developed countries.
The discussion that follows highlights the factors fanning this discrepancy.
2.3.1 Malnutrition
It is documented that malnutrition is a factor causing over 50% of child deaths in developing countries (Rice et al. 2000). In Africa, where majority of HIV/AIDS infected children live, food shortages and malnutrition are prevalent. Thus, this explains the high prevalence of HIV in children with severe malnutrition. This also significantly increases the risk of mortality (Fergusson et al. 2008). A high prevalence of 80% of HIV positive children was reported at Eldoret Hospital in Kenya, where children were admitted at the paediatric ward with pneumonia, malnutrition and diarrhoea (Esamai and Buku, 1991). Another study in Kenya showed that a substantial proportion of 44.8% of HIV positive children admitted in hospital was malnourished. Similar observation has also been reported at a Durban hospital in Kwa- Zulu Natal Province in South Africa (Chhagan and Kauchali, 2006).
Severe malnutrition in HIV positive children was reported in other regions including Malawi (Thurstans et al. 2004). At an urban hospital in Durban, South Africa an overall 68% of the diarrhoeal admissions were classified as HIV-infected and 61% were classified as malnourished, with 53% having both (Chhagan and Kauchali, 2006). In another rural South African study, HIV-infected children were more likely to have severe malnutrition than the un-infected children (Yeung et al. 2000). In most of these studies underweight (stunting, wasting and low weight-for-age) and breastfeeding status were used as indicators of chronic and acute malnutrition. Malnutrition is known to lower body’s immunity as well as the
immune response in same manner as HIV infection does. Thus, malnutrition has an additive effect to that of HIV infection (Beisel, 1996).
2.3.2 AIDS-Related diseases
Paediatric wards in South African public hospitals are occupiedpredominantly by children with HIV and AIDS-related illnesses (Richter et al. 2009). The prevalence of HIV infection increased from 2.9% in 1992 to 20% in 1997 at Chris Hani Baragwanath hospital in South Africa (Zwi et al. 2000). HIV-infected children accounted for the increased number of admissions for pneumonia, gastro-enteritis, malnutrition, and tuberculosis in this hospital.
Chronic respiratory disease has also been reported in another South African study (Stanley, 2008). Acute respiratory failure (ARF), Pneumocystis and cytomegalovirus (CMV) infections are also associated with HIV infections in children (Rabie et al. 2007).
Meyers et al. (2000) also noted that HIV positive children were frequently readmitted with infectious diseases such as pneumonia and gastro-enteritis (GE) at Chris Hani Baragwanath Hospital in Soweto. This also replicated by Yeung et al. (2000) who reported that HIV infection accounted for 26% of paediatric hospital admissions. HIV infection was strongly associated with pneumonia and bacteraemia in one Durban study (Chhagan and Kauchali, 2006). Another Kenyan study showed that out of fifty seven children aged 2 years and below admitted to Paediatric ward, 70% of 24 cases with diarrhoea of over 14 days duration were positive for HIV compared to 12 (36.7%) cases out of 33 cases with diarrhoea of less than 14 days' duration (Esamai and Buku, 1991).
Pulmonary tuberculosis (PTB), lymphoid interstitial pneumonia and PCP, are known to be important among HIV infected persons. Worldwide, PTB is the leading killer of people with HIV and is more rapid and deadly in children. TB is currently increasing in many parts of the world where it threatens the lives of millions of infants and children. The diagnosis of childhood TB, which has always been difficult, is now even more challenging in infants and children co-infected with HIV and Mycobacterium tuberculosis (Chintu and Mwaba, 2005).
In South Africa, the Western Cape has a high incidence of TB and a rising prevalence of HIV
environment. Children form 15-20% of the TB burden (Soeters et al. 2005). TB is known to complicate the management of HIV. Drugs used to treat TB may lower the efficacy of antiretrovirals used to treat HIV infection. Also, HIV status exacerbates the TB infection by lowering the immunity of the patient.
2.3.3 Readmissions
Readmission of patients into healthcare facilities has been shown to be more frequent in HIV-infected patients with readmission variation of 6.4-23% (Grant et al. 1999, Philbin et al.
2001). The rate of readmission in HIV infected patients was determined by the co-infections, socioeconomic factors, time and non-compliance to treatment (Palepu et al. 2003). The seropositive status of patients contributes to multiple readmissions. Meyers et al. (2000) noted that HIV positive children were frequently readmitted with infectious diseases such as pneumonia and GE. HIV-infected children being admitted in a healthcare institution were more likely to have been previously admitted (Yeung et al. 2000). Thus, it is possible that HIV infection in children plays a significant role in children readmissions into the healthcare institutions.
2.3.4 Length of stay in hospital
HIV infection is believed to prolong the length of stay in a healthcare institution. For example, at Tygerberg Children’s hospital in Cape Town (Rabie et al. 2007) noted that the median duration of stay of HIV-infected children was 6 days, significantly longer than for non-HIV children. The possible explanation for this is that being immune-compromised, the HIV-positive children take a longer time to fight infections and hence more time to heal. HIV positive children may also present with multiple infections during admission like TB, meningitis and pneumonia, and this may take a longer time to treat them. Additionally, TB which is a major co-infection in HIV patients, takes about 6 months to be treated. This significantly prolongs the length of stay in the hospital.
Figure 2.1: Rationing of access to hospital care for children ill with AIDS with increasing levels of infection
Source: Colvin, 2005
As the scourge of the epidemic rises, the number of patients increases and thus competes for the limited healthcare facilities. The increase in the number of admissions has necessitated rationing of the health care facilities. Often, premature or early discharge may be done in preparation of the incoming acute patients and readmissions of previously discharged patients as the infections are increasing. As a result of this, HIV infected children are staying in hospital for shorter periods as seen in Figure 2.1 (Colvin, 2005).
2.4 Mortality in children
Mortality is the condition of being mortal, or susceptible to death. About 9 million children under the age of five die every year (WHO, 2009). Around 70% of these early child deaths are due to conditions that could be prevented or treated with access to simple, affordable interventions. Millennium Development Goals adopted by the United Nations in 2000 aim to decrease child and maternal deaths worldwide by 2015. The fourth Millennium Development Goal (MDG) is to reduce the 1990 mortality rate among under-five children by two thirds. Child mortality is also linked to MDG 5 to improve maternal health (WHO, 2009).
2.4.1 Mortality in children born to HIV infected mothers
Without antiretrovirals (ARV’s), HIV/AIDS is a lethal disease and progression to AIDS and death is much more rapid in children than in adults. In Africa where deprivation and other social factors already dictate a high disease burden in poor children, the upper end of mortality in HIV-infected children is in the region of 55% by two years of age, 90% by three years, and 98% by five years (Karim and Karim, 2005).
Observational research has shown that in areas of high adult HIV prevalence child mortality rates (CMR) have risen since the beginning of the epidemic, while in lower prevalence areas the fall in CMR seen before the epidemic has continued (Little et al. 2007). Data on the HIV status of pregnant women has been collected on population-based observational studies, providing estimates of child mortality by maternal HIV status. A few small cohort studies have been established in resource-limited-settings.
HIV-infected children have a higher mortality rate than HIV-uninfected children (Fergusson and Tomkins, 2008). In Europe and the USA before the availability of antiretroviral therapy for children, around 20–25% progressed to AIDS or died in infancy, most commonly from P.
carinii pneumonia (PCP) (Graham and Gibb, 2002).
An estimated 330,000 children younger than age 5 years died in sub-Saharan Africa in 1999 with HIV infection (Walker et al. 2002). According to the 2009 State of the World’s Children report, the under-five mortality rate in South Africa was 59 per 1,000 live births in 2007, while the infant mortality rate was 49 per 1,000 live births. The main causes of under-five mortality are AIDS (representing 35% of all deaths of children under the age of five) neonatal causes (30%), diarrhoea (11%), and pneumonia (6%). At a rural hospital in Cöte- d’Ivoire, Beau et al. (1997) noted that diarrhoeal induced dehydration is an important factor of mortality in HIV positive malnourished children and HIV is regarded a strong predictor of death among children who have been hospitalized with pneumonia. However, these researchers noted that preventable conditions including inadequate water supply, child undernutrition, and anaemia contribute significantly to infant and child mortality
Becquet and Leroy. (2007) points out that HIV is the leading cause of infant mortality in Africa where 1700 children are infected each day from mother-to-child transmission. These findings are supported by Zwi et al. (2000) who reported a 42% rise in hospital mortality at Chris Hani Baragwanath Hospital (from 4.3% in 1992 to 6.1% in 1997), they argued that the mortality rate of children increased as a result of HIV infection and that almost half of the deaths in 1996 in the hospital were HIV related. Ugochukwu (2006) and Oniyangi et al.
(2006) also indicated increased HIV/AIDS related morbidity and mortality in hospital admitted children. The most common cause of death related to pneumonia, septicaemia and poor nutritional status and most deaths occurred to children less than 2 years of age.
Out of the 22 potential causes of death investigated, there were nine that increased in the same distinct age pattern (TB, pneumonia, diarrhoea, meningitis, other respiratory disease, non-infective GE, other infectious and parasitic diseases, deficiency anaemia and protein energy malnutrition (PEM)) and could be considered as AIDS-related conditions.
In KwaZulu-Natal in the Mtubatuba area, the increase in these conditions accounted for 61%
of the total deaths related to HIV/AIDS (Garrib et al. 2006). In another study conducted in Durban, South Africa, mortality was an estimated 35.4%, with the majority of HIV-related deaths occurring during the first year of life (Bobat et al. 1999).
According to Chhagan et al. (2006) in a setting of high HIV prevalence, malnutrition, bacteraemia, and pneumonia contribute independently to death in children hospitalized with diarrhoeal disease. Mortality was higher among HIV-infected than among uninfected children. Inpatient mortality was 14%. History of low birth weight, previous admission, malnutrition, HIV infection, pneumonia, bacteremia, low haemoglobin (HB), total white blood cell count and serum albumin were significant predictors of mortality in univariate analyses.
2.5 Treatment of HIV-infected children
Before the advent of highly active antiretroviral therapy (HAART), treatment of HIV-infected patients was more symptomatic or supportive, where co-infections were treated with available drugs. As soon as the patient improved, they were likely to be discharged to give room for other new patients. Since the virus was not being treated, it was likely that discharged patients would be readmitted.
The most prevalent co-infections of HIV in children are TB and PCP and these received the most attention globally (Dray-Spira et al, 2000). Clinical features of PCP among HIV-infected children are fever, dyspnoea, tachypnoea and cough. Physical examination might show bibasilar rales with evidence of respiratory distress and hypoxia.
Trimethoprim/sulfamethoxazole is the recommended treatment for PCP while Dapsone is effective in treatment of mild-to-moderate PCP (Castro and Morrison-Bryant, 2010).
Children with pulmonary TB might have little or no symptoms. Symptoms, when present, might be nonspecific (e.g. weight loss, fever, and failure to thrive). TB among young children rarely manifests with the typical apical lung infiltrates and late cavitations observed among adults with TB. More commonly, pulmonary TB appears as a localized pulmonary infiltrate with associated hilar lymphadenopathy. Other children might present more acutely with progressive respiratory distress, apnoea, jaundice, and abdominal distension. Signs and symptoms might be consistent with acute pneumonia, with nonspecific radiological opacities without hilar adenopathy (Castro and Morrison-Bryant, 2010).
Because of the high risk for dissemination among children aged <4 years, TB treatment should be initiated as soon as the diagnosis of TB is suspected. Although the optimal timing of initiation of antiretroviral therapy during TB treatment is unknown, in the setting of antiretroviral naïve HIV-infected children, treatment of TB should be initiated 4–8 weeks before initiating antiretroviral medications to improve adherence and better differentiate potential side effects. For children already receiving antiretroviral therapy who have had TB diagnosed, the child's antiretroviral regimen should be reviewed and altered, if needed, to
ensure optimal treatment for both TB and HIV and to minimize potential toxicities and drug- drug interactions (Castro and Morrison-Bryant, 2010).
Initial empiric treatment of active disease (induction phase) should generally consist of a 4- drug regimen (isoniazid, rifampin, pyrazinamide, and either ethambutol or streptomycin) to allow for the possibility of a drug-resistant organism. Ethionamide can be used as an alternative to ethambutol in cases of TB meningitis because ethionamide has better Central Nervous System (CNS) penetration than ethambutol. The major problem limiting successful treatment is inadequate adherence to prescribed treatment regimens. Use of directly observed therapy (DOT) decreases the rates of relapse, treatment failures, and drug resistance. Therefore, DOT is recommended for treatment of children.
Since the virus was not being treated, it was likely that discharged patients would be readmitted. Following the roll-out of the HAART, eligibility to this therapy was based on clinical (when the patient’s health had severely deteriorated or immunological (Assessment of CD-4 count) criteria (Castro and Morrison-Bryant, 2010). Thus, the ARV’s provided a therapeutic breakthrough that significantly reduced morbidity and mortality in infected patients and greatly improving the quality of their lives.
HAART is extremely effective in improving the quality of HIV-infected children even in low and middle income countries. Survival rates of over 80% have been reported from scientific studies as well as programmes. The number of children receiving HAART increased from about 75, 000 in 2005 to almost 200,000 in 2007 (UNICEF/WHO, 2009). After decades of increasing mortality, the annual number of AIDS deaths globally has declined in the past two years, partially resulting from the substantial increase in HIV treatment access (UNICEF/WHO, 2009).
WHO (2010) recommendations of when to start infants on ART, changed in 2008. All HIV- infected infants under 24 months of age should begin ARV’s regardless of clinical or immunological status. Children aged 24 months and older should begin ARV’s according to the clinical and/or immunological criteria.
For children aged 24-59 months with WHO Clinical Stage 3 and Stage 4 disease, with a CD4 percentage of less than 25 or CD4 of less than 750, should be started on ART treatment. For children older than 60 months with Clinical Stage 3 and Stage 4 disease, ART treatment should be initiated if CD4 count falls below 350 (WHO, 2011). Otherwise, ART should generally be deferred until all acute infections have been treated.
ART is ascertained to be a cost effective or cost-saving intervention in high-, middle- and lower-income countries. Combination antiretroviral treatment (cART) has been highly successful in preventing MTCT of HIV and in reducing mortality and morbidity in HIV infected children in countries like North America, Europe as well as Sub-Saharan Africa (Riordan et al. 2009 and Sutcliffe et al. 2008).
Emphasis is also on rapid scale-up of effective interventions and national programmes to significantly reduce new paediatric infections. When the epidemic began some twenty-five years ago, very few would have predicted that children would turn out to be the most affected by the spread of the disease.
2.6 Impact of HIV/AIDS on health services and Human Resources
HIV/AIDS has placed a huge added burden on an already strained health care system in South Africa. The current health care system is currently not only coping with the numbers of AIDS patients but patients who do not have the disease are being severely compromised because of lack of capacity. Health care costs in the public sector are likely to double by 2010 if current levels of care are maintained (Karim and Karim, 2005).
A study done by Schoeman and Pather (2009), noted that despite being treated for the same condition, there is a statistically significant difference in the cost incurred by children in the HIV-positive group (R6 203.16) when compared to the HIV-negative group (R3901.96).
The escalating burden on the public health system requires an increasing level of resources to care patients with HIV related illnesses.
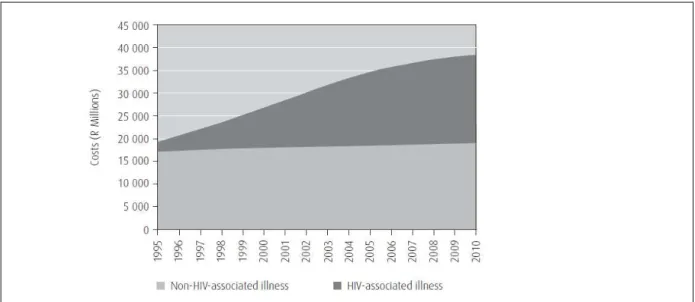
Figure 2.2 shows a report by Colvin (2005) with the estimated of costs incurred by the public health sector. The costs and potential cost savings of providing ART were also considered.
The figure shows estimates from 1995 until 2010 for acute in- and outpatient care but excludes long stay. The figure shows that acute healthcare costs are likely to double in real terms in the public sector if current levels of care are maintained. The pandemic has dramatically reversed improvements in infant mortality and child survival in sub-Saharan Africa (Chakraborty, 2004).
Figure 2.2: Cost of public sector health care by year – constant R2000: Colvin, 2005
Many South African hospitals experience bed shortages exacerbated by the HIV epidemic. A study done by Roux et al. (2000) at a Cape Town hospital in South Africa identified one hundred and six HIV-infected patients from a total of 1,264 beds. Thirty-nine children were in second-level beds or in a long-term residential facility. Fifty-six children were in second- level beds designated for acute care, and occupied 12% of all such beds. At the Chris Baragwanath Hospital in Gauteng and Hlabisa Hospital in KwaZulu Natal, paediatric HIV infection accounts for almost a third of childhood admissions and was regarded as a significant burden on the health service and posed a substantial challenge for health resources (Meyers et al. 2000; Yeung et al. 2000; Fabian et al. 2003).
A study by Letlape (2004) showed that in 94.6% of health facilities, there was an increase in patients seeking clinical care for HIV/AIDS-related illness and 97.1% indicated that the number of admissions for HIV/AIDS clinical care have also increased. During this period, the total bed occupancy rates have remained about the same, despite the observation that AIDS patients stay longer in hospital than non-AIDS patients.
CHAPTER 3: METHODS AND MATERIALS
3.1 Introduction
This chapter presents the study design, the study setting and population, sampling method, how data was collected, data analysis, validity and reliability, bias and ethical consideration.
3.2 Study Design
This was a descriptive retrospective quantitative study using medical records of HIV infected children admitted in the two paediatric wards of Dr George Mukhari Hospital during 2003.
3.3 Study Setting and Population
The study was conducted at the paediatric Unit of the Dr George Mukhari Hospital (DGMH) which is an academic hospital, situated in Ga-Rankuwa, about 27 kilometers north of Pretoria. The Department of Paediatrics and Child Health is one of the largest departments in the hospital, admitting over 10,000 children annually. It has an Acute Care Unit (Short Stay) which is open for admission for 24 hours a day with a bed capacity of 40. Admitted children are managed and observed for 24 hours before being transferred to one of the two medical paediatric wards. This hospital has been admitting children with HIV related diseases. There are two paediatric wards that admit children with medical conditions from birth to 12 years.
The study population comprised records of children admitted over a twelve months period between January and December 2003. Their age ranges from birth to 12 years. The target population comprises of records of all children with an HIV diagnosis, and who have been readmitted during 2003. (Re-admission will mean a second or more admission/s within a year period).
3.4 Sampling
No sampling was done. Instead, records of all re-admitted HIV positive children at DGMH during 2003 were identified and relevant data extracted from them. Files which had incomplete data were excluded to avoid bias and inconsistency in results.
3.5 Data Collection
Data was collected by the researcher and two data clerks who went through all the files of children admitted in the two wards during January to December 2003 to collect all demographic and clinical data. Information about the children who were admitted with HIV was obtained from the admission register of each ward. The registers contained year of admission of patients, ward number, name of the patient, hospital registration number, date of birth, age, gender, date of admission, residential address, admission diagnosis, discharge diagnosis and discharge date.
According to the information obtained from the two registers, 313 children were admitted in ward 19, and 268 were admitted in ward 23 between January 1st and December 31st 2003 with HIV infection. The patients’ names and hospital registration numbers were used to retrieve files from the filing room of the hospital. The clerk at the filing room entered the hospital registration numbers into the filing room’s computer to verify if the patients’ details are correct so that the correct file can be retrieved.
One of the challenges that the researcher faced was that of the archived files. According to the Medical Records Department’s work procedures, these files are supposed to be kept for a period of 3 years in the filing room and at the end of this period the files must be archived (Personal Communication from Medical Records Office). At Dr George Mukhari Hospital, after a period of 3 years, the files are disposed of and not archived. This was the same for admission registers used by ward clerks and nursing staff in the wards. Some of the files were missing and some were registered as dead.
Data collection took place at the filing room for a period of two weeks. Out of a total number of 581, only 74 children were repeatedly admitted. Data was extracted by the researcher, and for missing or incomplete data the paper version of the medical record was used to complete data entry. Data extracted included the demographic data which consisted of patient’s name, age, gender, residential area.
Information on who is caring for the child, whether the mother or caretaker, employment status and source if income of the primary caretaker was obtained. Clinical data included date of initial admission (and re-admission), diagnosis, discharge date, when and where was the HIV diagnosis made, the number of days per hospital stay, the number of re-admissions, causes of re-admissions and co-infections.
3.6 Data Analysis
Data was checked, cleaned and entered into MS Excel and then imported into Stata 10- statistical software for analysis. Descriptive statistics was generated to calculate frequencies and percentages for categorical data such as age, gender, and place of residence, date of admission, admission diagnosis, and number of admissions, re-admission diagnosis and number of readmissions.
Chi-square test was used to determine the association of socio-demographic characteristics and readmissions. Statistical significance of the differences between re-admissions was tested using Chi-square test. The threshold for statistical significance was considered as p value < .05 and 95% confidence interval for all statistical analyses. Data were presented in frequency tables, graphs, and as summary statistics.
3.7 Validity and Reliability
One of the limitations of using computerized record is that the rationale for capturing the data may not adequately reflect the questions of interest to another investigator, or the documentation for data sets is incomplete or ambiguous. For this reason the data extraction
tool was pre-tested on randomly sampled medical records to check whether the computerized data will be able to answer all the research questions and to check the completeness of the data sets.
Ten medical records of children admitted with an HIV diagnosis in the year 2003 were reviewed to check if the variables to be assessed are captured in all the records. The results of the pre test were not included in the main study.
Content validity was established by submitting the data extraction tool to expert practitioners in the paediatric unit for inputs. From the findings of the pre-test and the expert practitioners’ inputs, the necessary adjustments were made to the instrument. In addition hardcopies of medical records were used to validate data where incomplete data is identified during data collection.
3.8 Bias
Use of medical records for data collection is subject to sampling bias; in this study sampling bias was minimized by including records of all children with an HIV diagnosis admitted during the period of study. However, those with incomplete data were excluded.
3.9 Ethical Considerations
Permission to undertake the study was granted by the Research Ethics and Publications Committee of the National School of Public Health and the Medunsa Research and Ethics Committee of the University of Limpopo.
Permission was also granted by the Head of the Department of Paediatrics Department and the CEO of Dr George Mukhari Hospital for access to medical records of patients. Records were not removed from filing room, all data extraction was done on site and records were returned to their original filing cabinets at the end of the day. The researcher adhered to confidentiality by not publicly exposing the names of the patients.
CHAPTER 4: DATA ANALYSIS
4.1 Introduction
The aim of this study was to determine factors associated with re-admissions of HIV positive children at Dr George Mukhari Hospital during 2003. According to the information obtained from the two admission registers of the two paediatric wards of Dr George Mukhari Hospital, 313 children were admitted in ward 19, and 268 were admitted in ward 23 between January 1st and December 31st 2003 with HIV infection. Their names and hospital registration numbers were used to retrieve files from the filling room of the hospital. Out of a total number of 581, only 74 children were repeatedly admitted. Most of the files were missing, lost or the children could have died.
Data were analyzed using statistical computer software Stata 10. The information is presented in frequency tables and pie chart for all variables in order to determine the distribution of variables. Cross tabulation was also done to determine the relationship between the predictor variables and the responses.
SECTION A: First readmission
4.2. Socio-economic demographics of HIV positive children 4.2.1 Age of children
Table 4.1: Distribution of age of children
Age in years Frequency Percentage
0-2 52 70.3
3-5 15 20.3
6-9 7 9.5
Total 74 100
highest number of the patients falls within 0 month to 2 years group which formed 70.3%.
The second highest number of the patients falls within the age group of 3 to 5 years, which formed 20.3%. 9.5% of patients fall within the age group of 6 to 9 years which is the least number of the HIV children with the mean age of 1.39, median 1.00 and standard deviation of 0.658.
11%
19%
70%
Employment status of caregiver
employed unemployed unknown
Figure 4.1: Employment status of the caregiver
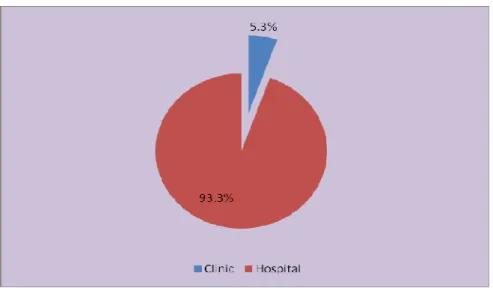
Figure 4.1 above shows the distribution of caregiver employment status. The results show that a large number 54(70%), of the caregiver’s employment status was not recorded only about a tenth 8(11%) were fully employed while 12(19%) were not employed. Data was also extracted on the place where the child was initially diagnosed with HIV/AIDS as shown in figure 4.2 below.
Figure 4.2: Place were diagnosis was made
Figure 4.2 shows the place were the child was diagnosed and majority of children 70(93.3%) were diagnosed in hospital and only 4(5.3%) came to the hospital being diagnosed as they were diagnosed at the clinic.
4.2.2 Admission diagnosis
The different diseases were classified in accordance with the 2009 WHO Clinical Staging of HIV Disease for infants and children with established HIV infection (See Appendix 2A). A list of conditions identified on the patients was also tabulated (see Appendix 2B).
Table 4.2: Number of diagnoses at first admission Number of Diagnoses Frequencies Percentage
1 diagnosis 40 55.6
2 diagnoses 22 30.6
3 diagnoses 6 8.3
4 diagnoses 2 2.8
Table 4.2 above shows that more than half 40(55.6%) of children had 1 diagnosis, a third 22(30.6%) had two diagnoses, less than a tenth 6(8.3%) had 3 diagnoses and 2(2.8%) had 4 diagnoses.
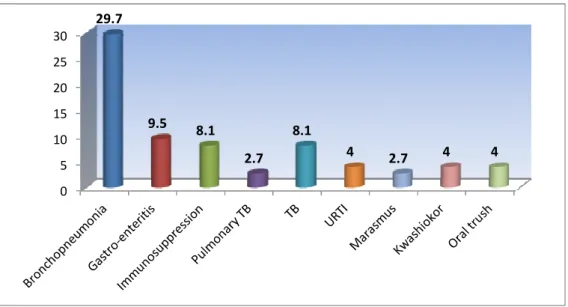
According to the information which pertains to the first readmission when the child was first diagnosed with HIV, most of the children presented with different diagnoses as shown in Figure 4.3.
0 5 10 15 20 25 30
29.7
9.5 8.1
2.7 8.1
4 2.7 4 4
Figure 4.3: Classification of diagnoses at first readmission
Figure 4.3 shows the categories of disease classifications and the most frequent classifications were diseases of the respiratory system and the digestive system as classified by the ICD10 codes. About a third 22(29.7%) of the children were diagnosed with broncho- pneumonia, a quarter 17(22.97%) were diagnosed with gastro-enteritis , a tenth 7(9.5%) with immunosuppression, less than a tenth 6(8.1%) with pulmonary TB, and only 2(2.7%) with TB, 6(8.1%) with upper respiratory tract infection (URTI), 3(4.05%) marasmus, 2(2.7%) kwashiorkor, 3(4.05%) oral thrush. The admission diagnoses were further classified according to the WHO clinical stage of diseases as shown in table 3.
Table 4.3: The WHO Clinical Staging of diseases of first readmission Number of diagnosis WHO clinical staging of
HIV
Frequency Percentages
Admission diagnosis 1 (first readmission)
Clinical stage II 3 4.1
Clinical stage III 40 54.0
Clinical stage IV 9 12.2
Other 18 24.3
Admission diagnosis 2(first readmission)
Clinical stage II 9 12.2
Admission
diagnosis 2 (Initial admission)
Clinical stage III 23 31.1
Clinical stage IV 5 6.8
Other 21 28.4
Admission diagnosis 3(first admission)
Clinical stage II 6 8.1
Admission
diagnosis 3 (Initial admission)
Clinical stage III 15 20.3
Clinical stage IV 2 2.7
Other 11 14.9
Admission diagnosis 4(first admission)
Clinical stage II 2 2.7
Admission
diagnosis 4 (Initial admission)
Clinical stage III 12 16.2
Other 9 12.2
Table 4.3 shows that a relatively high proportion of children in each admission diagnosis were in clinical stage III. Further analysis showed that most of the children presented with multiple diagnoses. Majority of children 40(54%) were admitted with one diagnosis, 22(30.6%) were admitted with two conditions, 6(8.1%) were admitted with three diagnosis and 2(2.7%) were admitted with four diagnoses.
4.2.3 Co-infections
During the first readmission, the records showed that a significant number of children
two co-infections, 14(27.4%) were admitted with three co-infections, 12(21.6%) were admitted with four co-infections, and 5(9.8%) were admitted with five co-infections.
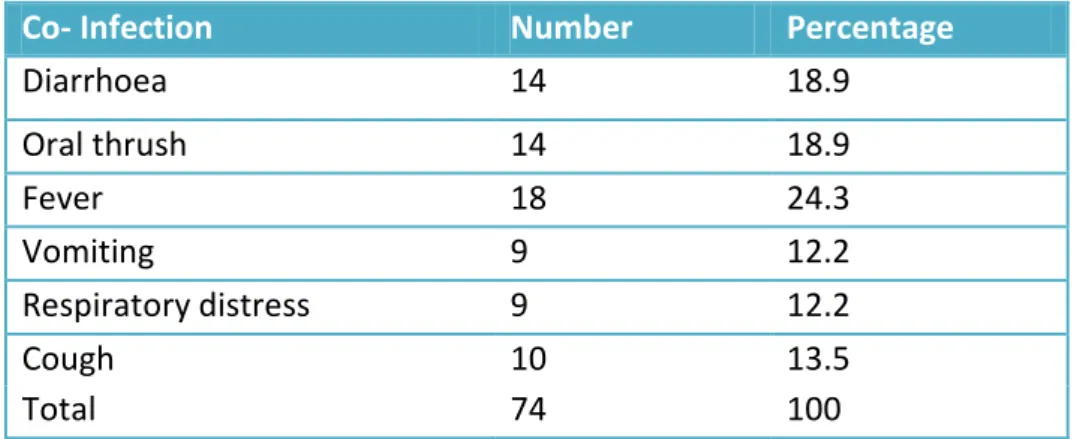
Table 4.4: Distribution of the number of co-infections of the first readmission
Co- Infection Number Percentage
Diarrhoea 14 18.9
Oral thrush 14 18.9
Fever 18 24.3
Vomiting 9 12.2
Respiratory distress 9 12.2
Cough 10 13.5
Total 74 100
Table 4.4 shows that of the 17(33.3%) of children with two confections, 14(18.9%) had diarrhoea as a co-infection, 14(18.9%) had oral thrush as a co-infection, 9(12.2%) had respiratory distress as a co-infection, 9(12.2%) had vomiting as a co-infection, 18(24.3%) had fever as a co-infection and 10(13.5%) children were co-infected with cough.
4.2.4 Discharge
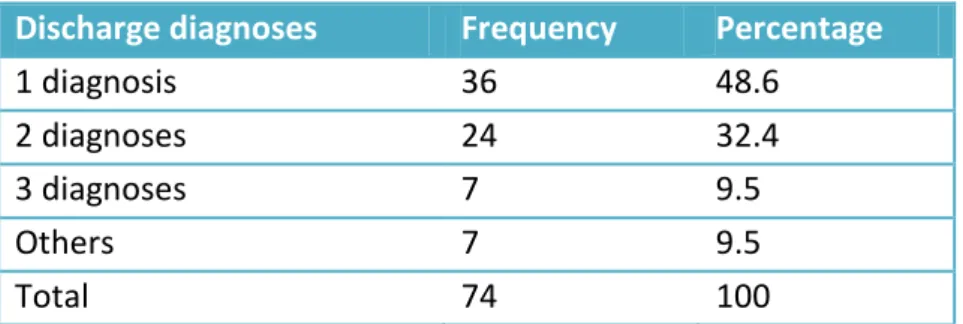
On discharge, the records showed that a significant number of children were discharged with multiple diagnoses. The majority of children 36(48.6%) were discharged with one diagnosis, 24(32.4%) were discharged with two diagnoses and 7(9.4%) were discharged with three diagnoses. The majority 36(48.6%) of the discharge diagnoses were classified under clinical stage III, and other diagnoses that could not be classified like ventricular septal defect (VSD), recto-vaginal fistula (RVF), convulsions, abscess, jaundice, CP (Cerebral Palsy), hyperglycaemia, cellulitis. See table 4.5 that follows.
Table 4.5: Distribution of discharge diagnosis for first readmission
Discharge diagnoses Frequency Percentage
1 diagnosis 36 48.6
2 diagnoses 24 32.4
3 diagnoses 7 9.5
Others 7 9.5
Total 74 100
4.2.5 Hospital stay
The average mean of the first readmission of the length of hospital stay (LOS) was 12.3 and SD (± 12.1) days.
SECTION B: Second readmission
4.3 Admission diagnosis
The mean interval between the discharge date of the first readmission and the second readmission date was 9.84 days and SD (7.02 days) and 94.6% of the readmissions occurred within the first two weeks of discharge date.
Table 4.6: Number of diagnoses for second admission
Number of Diagnoses Frequencies Percentage
1 diagnosis 7 10
2 diagnoses 15 24.3
3 diagnoses 6 8.6
4 diagnoses 8 11.4
5 diagnoses 2 2.9
6 diagnoses 4 2.9
Other 28 40
Total 70 100
Table 4.6 above shows that majority 15(24.3%) of children had two diagnoses, 8(11.4%) had four diagnoses, 6(8.6%) had three diagnoses, 2(2.9%) had five diagnoses, 4(2.9%) had six diagnoses and 7(10%) had one diagnosis.
According to the information which pertains to the second readmission, a total of 70 children were readmitted. Most of the children presented with different diagnoses. The most frequent classifications were diseases of the respiratory system and the digestive system as classified by the ICD10 codes.
Almost a third, 20(28.6%) were diagnosed with broncho-pneumonia, 17(24.3%) were diagnosed with respiratory distress, 7(10%) were readmitted with pulmonary TB, 5(7.1%) with gastro-enteritis 8(11.4%) with immunosuppression, 12(17.4 with diarrhoea, 9(12.7%) with vomiting, 7(10%) with respiratory distress, 2(2.7%) with failure to thrive, 6(8.1%) with TB, 4(5.7%) with marasmus, 7(10%) kwashiorkor, 12(17.4%) oral thrush, 4(5.7%) neonatal sepsis and other conditions that could not be classified like cerebral palsy (CP), ascitis, discharging eyes and discharging ears. See table 4.7 below.
Table 4.7: Classification of diseases at readmission 2
Classification Frequency Percentage
Broncho-pneumonia 20 28.6
Immunosuppression 12 17.4
Oral thrush 12 17.4
Gastro-enteritis 8 11.4
Respiratory distress 7 10
Vomiting 7 10
Kwashiorkor 7 10
TB 6 8.1
Pulmonary TB 5 7.1
Marasmus 4 5.7
Neonatal sepsis 4 5.7
Failure to thrive 2 5.7
The admission diagnoses were further classified according to the WHO clinical stage of diseases as shown in Table 4.8 below.
Table 4.8: WHO Clinical Staging of diseases of readmission 2
Number of diagnosis WHO clinical staging of HIV
Frequency Percentages
Admission diagnosis 1 (second
readmission)
Clinical stage II 3 4.1
Clinical stage III 40 54.1
Clinical stage IV 9 12.2
Other 18 24.3
Admission diagnosis 2(second
readmission)
Clinical stage II 9 12.2
Clinical stage III 23 31.1
Clinical stage IV 5 6.8
Other 21 28.4
Admission diagnosis 3(second
readmission)
Clinical stage II 6 8.1
Clinical stage III 15 20.3
Clinical stage IV 2 2.7
Other 11 14.9
Admission diagnosis 4(second
readmission)
Clinical stage II 2 2.7
Clinical stage III 12 16.2
Other 9 12.2
Admission diagnosis 5(2nd readmission)
Clinical stage I 1 1.4
Clinical stage III 5 6.8
Clinical stage IV 2 2.7
Other 2 2.7
Admission diagnosis 6(second
readmission)
Clinical stage III 2 2.7
Clinical stage IV 1 1.4
Other 3 4.1
Admission diagnosis 7(second
readmission)
Clinical stage III 1 1.4
Other 2 2.7