Rainy season characteristics with reference to maize production for the Luvuvhu River Catchment, Limpopo
Province, South Africa
by
Fhulufhelo Phillis Tshililo
Submitted in fulfillment of the academic requirements of
Master of Science in Agriculture
in Agrometeorology
Soil-Plant-Atmosphere-Continuum Research Unit School of Agricultural, Earth and Environmental Sciences
College of Agriculture, Engineering and Science University of KwaZulu-Natal
Pietermaritzburg South Africa
August 2017
ii PREFACE
The research contained in this dissertation was completed by the candidate while based in the Discipline of Agrometeorology, School of Agricultural, Earth and Environmental Sciences of the College of Agriculture, Engineering, and Science, University of KwaZulu-Natal, Pietermaritzburg, South Africa. The research was financially supported by Agricultural Research Council and Water Research Commission (Project no: K5/2403//4).
The contents of this work have not been submitted in any form to another university and, except where the work of others is acknowledged in the text, the results reported are due to investigations by the candidate.
Professor MJ Savage (Supervisor) Signed: ………..
Date: ………
Dr ME Moeletsi (Co-supervisor) Signed: ………..
Date: ………
iii DECLARATION 1: PLAGIARISM
I, Fhulufhelo Phillis Tshililo, declare that:
(i) the research reported in this dissertation, except where otherwise indicated or acknowledged, is my original work;
(ii) this dissertation has not been submitted in full or in part for any degree or examination to any other university;
(iii) this dissertation does not contain other persons’ data, pictures, graphs or other information, unless specifically acknowledged as being sourced from other persons;
(iv) this dissertation does not contain other persons’ writing unless specifically acknowledged as being sourced from other researchers. Where other written sources have been quoted, then:
a) their words have been re-written but the general information attributed to them has been referenced;
b) where their exact words have been used, their writing has been placed inside quotation marks, and referenced;
(v) where I have used material for which publications followed, I have indicated in detail my role in the work;
(vi) this dissertation is primarily a collection of material, prepared by myself, published as journal articles or presented as a poster and oral presentations at conferences. In some cases, additional material has been included;
(vii) this dissertation does not contain text, graphics or tables copied and pasted from the Internet, unless specifically acknowledged, and the source being detailed in the dissertation and in the References sections.
Signed: ………
Date: ……….
iv DECLARATION 2: PUBLICATIONS
My role in each paper and presentation is indicated. The * indicates the corresponding author.
The paper presented was based on the current project.
Chapter 4
1. Tshililo, F.P*., Savage, M.J., Moeletsi, M.E., 2016. Investigating rainy season characteristics with reference to maize production at the Luvuvhu River Catchment of South Africa. Paper presentation at the 17th WaterNet/WARFSA/GWP-SA Symposium 2016. 26 October 2016.
Gaborone, Botswana. The paper was presented by Tshililo FP.
Signed:………..
Date: ………..
v ABSTRACT
In arid and semi-arid regions, crop yields are mainly dependent on the amount and spatio- temporal distribution of rainfall. For most smallholder farmers in rural areas of southern Africa, rainfall is a critical input to agricultural production of most staple crops such as maize. To effectively plan for agricultural development, it is of utmost importance that the spatial distribution and temporal variation of rainfall is understood as it govern the type of farming systems that can be practiced in any region. Therefore, a detailed understanding of rainfall is necessary before any farming activities can commence. The study investigated rainy season characteristics with reference to maize production in the Luvuvhu River Catchment. Rainy season characteristics assessed included aridity index, onset, cessation, length of the season, false onset, dry spells, seasonal rainfall, number of rainy days and monthly rainfall. Historical daily rainfall and minimum and maximum air temperature data (1923-2015) were obtained from the Agricultural Research Council. Twelve meteorological stations that were evenly distributed and represented different climatic regions within the catchment were chosen.
An aridity index for different areas of the catchment was calculated using the United Nations Environment Programme equation. Evapotranspiration was calculated using the Hargreaves and Samani equation. Annual rainfall was calculated by summing daily rainfall from 1st January to 31st December. The Instat+ v 3.36 statistical programme was utilized to calculate onset, cessation, and length of the season, the number of rainy days, dry spells, seasonal rainfall and monthly rainfall. The Statistica software was used to generate descriptive statistics as well as to calculate probability of exceedance and non-exceedance for the rainy season characteristics. The Anderson-Darling goodness of fit test was performed to determine the distribution model that best represents the data. The resultant probabilities of exceedance were then computed from the distribution models that best fit the data. A non-parametric Spearman rank correlation coefficient test was used to analyze data for trends in rainy season characteristics as well as monthly rainfall.
The results from the study showed that monthly rainfall at the Luvuvhu River Catchment during the rainy season varies temporally and spatially. In the high rainfall areas of the catchment, the rainy season commences early from the third week of October and ends the first week of April the following year. For dry areas of the catchment, the rainy season commences
vi in the second week of November and ends early in the third week of February. The results further show a decrease in length of the rainy season, the number of rainy days, and seasonal rainfall further away from wet to dry areas of the catchment. There was no significant change on the onset of the rainy season on the catchment for the past 27-90 years. There is a high risk of both short and medium dry spells at most stations during the month of October, with, Folovhodwe, Phafuri and Sigonde being at highest risk. Farmers are therefore advised to use the first onset for land preparation and plant after the second onset in November and December to avoid the high risk of dry spells and false onset in October and November, depending on the location at the catchment. Folovhodwe, Mampakuil, Phafuri and Sigonde have a mean length of rainy season of less than 120 days and seasonal rainfall of less than 500 mm per rainy season.
Hence, these areas are not suitable for rain-fed maize in the current climate. However, they are suitable for the production of other crops which may be sold in order to purchase maize. The most favourable sites for maize production within the catchment are Entabeni, Levubu, Lwamondo, Thathe, Tshiombo, and Vreemedeling. Therefore, production should be maximized at these areas so that there is sufficient maize for the whole catchment.
In dry years, stations situated in the low-lying areas in the north-eastern and eastern parts of the catchments receive less rainfall which does not permit planting of maize. In normal and wet years, rainfall is sufficient for the production of various crops. However, in semi-arid areas of the catchment, plans should be made for supplementary water due to high evapotranspiration rates in order to maximize maize production. Stations in the middle/south western parts of the catchment can receive significant rainfall in both dry, normal and wet years. Trend analysis for long-term rainfall data did not show any significant changes in monthly rainfall except for Lwamondo and Levubu where an increasing trend is notable in January rainfall. In December, the rainfall trend was significant at Entabeni, Folovhodwe and Lwamondo. An increase in rainfall is notable at Lwamondo and a decrease in rainfall at Entabeni and Folovhodwe.
Keywords: Cessation, dry spells, length of the rainy season, onset, rainy days, and seasonal rainfall.
vii ACKNOWLEDGEMENTS
I would like to acknowledge the following people and organizations for their support and assistance with this dissertation:
Professor Michael J Savage for supervision and guidance. Your advice really helped in completing the dissertation and will also be useful in future;
Dr. Mokhele E Moeletsi, Agricultural Research Council Institute for Soil Climate and Water (ISCW), for mentorship, advice, and editing the dissertation;
Dr. Mitsuru Tsubo (ISCW), for editing the dissertation;
Agroclimatology staff at ARC-ISCW for support;
Agricultural Research Council Postgraduate Development Programme for funding my studies at the university;
Water Research Commission (Project no: K5/2403//4) for funding the project;
My parents for their everlasting love, encouragement and continuous support during the duration of the study;
My friends for their love and support.
viii TABLE OF CONTENTS
Page
PREFACE ... ii
DECLARATION 1: PLAGIARISM ... iii
DECLARATION 2: PUBLICATIONS ... iv
ABSTRACT ... v
ACKNOWLEDGEMENTS ... vii
TABLE OF CONTENTS ... viii
LIST OF TABLES ... xii
LIST OF FIGURES ... xiv
CHAPTER 1: INTRODUCTION ... 1
1.1 Rationale for the research ... 1
1.2 Aim ... 3
1.3 Objectives ... 3
1.4 Outline of the dissertation ... 4
CHAPTER 2: LITERATURE REVIEW ... 5
2.1 Introduction ... 5
2.2 Maize... 5
2.2.1 Importance of maize in the world ... 5
2.2.2 Maize in South Africa ... 6
2.2.3 Planting dates ... 6
2.2.4 Factors affecting maize growth ... 6
2.2.4.1 Air temperature ... 6
2.2.4.2 Rainfall ... 7
2.2.4.3 Planting dates ... 8
2.3 Rainy season characteristics ... 8
2.3.1 Onset and cessation ... 8
2.3.2 Length of growing season period ... 9
2.3.3 Dry spells ... 10
2.3.4 Wet spells ... 10
2.3.5 Relationship between rainy season characteristics and maize yield ... 11
ix
2.4 Rainfall variability ... 11
2.4.1 El Niño-Southern Oscillation (ENSO) ... 11
2.4.2 ENSO and rainy season characteristics ... 13
2.4.3 Relationship between ENSO and maize yields ... 14
2.5 Meteorological disasters ... 14
2.5.1 Drought ... 15
2.5.1.1 Causes of drought ... 15
2.5.1.2 Impacts of drought ... 17
2.5.2 Floods ... 17
2.5.2.1 Impacts of flooding ... 19
2.6 Climate change... 20
CHAPTER 3: MATERIALS AND METHODS ... 22
3.1 Study area... 22
3.2 Data acquisition ... 24
3.2.1 Daily rainfall and air temperature data ... 24
3.2.2 Data Patching ... 27
3.3 Determination of rainy season characteristics ... 27
3.3.1 Dry and rainy days ... 27
3.3.2 Onset, cessation and the length of the rainy season ... 27
3.3.3 False onset ... 28
3.3.4 Dry spells ... 28
3.3.5 Monthly rainfall ... 29
3.3.6 Aridity index ... 30
3.4. Data analysis ... 31
3.4.1 Statistical analysis ... 31
3.4.2 Probabilities of exceedance and non-exceedance ... 31
3.4.3 Trends ... 32
CHAPTER 4: RESULTS AND DISCUSSION ... 33
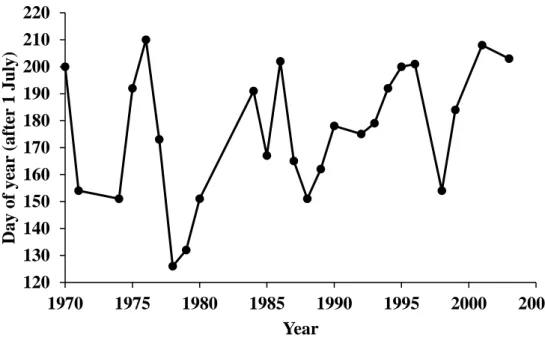
4.1 Onset of the rainy season ... 33
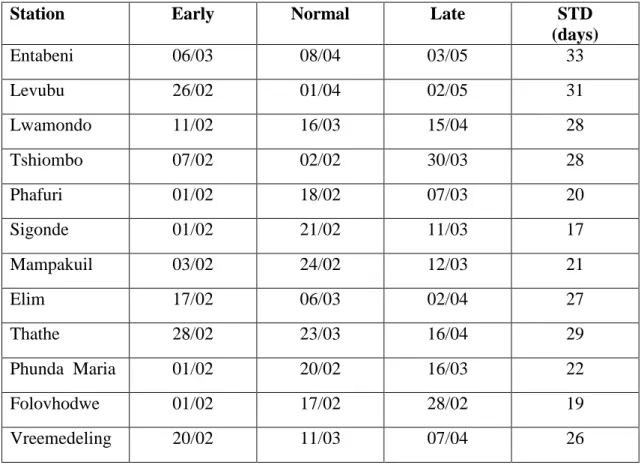
4.1.1 Early, normal and late onset dates ... 33
4.1.2 Trends ... 36
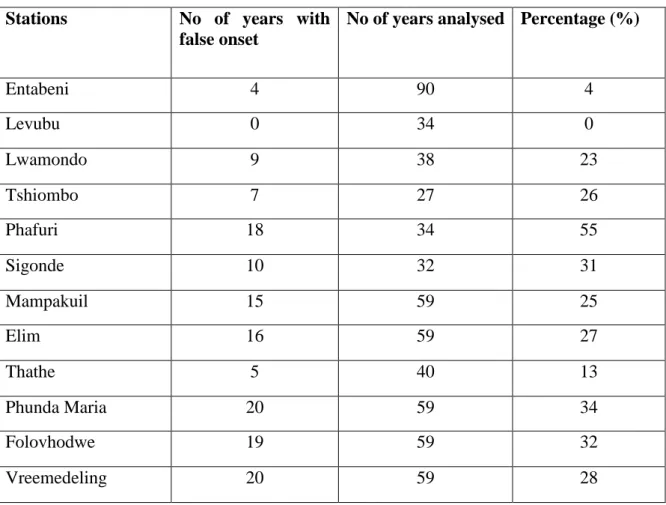
4.1.3 False onset ... 38
4.2 Cessation of the rainy season ... 38
4.2.1 Early, normal and late cessation ... 38
x
4.2.2 Trends ... 40
4.3 Length of the rainy season ... 42
4.3.1 Short, normal and long rainy season ... 42
4.3.2 Trends ... 43
4.4 Dry spells during rainy season ... 45
4.4.1 October ... 45
4.4.2 November ... 46
4.4.3 December ... 47
4.4.4 January ... 48
4.5 Monthly rainfall during the rainy season ... 49
4.5.1 Descriptive statistics ... 49
4.5.2 Probable monthly rainfall from October to April ... 52
4.5.2.1 October ... 54
4.5.2.2 November ... 54
4.5.2.3 December ... 54
4.5.2.4 January ... 55
4.5.2.5 February ... 55
4.5.2.6 March ... 55
4.5.2.7 April ... 56
4.5.3 Trend analysis ... 56
4.6 Seasonal rainfall ... 62
4.6.1 Dry, normal and wet seasons ... 62
4.6.2 Trends ... 62
4.7 Number of rainy days with 5 mm or more of rainfall ... 65
4.7.1 Low, normal and high number of rainy days ... 65
4.7.2 Trends ... 67
4.8 Number of rainy days with 10 and 20 mm ... 69
4.8.1 Low, normal and high number of rainy days ... 69
4.8.2 Trends ... 70
4.9 Relationship between rainy season characteristics ... 71
4.10 Aridity index and implications for crop production ... 73
CHAPTER 5: CONCLUSIONS AND RECOMMENDATIONS FOR FURTHER RESEARCH ... 77
5.1 Conclusions ... 77
xi
5.2 Findings... 78
5.3 Recommendations ... 80
5.4 Further research ... 81
REFERENCES ... 82
APPENDIX ... 94
xii LIST OF TABLES
Table Page Table 2.1 Primary and secondary impacts of droughts (Source: Vogel et al., 1999) ... 18 Table 2.2 The impacts of floods during the growing and non-growing period (Source: Johnson, 2003) ... 20 Table 3.1 Land uses at the Luvuvhu River Catchment (Source: Jewitt and Garratt, 2006) .... 23 Table 3.2 Geographic information of meteorological stations used in the analysis ... 26 Table 3.3 Probability distribution models used in the study (Source: Mzezewa et al., 2010) ... 30 Table 4.1 Early (20 %) probability of non-exceedance, normal (50 %) and late (80 %) onset dates for 12 meteorological stations at the Luvuvhu River Catchment ... 34 Table 4.2 Spearman rank correlation coefficient test results for first, second and third onsets within the Luvuvhu River Catchment ... 37 Table 4.3 Number of years with false onset at stations within the Luvuvhu River Catchment ... 39 Table 4.4 Early (80 %) probability of exceedance, normal (50 %) and late (20 %) cessation dates and standard deviation (STD) for 12 meteorological stations at the Luvuvhu River Catchment. ... 40 Table 4.5 Spearman rank correlation coefficient test results for the cessation of the rainy season for the various stations within the catchment ... 41 Table 4.6 Short (20 % probability of non-exceedance), normal (50 %) and long (80 %) length of the rainy season and standard deviation (STD) ... 43 Table 4.7 Spearman rank correlation coefficient test results for the duration of the rainy season ... 44 Table 4.8 Probability of dry spells (%) in October for more than the indicated number of dry days ... 46
xiii Table 4.9 Probability of dry spells (%) in November for more than indicated number of dry
days ... 47
Table 4.10 Probability of dry spells (%) in December for a more than indicated number of dry days ... 48
Table 4.11 Probability of dry spells (%) in January for more than the indicated number of dry days ... 49
Table 4.12 Descriptive statistics for monthly rainfall from October to January ... 50
Table 4.13 Descriptive statistics for monthly rainfall from February to April ... 51
Table 4.14 Anderson-Darling goodness of fit test results ... 53
Table 4.15 Probability of non-exceedance (20, 50, and 80 %) for monthly rainfall totals from October to April ... 57
Table 4.16 Spearman correlation coefficient test results for monthly rainfall from October to April ... 58
Table 4.17 Dry (20 % probability of non-exceedance), normal (50 %), wet (80 %) rainy seasonal rainfall (mm) and standard deviation (STD) ... 63
Table 4.18 Water requirements for different crops (Source: Brouwer and Heibloem, 1986) . 64 Table 4.19 Spearman rank correlation coefficient test results for the seasonal rainfall ... 64
Table 4.20 Low (20 % probability of non-exceedance), normal (50 %) and high (80 %) number of rainy days and standard deviation (STD) at the catchment ... 66
Table 4.21 Spearman rank correlation coefficient test results for the seasonal rainfall ... 67
Table 4.22 Low (20 % probability of non-exceedance), normal (50 %) and high (80 %) number of days with cumulative rainfall exceeding 10 and 20 mm and standard deviation (STD) ... 69
Table 4.23 Multiple regression analysis results between rainy season characteristics ... 72
Table 4.24 Agro-climatic zones of the 12 selected stations at the Luvuvhu River Catchment74 Table 4.25 Rainwater management strategies used in improving rain-fed yields (Source: Rockstrom et al., 2003) ... 76
xiv LIST OF FIGURES
Figure Page
Figure 2.1 Rainfall conditions during El Niño event (Source: www.iricolumbia.edu) ... 13
Figure 2.2 Rainfall condition around the world during La Niña event (Source: www.iricolumbia.edu) ... 13
Figure 2.3 Different types of droughts and their connections and impacts (Source: Sheffield and Wood, 2011) ... 16
Figure 2.4 The physical causes of floods in relation to other environmental hazards (Source: Smith, 2004) ... 19
Figure 3.1 Location of the study area ... 23
Figure 3.2 Elevation at the Luvuvhu River Catchment ... 25
Figure 3.3 Annual rainfall at the Luvuvhu River Catchment ... 25
Figure 3.4 Location of meteorological stations within the Luvuvhu River Catchment... 26
Figure 4.1 Temporal variation in the third onset dates at Phafuri ... 36
Figure 4.2 Temporal variation in the cessation of the rainy season at Entabeni ... 42
Figure 4.3 Temporal variation in the length of the rainy season at Entabeni ... 44
Figure 4.4 Temporal variation in the length of the rainy season at Thathe ... 45
Figure 4.5 Monthly rainfall from October to April at the catchment ... 52
Figure 4.6 Temporal variations in December rainfall for Lwamondo, Entabeni, and Folovhodwe... 59
Figure 4.7 Temporal variations in January rainfall for Levubu and Lwamondo ... 60
Figure 4.8 Temporal variations for April rainfall for Folovhodwe and Mampakuil ... 61
Figure 4.9 Temporal variation in seasonal rainfall at Levubu, Lwamondo and Entabeni ... 65
Figure 4.10 Temporal variation for the number of rainy days for Levubu, Vreemedeling, and Entabeni ... 68
xv Figure 4.11 Temporal variations in the number of rainy days with cumulative rainfall of above 10 and 20 mm for Lwamondo and Levubu ... 70 Figure 4.12 Temporal variations in number of rainy days with cumulative rainfall exceeding 10 and 20 mm at Entabeni ... 71
1 CHAPTER 1: INTRODUCTION
1.1 Rationale for the research
Most socio-economic activities in Africa including South Africa, especially agriculture, depend on climate and specifically rainfall (FAO, 2004). A study in South Africa by Kruger (2006) investigating trends in annual precipitation showed a significant decrease in the northern parts of Limpopo, the southern part of Mpumalanga, north-eastern Free State and western KwaZulu- Natal for period 1910-2004. There have also been changes in monthly rainfall over the past years (Hewitson et al., 2005). Climate variability and change have a direct impact on the productivity of many socio-economic activities (Obasi, 2005). The agricultural sector will be the most affected sector by climate change in South Africa due to its reliance on climate variables such as air temperature and rainfall (Benhin, 2006). The reliance of farmers on rainfall, which varies annually, makes them vulnerable to rainfall variability (Vogel and O’
Brien, 2003). Rainfall variability poses a threat to farmers’ livelihoods and agricultural production (Ambrosino et al., 2014) as food production in Africa is one of the most vulnerable sectors due to extensive reliance on rain-fed crop production. High intra-and inter-seasonal climate variability, recurrent droughts, and floods that affect both crops and livestock, and persistent poverty that limits the capacity to adapt to climate change also contribute to making Africa vulnerable (Boko et al., 2007). Across the globe, rain-fed agriculture is practiced in 80
% of the agricultural areas. In sub-Saharan Africa, 93 % of the cultivated land is rain-fed.
Therefore, rain-fed agriculture plays a significant role in food security (Chikodzi et al., 2012) as water is said to be the limiting factor in agricultural production in South Africa (Maponya, 2011). It has been projected that by 2020, 75-250 million people will be exposed to increased water scarcity and production from rain-fed agriculture could decrease by 50 % (IPCC, 2007).
Regardless of the increase in fertilizer use and improvement in planting technologies, the climate within the growing period still plays a significant role in agricultural production (Ayoade, 2004). Other factors affecting crop production include soil properties and farm management practices (Munodowafa, 2011). However, fertilizer application is critically dependent on rainfall, making rainfall the most important factor affecting crop production as water availability is essential in sustaining crop productivity in rain-fed agriculture (Munodowafa, 2011). Even if drought tolerant cultivars are planted, water will not be available to crops when there is no water in the soil as variations in rainfall from season to season affects
2 soil water availability to crops which then poses crop production risks (Harvest Choice, 2010).
Irrigation is said to be an important approach to deal with the current climatic conditions in semi-arid areas as rain-fed agriculture is still dominant in most developing countries (Tilahun, 2006). Rainfall variability and patterns of extremely high or low rainfall are very important for agriculture as well as to the economy of those depending on rain-fed agriculture (Igwenagu, 2015).
Rainy season is defined as that period when a significant amount of rainfall occurs and can vary from place to place (Smith et al., 2008). Rainy season characteristics of importance to agriculture are onset, cessation, and length of the growing season, rainfall amount and the probability of dry spell occurrence during the growing season (Hassan and Stern, 1988).
Delayed onset of the rainy season, especially in semi-arid regions of southern Africa, extends the growing period of summer crops into winter (Mubvuma, 2013). However, planting after a false early onset may result in crop failure which leads to expensive re-planting (Ayoade, 2004). Information regarding the onset of rainy season assists farmers with the preparation of land, seeds, manpower and equipment (Omotosho et al., 2000).
Another important feature of the rainy season is the cessation of the season; if cessation occurs early, the crops might experience low cob development resulting in poor harvest (Stern and Coe, 1984). Information on the cessation of rainy season also helps in assessing the possible length of the rain-fed cropping season and provides information on possible information on optimal harvesting and storage of crops (Hachigonta et al., 2008). Heavy rainfall at the end of the rainy season can cause crops to spoil or prevent ripening and harvesting (Stern and Coe, 1984). Yield may be significantly affected by late onset or early cessation of the season as well as damaging dry spells during the season (Ati et al., 2002; Mugalavai et al., 2008). Farmer’s main concerns are for rainfall to be consistent throughout the season so there is guaranteed sufficient soil water at planting and that those conditions are maintained throughout the season (Walter, 1967). If farmers are given information on the seasonal distribution of rainfall, they can choose to plant either more drought-tolerant crops or long maturing varieties (Tadross et al., 2003).
Maize is the largest locally produced crop (Ambrosino et al., 2014) and is the primary staple food in South Africa accounting for around 70 % of caloric human intake (Martin et al., 2000;
3 Akpalu et al., 2003). Maize is grown extensively under rain-fed conditions in southeastern Africa including South Africa (Akpalu et al., 2003). An analysis of maize production in the last two decades indicated that maize production has either stagnated or declined even though the harvested area has increased (Kandji et al., 2006). Maize can adapt to harsh conditions but high air temperatures and low rainfall could have a serious effect on yield (Akpalu et al., 2003) as rainfall is the most significant driver of maize production. Climate change will not only have negative impacts in South Africa but also southern Africa as a whole since South Africa is the major source of food for the region (Benhin, 2006). South Africa produces 50 % of the total output of maize in southern Africa. Therefore, a decrease in maize yield could increase food insecurity in the region (Akpalu et al., 2003). Information regarding rainfall probabilities and the rainy season is necessary for the design of water supply, supplemental irrigation schemes and for the evaluation of alternative cropping systems under different scenarios, i.e. dry, normal and wet years (Hossain and Anam, 2012).
1.2 Aim
The main aim of this study was to investigate rainy season characteristics with reference to rain-fed maize production in the Luvuvhu River Catchment of Limpopo Province of South Africa using historical data. The rainy season characteristics investigated include onset, cessation length of the rainy season, a number of rainy days, monthly and total seasonal rainfall.
1.3 Objectives
To investigate the rainy season characteristics using daily historical rainfall data.
Changes in the rainy season characteristics such as onset, cessation, length of the season, number of rainy days with reference to rain-fed maize production.
Characterisation of monthly rainfall during rainy season (October to April) to determine monthly rainfall statistics, trends and probable monthly rainfall amounts under different rainfall scenarios such as dry, normal and wet year with reference to rain-fed maize production.
4 1.4 Outline of the dissertation
Chapter 1 provides an introduction to the study, detailing the importance of rain-fed agriculture and the effects of the rainy season characteristics on agriculture.
Chapter 2 focuses on the literature review. It focuses on maize production including its importance, planting dates, climatic requirements as well as factors affecting growth at different growth stages. Rainfall variability with the main focus on ENSO and its implication of rainy season characteristics was also reviewed. It also considered different meteorological disasters that occur during the rainy season. Lastly, the chapter reviews climate change as well as its impacts on maize production.
Chapter 3 focuses on the materials and methods used in the study, giving details on the study area, data and how it was analysed. The software and equations used in analysing the data are also explained as well.
Chapter 4 gives the results of the study.
Chapter 5 is the last chapter of the dissertation and includes the conclusion and recommendations of the study as well as further research that can be conducted in the study area to improve maize yield.
5 CHAPTER 2: LITERATURE REVIEW
2.1 Introduction
Growing season variability is an important indicator of climate change. This is caused by the relationship between climate and growing season characteristics such as onset and cessation (Linderholm et al., 2008). The onset and cessation of rains seems as if they have shifted and will shift even further from their normal calendar dates (ICSU, 2008; Hansen et al., 2012).
IPCC (2013) reported that rainfall characteristics such as onset, duration of the rainy season, frequency of dry spells, and rainfall intensity have changed over the years in southern Africa It is expected that the changes will have an impact on crop production especially maize.
2.2 Maize
2.2.1 Importance of maize in the world
Maize (Zea mays) is the most important cereal worldwide with the largest global production (Fischer et al., 2014). Maize is believed to have originated from central Mexico 7000 years ago and is currently being produced in 100 million ha from 125 developed countries (Ranum et al., 2014). Seventy percent of maize produced in developing countries is produced by low and lower middle-income countries (Thornton and Crane, 2012). It is the most important source of food nutrition for millions of people in developing continents such as Africa and Latin America (Smale and Jayne, 2003; IITA, 2009; Fischer at al., 2014). Maize is amongst three most widely grown grain crops in 75 % of these developing countries (Thornton and Crane, 2012). Together with rice and wheat, maize provides at least 32 % in food calories to more than 4.5 billion people in 94 developing countries (Thornton and Crane, 2012). At the continental level, the largest producers of maize are North America (41 %), Asia (28 %), Europe (10 %), South America (10 %) and sub-Saharan Africa (6 %) (Fischer et al., 2014). At the country level, the largest maize producers are USA (38 %), China (20 %), Brazil (7 %) and Mexico (3 %) (Fischer et al., 2014). Although the production of maize in sub-Saharan Africa is low when compared to other countries, maize plays a significant role in food security in eastern and southern Africa and is consumed by 50 % of the population, but it is less important in western and middle Africa as it is mainly used for animal feed (Fischer et al., 2014).
6 2.2.2 Maize in South Africa
In South Africa, maize constitutes about 70 % of grain production and covers 60 % of the cropping area (Akpalu et al., 2008). Maize is the largest locally produced grain crop in South Africa and is the largest source of carbohydrates in the southern Africa region (DAFF, 2008).
Annually, South Africa produces approximately 8 million tons of maize grain on 3.1 million ha with half being white maize for human consumption (du Plesis, 2003). Maize is produced all over South Africa with 84 % of maize produced in the Free State, Mpumalanga, and Northwest (DAFF, 2011). Commercial farmers produce 98 % of maize while the remaining 2
% is produced by small-scale farmers (DAFF, 2011). White maize is generally produced in the western part of the country while yellow maize is produced in the eastern part (DAFF, 2008).
Two-thirds of maize in Africa is produced in eastern and southern Africa with South Africa being the largest producer (Nafziger, 2010).
2.2.3 Planting dates
Planting dates of maize are determined by rainfall patterns and weather conditions (Baloyi, 2012). Maize in South Africa is usually planted in November and December and harvested from late May to August. However, depending on the rainfall patterns, maize can be planted as early as October and late in January (Baloyi, 2012). Since South Africa has different climate regions, different planting dates have been suggested for western and eastern maize producing areas (DAFF, 2008). Maize is planted from October to the first week of November in the cooler eastern producing areas (DAFF, 2008). In drier, western producing areas maize is planted from the last two weeks of November to mid-December. From the last week of October to mid- November maize can be planted in the central regions of South Africa (DAFF, 2008).
2.2.4 Factors affecting maize growth
2.2.4.1 Air temperature
Maize is regarded as a warm-weather crop (Whitmore, 2000) which is not suitable in areas where mean daily air temperature can be less than 19 ºC (du Plesis, 2003). Early maturing maize cultivars can reach maturity in 80 to 110 days when mean daily temperature exceeds 19
oC (Whitmore, 2000). Maize is sensitive to frost occurrence at all stages as it can damage maize growth and thus, it should be grown during a frost-free period and in areas that are less
7 vulnerable to frost (du Plesis, 2003). The optimum air temperature required for successful maize crop growth are 18 to 32 ºC (du Plesis, 2003). Air temperatures directly affect photosynthesis, respiration, transpiration of crop, absorption of water and nutrients (Akbar et al., 2008). The rate of these processes is said to increase with an increase in temperature. Air temperatures above 35 ºC have detrimental effects on maize growth (du Plesis, 2003). Air temperatures less than 10 ºC slows down growth and development (Belfield and Brown, 2008).
Ideal temperature for flowering is between 19 to 25 ºC. For germination, the optimum temperatures are 12 ºC or greater (Baloyi, 2012). Optimum flowering occurs when the temperatures range from 19 to 25 ºC. Tasselling occurs best when air temperatures are between 21 and 30 ºC (Belfield and Brown, 2008). High-temperature exceeding 30 ºC causes stagnated growth, wilting, top firing, tassel blask, silking decay, desiccation, pollen abortion, poor seed set which eventually results in yield loss (Akbar et al., 2008).
2.2.4.2 Rainfall
Rainfall is the most important factor affecting crop production especially in dry land farming areas where rainfall is the only source of water for crop production (Ramos, 2001). The quantity of rainfall received at any place over a period of time gives a general picture of its efficiency to meet crop water needs (Weerasinghe, 1989). In semi-arid regions, the yield parameters depend on the amount and temporal distribution of rainfall (Munodowafa, 2011). Maize can be grown under rain-fed or irrigation conditions (Nafziger, 2010). Water is said to be the most yield-limiting factor in maize production. Although maize crop is water-efficient, in order to produce high yields a considerable amount of rainfall is required (Belfield and Brown, 2008).
Maize can grow and yields with as little as 300 mm of rainfall per annum (Belfield and Brown, 2008), however, 500 to 700 mm of rainfall is required for adequate soil water annually (DAFF, 2008). Under rain-fed which is the most common cropping system, available plant water is supplied by seasonal rainfall and stored in the soil and thus, maize flourish when planted on soils with high water holding capacity (Nafziger, 2010). The growth of the maize plant is controlled by low and high levels of water as sufficient soil water improves nutrients uptake (Tidsale et al., 1990). When plant available water is low, nutrient availability is limited as low water levels retard the processes that are involved in nutrient uptake such as diffusion. On the other hand, excessive amounts of water results in lack of oxygen which restrict respiration and ion absorption. If maize is subjected to a short drought, it can recover after good rains (Whitmore, 2000). Mid-season drought is more damaging than drought occurrence at the start
8 or end of the season. If drought occurs at the beginning of the season, a farmer might re-plant but if drought occurs in the middle of the season it might be late for the farmer to replant and yield just decreases or total crop failure occurs (Boken et al., 2005).
2.2.4.3 Planting dates
Planting date including all the other factors such as erratic seasonal rainfall and rainfall variability continuously affect maize yield (Kgasago, 2006). Mid-summer drought occurs in Mid-December to mid-January in most part of South Africa hence, the occurrence of mid- summer drought plays an important parts in selecting planting dates (Kgasago, 2006). The farmer has to make sure that the growth stage of maize sensitive to heat and water stresses do not coincide with the mid-summer drought (ARC-GCI, 1999).
An experiment in East Africa showed that planting maize early during the rainy season or even before the rainy season begins produces a higher yield of maize compared to planting later.
Maize planted on the 4th of March at Kakamega in Kenya produced 9632 kg ha-1 whereas the maize that was planted in April produced 1972kg ha-1 (Turner, 1966). A two month delay in planting after the rainy season had commenced caused a reduction in maize yield from 4390 to 2598kg ha-1. At the beginning of the rainy season soil has a flush of nitrogen therefore maize planted early stands a good chance of benefiting from improved supply of nitrogen. Maize planted late receives low rainfall during the most important stage in maize (tasselling to maturity) when compared to maize planted early. Low yield of maize that was planted late was caused by water stress that was experienced during grain forming (Turner, 1966).
2.3 Rainy season characteristics
2.3.1 Onset and cessation
The onset of the rainy season is defined as a time a region receives an accumulated amount of rainfall sufficient for the growing of crops and it is not the first day of rains (Oruonye et al., 2016). Cessation refers to the termination of effective rainfall and does not necessarily mean the last day of rainfall (Oruonye et al., 2016). The onset of the rainy season is the most critical rainy season characteristic as it indicates the start of the growing season and planting date for farmers (Mubvuma, 2013). Early onset of rainfall has been found to be the main cause of longer duration of the rainy season, therefore causing high season rainfall in Free State (Moeletsi and
9 Walker, 2011). Tadross et al. (2007) noted that onset of the rainfall for the growing season has been occurring late in most parts of the southern African countries. A study prepared by Mubvuma (2013) looking at the rainy season trends for period 1971-2001 in the semi-arid regions of Zimbabwe revealed that the onset of the rainy season has shifted from late October to late November. Chikodzi et al. (2011) showed that over the years the rainy season has been commencing late and ending early and is characterised by increased incidents of mid-season drought. A delay in the onset of rains causes a short growing season and an early onset leads to a longer growing season (Sivakumar, 1988; Mupangwa et al., 2011). A study conducted in Kano region in Nigeria showed that growing season is starting late and ending early, therefore causing a short growing season (Sawa et al., 2014). However, studies by Raes et al. (2004), Mugalavai et al. (2008) and Mupangwa et al. (2011) reported no changes on the onset of the rainy season in western Kenya and Zimbabwe.
2.3.2 Length of growing season period
Growing season is defined as a period in a year in which the rainfall is suitable for crop production and it varies spatially, temporarily and also with crop type (Odekunle, 2003). The length of growing season information is a determinant of crop/cultivar that can be planted in the region (Mavi, 1986). Mapungwa et al. (2011) concluded that the length of the growing season does not have an effect on the amount of rainfall but it can a have an effect on the number of wet days or rainfall events. The average length of the growing season in southern African countries such as Malawi and Zambia was found to be between 90-120 days (Tadross et al., 2007). The longest period of the growing season was found to be 224 days in Matops in Zimbabwe while the shortest was 38 days in Filabusi and Beitbridge in Zimbabwe in the study conducted by Mapungwa et al. (2011). Adamgbe and Ujoh (2013) found 267 days to be the longest duration of the growing season in Ghoko in Nigeria and the shortest length of the rainy season was 146 days in 1983. Mubvuma (2013) noted that the length of the growing season increased when the onset of the rainy season commenced early. For example, the study revealed that the year with the longest growing season of 150 days had an early onset at the end of September while the shortest period of 77 days had a later onset on the 1st of December (Mubvuma, 2013).
Studies conducted by Sikavumar (1988) and Chiduza (1995) also confirmed that there is a strong correlation between onset and the length of the growing season. A study conducted in
10 Masvingo Province in Zimbabwe by Mubvuma (2013) showed that the length of the growing season has shifted from 120 days to 100 days in Zimbabwe which is not suitable for maize production.
2.3.3 Dry spells
Dry spells are defined as a sequence of dry days bracketed by wet days on both sides (Kumar and Rao, 2005). Dry spell analysis assists in calculating the probability of intra-seasonal drought (Cook et al., 2004). Dry spells result from poor rainfall distribution (Woltering, 2005).
Crops do well with consistently spread rains than with heavy rainfall interrupted by long periods of dry spells (Usman and Reason, 2004). A study in Limpopo province revealed that there had been an increase in dry spell frequencies from December to February for 1979-2002 (Reason et al., 2005). A study by Simba et al. (2012) indicated that there is an increase in the length of dry spells with time in Masivingo Province in Zimbabwe. It has been projected that there will be a significant reduction in the number of dry spells for 2014-2070 and 2071-2100 periods for Africa (Bougalia and Sushama, 2013). The results imply that dry spells will occur over a long period and will increase in magnitude for 2041-2070 (Bougalia and Sushama, 2013). A study in the Rushinga District of Zimbabwe by Nyakudya and Stroosnijder (2011) showed that dry spells of more than 20 days occurred in dry to above normal years and not during wet years. A dry season is characterised by a high number of dry spells (Mupangwa et al., 2011). A study by Mzezewa et al. (2010) revealed that there was a high probability of having a 3-day dry spell than 10 and 21-days dry spells at Thohoyandou in the Limpopo Province.
2.3.4 Wet spells
Wet spells are defined as a sequence of rainy days bracketed by dry days on both sides (Kumar and Rao, 2005). A study conducted by Hudson and Jones (2002) revealed that there had been a decrease in the number of wet days per year in southern Africa. Late onset of the rainy season causes a decrease in the number of wet days while an early onset causes a longer growing season (Mupangwa et al., 2011). Frequent and intense wet spells can cause floods, which can lead to crop failure (Reason et al., 2005). Wet seasons were found to be characterised by a high number of wet spells (Mupangwa et al., 2011). A study by Cook et al. (2004) showed that
11 during dry summers there was a decrease in the number of intense wet spells of more than 5 mm per day.
2.3.5 Relationship between rainy season characteristics and maize yield
Perfect timing of the planting dates is one of the key factors which affect crop production in rain-fed agriculture (Raes et al., 2004). A study conducted by Adagmbe and Ujoh (2013) in Nigeria showed that there is a strong relationship between rainy season characteristics and maize yield. A strong correlation was obtained between rainy days (0.747), annual (0.599) and maize yield. Ifabiyi and Omoyosoye (2011) also found a strong correlation between rainy days and maize yield in Nigeria. This means that the higher the number of rainy days the higher the maize yield per hectare (Adagmbe and Ujoh, 2013). Adagmbe and Ujoh (2013) showed a strong relationship between annual rainfall and maize production in Nigeria. This means that annual rainy days and rainfall amount of rainfall has the greatest effect on maize yield (Ifabiyi and Omoyosoye, 2011). However, a study by van Oosterhout (1996) revealed that years with the highest rainfall amount did not have the highest maize yield.
Studies by Stanton and Cammack (1953) indicated that if crops are planted early, the yields will be higher. Low rainfall results in low maize yield (Adagmbe and Ujoh, 2013), but high rainfall does not necessarily cause high yield especially in areas with high rainfall (Usman and Reason, 2004). Poor crop production in semi-arid areas is caused by unreliable rainfall and worsened by high runoff and evaporation (Hensley et al., 2000). A study conducted in southern Africa revealed that there is an increase in mean dry spell length that has caused a decrease in rainy day frequency in Zambia, Malawi and Zimbabwe during the growing season (Tadross et al., 2007). A study by Banziger and Diallo (2001) revealed that there is a relationship between rainfall and average maize yield in eastern and southern Africa, with an increase in rainfall causing an increase in maize production and a decrease in rainfall causing a decrease in maize yield.
2.4 Rainfall variability
2.4.1 El Niño-Southern Oscillation (ENSO)
ENSO is one the most significant causes of climate variability on a yearly basis in southern Africa including South Africa (Nicholson and Selato, 2000; Sheffield and Wood, 2011). ENSO is a naturally occurring global phenomenon which is caused by interactions between ocean and
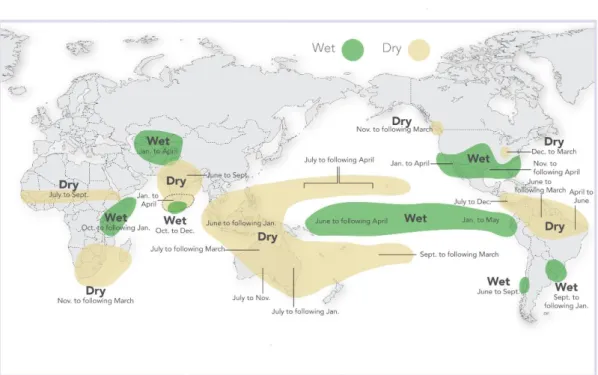
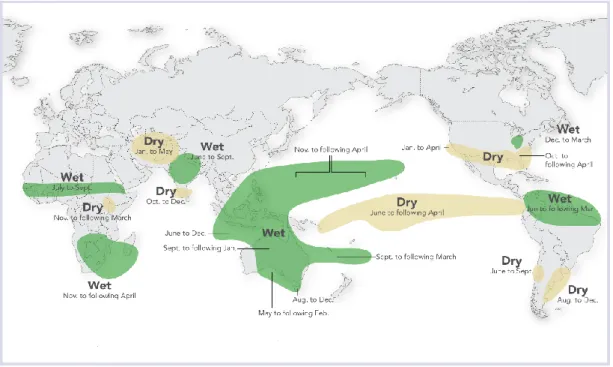
12 atmosphere in the tropical-subtropical pacific to Indian Ocean (Tyson and Preston-Whyte, 2000). ENSO is characterized by three phases which are El Niño (warm phase), La Niña (cold phase) and the neutral phase (Diaz and Markgraf, 2000; Tyson and Preston-Whyte, 2000). El Niño refers to a large-scale warming of the equatorial eastern and central Pacific Ocean caused by disruption of the ocean-atmosphere system (Figure 2.1) (FAO, 2004). El Niño events last for a period of 12 to 18 months and re-occur irregularly at an interval of two to seven years (Babkina, 2003). La Niña refers to abnormally cold temperatures in the south equatorial Pacific Ocean (FAO, 2004). During La Niña major rainfall producing systems are located over southern Africa and results in above-normal rainfall (Figure 2.2) (Tyson and Preston-Whyte, 2000). During an El Niño, major rainfall producing systems are displaced from the interior to the oceans (Cook, 2000; Tyson and Preston-Whyte, 2000) and therefore result in warm and below normal rainfall in southern Africa (Figure 2.2) (Jury, 2001). During an El Niño, southern Africa is marked by widespread drought conditions (Cook, 2000; Jury and Lyons, 1994).
Figure 2.1 Rainfall condition around the world during El Niño event (Source:
www.iricolumbia.edu)
13
Figure 2.2 Rainfall conditions during La Niña event (Source: www.iricolumbia.edu) 2.4.2 ENSO and rainy season characteristics
South Africa is one of the regions in southern Africa for which rainfall is influenced by ENSO (Reason and Mulenga, 1999; Lindesay et al., 1986; Nicholson and Selato, 2000; Tsubo and Walker, 2007). Different studies such as those done by Lindesay et al. (1986) have shown a relationship between rainfall and ENSO events in eastern and southern Africa. Climatic records in Africa showed that severe droughts that have occurred in certain parts of continents are interrelated to ENSO events (Tadross et al., 2007). El Niño results in decreased rainfall and droughts during summer season (Figure 2.1) (Reason and Jagadheesha, 2005). A decrease in rainfall causes negative impacts on crop production. During the El Niño years, there is a delay in the onset of the rainy season and low seasonal rainfall (Tadross et al., 2003; Moeletsi et al., 2011). A study by Hachigonta and Reason (2006) showed that during El Niño years there was an increase in dry spell frequencies in southern Zambia. La Niña years are characterized by above-normal seasonal rainfall, early onset, and flooding (Figure 2.2) (Tyson and Preston- Whyte, 2000). Low rainfall during El Niño years is caused by a short growing season period (Phillips et al., 1998). A study by Phillips et al. (1998) in Zimbabwe showed that there is a possibility of experiencing short season drought in January during La Niña and El Niño events when compared to neutral years.
14 2.4.3 Relationship between ENSO and maize yields
A study by Tsubo and Walker (2007) revealed that there is a connection between ENSO and summer rainfall in the Free State province. The results from their study further showed that there is a low risk of planting maize during La Niña years while there is a high risk during El Niño years. The rainfall that occurs during El Niño events is not suitable for crop production.
A study by Moeletsi et al. (2011) in the Free State revealed that during El Niño events the length of the growing season tends to be shorter and causes a decrease in total seasonal rainfall.
During La Niña events, there is a longer growing season period which results in high seasonal rainfall (Phillips et al., 1998; Nicholson et al., 2000). Results from a study by Moeletsi et al.
(2011) in Free States also showed a low production of maize during these El Niño events of 1972/73, 1982/83, 1983/84, 1991/92, and 1994/95. The maize production was reduced from 3 to 1.5 million tons. The above yields imply that during El Niño events the production is 50 % less than the mean in Free State. Moeletsi et al. (2011) concluded that during El Niño years there is low production while during La Niña there is high production of maize. If dry spells occur during the pollination period it can lead to few kernel developing which results in low maize yields (Phillips et al., 1998). Planting early helps in shifting pollination period to December before January dry spells occur. The study by Philips et al. (1998) also showed that simulated maize yield during El Niño events resulted in low maize yields. Planting maize early during both ENSO events (El Niño and La Niña) increases maize yield when compared to neutral years (Phillips et al., 1998).
2.5 Meteorological disasters
Natural disasters are defined as “serious disruptions of the functioning of the society, causing widespread human, material or environmental losses which exceed the capacity of the affected society to cope using only its own resources” (Sivakumar, 2005). Hydro-meteorological disasters include landslides/avalanches, drought/famine, extreme temperatures and heat waves, floods, hurricanes, forest/scrub-fires, wind storms and insect infestations. From 1993-2002 there has been a rising trend in natural disasters (Sivakumar, 2005). For the period 2003-2013, natural disasters and hazards in developing countries affected more than 1.9 billion people and caused damage amounting to USD 494 billion (FAO, 2015). Twenty-two percent of the economic damage and loss caused by climate-related disasters such as floods, drought, and tropical storms is in the agricultural sector (FAO, 2015). Increases in the level of dependency
15 on agriculture, especially rain-fed agriculture, make southern Africa at risk of experiencing climate-related disasters such as floods and drought (Bola et al., 2013).
2.5.1 Drought
Drought is a recurring phenomenon in southern African agricultural climate (Vogel, 1994).
Unganai (1994) indicated that it is becoming unusual for drought not to occur somewhere in southern Africa every year. Drought is defined as the period in which there is low/insufficient amount of water in rivers, lakes, reservoirs, soil water and groundwater (Sheffield and Wood, 2011). Drought is classified into four types namely, meteorological, hydrological, and agricultural/soil water and socio-economic (Figure 2.3) (Whitmore, 2000; Boken, 2005). A meteorological drought occurs when seasonal or annual rainfall is lower than the long-term average (Boken, 1995; Whitmore, 2000). Hydrological drought occurs when meteorological drought is prolonged and leads to a decrease in the supply of surface and ground water (Wilhite and Glantz, 1985; Sheffield and Wood, 2011). Agricultural drought occurs when there is a deficit in soil water caused by meteorological and hydrological drought. A socioeconomic drought is a combination of the meteorological, hydrological and agricultural drought which leads to undesirable social and economic impacts (Wilhite and Glantz, 1985; Sheffield and Wood, 2011; Sen, 2015).
2.5.1.1 Causes of drought
Drought is mainly caused by high rainfall variability in South Africa and occurs as a result of below normal rainfall (FAO, 2004). Drought may also be caused by anthropogenic factors such as over-pumping of ground water, diverting rivers and farming intensively in agricultural lands (Sheffield and Wood, 2011). There is a strong relationship between ENSO events and precipitation in areas that are affected by ENSO events. ENSO accounts for 50 % of rainfall variability in eastern and southern Africa (Ogallo, 1994). During an El Niño which is the high phase of ENSO, large parts of southern Africa experience drier than normal conditions. A study by Rasmussen (1987) revealed that from 1875 to 1978 there were 24 ENSO events, 17 events were linked to 10 % decrease in rainfall.
16 Climate variability
Meteorological Drought
Precipitation deficit High evaporation
Agricultural
Drought Soil water deficiency
Vegetation stress, reduced crop yield
Hydrological
Drought Reduced stream flow, groundwater and inflows to lakes, reservoirs and wetlands
Impacts Economic Social Ecological
Figure 2.3 Different types of droughts and their connections and impacts (Source: Sheffield and Wood, 2011)
17 2.5.1.2 Impacts of drought
Drought has both primary and secondary impacts. Primary impacts/physical impacts include a decrease in agricultural production, hydroelectric power generation, water for domestic use (FAO, 2004). Secondary impacts affect the growth domestic product (GDP) which might lead to a decrease in industrial output and then cause an increased inflation rate and retrenchments at workplaces (Vogel et al., 1999). Agriculture is the most affected sector by drought. Twenty- two percent of agricultural debt after the 1992 drought was caused by drought impacts (Vogel, 1994). Impacts of droughts are indicated in Table 2.1.
2.5.2 Floods
Floods are defined as an overflow that comes from a river or other body of water and causes or threatens damage (Chapman, 1994; Smith, 2004), in other words, any relatively high streamflow overtopping the natural or artificial banks in any reach of a stream (Smith, 2004).
Floods are regarded as the most common natural disasters in both developed and developing countries (Smith, 1999). Floods are mainly caused by excessive rainfall. Other causes of floods include ice melt, ice jam, landslides, dam failures, storms, and tsunamis (Figure 2.4) (Smith, 2004). Floods can cause damage to life, livelihoods and environment (van Zyl, 2006). From 1980-2010 there have been 77 flood events in South Africa with Eastern Cape, KwaZulu-Natal, North West and Limpopo province being the most vulnerable provinces to flooding (Zuma et al., 2012). The probability of flooding occurring in any given year in South Africa is 83.3 % (Zuma et al., 2012). Floods are part of the earth natural hydrologic cycle and can occur anywhere in the world anytime. Of all types of disasters, floods are the most damaging and demanding of all types of natural disasters (Smith, 2001). Floods can be described according to the water source origin, geography of receiving area, cause and the speed of onset (Smith, 2004). There are different types of floods, namely flash, river, coastal and urban (Figure 2.4).
18 Table 2.1 Primary and secondary impacts of droughts (Source: Vogel et al., 1999)
Primary impacts Secondary impacts
SOCIAL
Disrupted distribution of water resources Migration, resettlement, conflicts between water users Increased quest for water Increased conflicts between water users
Marginal lands become unsustainable Poverty, unemployment
Reduced grazing quality and crop yields Overstocking; reduced quality of living
Employment lay-offs Reduced or no income
Increased food insecurity Malnutrition and famine; civil strife and conflict Increased pollutant concentrations Public health risks
Inequitable drought relief Social unrest, distrust
Increased forest and range fires Increased threat to human and animal life Increased urbanization Social pressure reduced safety
ENVIRONMENTAL
Increased damage to natural habitats Loss of biodiversity
Reduced forest, crop, and rangeland productivity Reduced income and food shortages Reduced water levels Lower accessibility to water
Reduced cloud cover Plant scorching
Increased daytime temperature Increased fire hazard Increased evapotranspiration Crop withering and dying
More dust and sandstorms Increased soil erosion; increased air pollution Decreased soil productivity Desertification and soil degradation (topsoil erosion) Decreased water resources Lack of water for feeding and drinking
Reduced water quality More waterborne diseases
ECONOMIC
Reduced business with retailers Increased prices for farming commodities
Food and energy shortages Drastic price increases; expensive imports/substitutes Loss of crops for food and income Increased expense of buying food, loss of income Reduction of livestock quality Sale of livestock at reduced market price
Water scarcity Increased transport costs
Loss of jobs, income, and property Deepening poverty; increased unemployment Less income from tourism and recreation Increased capital shortfall
Forced financial loans Increased debt; increased credit risk for financial institutions
19 Figure 2.4 The physical causes of floods in relation to other environmental hazards (Source: Smith, 2004)
2.5.2.1 Impacts of flooding
Flooding and its impacts continue to threaten most parts of the developed and developing world, and is viewed as the most frequent and catastrophic disaster that affects human settlements, infrastructures and farming in the flood prone areas (Nelson, 2004). The impacts of flooding vary temporally, spatially, economically, culturally and politically (Johnson, 2003).
Impact severity depends on many factors such as physical setting, uses and socio economic status (Johnson, 2003). However, flooding often has significant, damaging effects on agricultural production. The impacts of flooding can either be classified as direct or indirect (Gommes and Negre, 1992). Directs impacts of flooding are those that affect property, income of individual, enterprises and the public sector e.g., loss of life and crops due to flooding (Gommes and Negre, 1992). Indirect impacts of flooding take long and are more widespread geographically and economically, they result from decreased income, environmental degradation and other factors (Gommes and Negre, 1992). The impacts of flooding differ depending on the time of occurrence. Floods can either occur during the growing season or non-growing period (Johnson, 2003). The impacts of flooding during the growing and non- growing period are shown in Table 2.2.
Physical causes of floods
River floods
Atmospheric hazards
Rainfall Snowmelt Ice jam
Tectonic hazards
Landslides
Technologica l Hazards
Dam Failures
Coastal floods
Atmospheric hazards
Storm surges
Tectonic hazards
Tsunamis
20 Table 2.2 The impacts of floods during the growing and non-growing period (Source:
Johnson, 2003)
Non-growing seasons Growing seasons
Loss of top soil Waterlogging of crops
Loss of soil nutrient Lodging of standing crops
Soil compaction Loss of soil nutrient
Soil erosion Loss of soil pasture use
Deposition of undesirable materials Soil erosion Permanent damage to perennial crops, trees,
livestock, buildings and machinery
Greater susceptibility to diseases and insects Displacement of persons Interruptions to tillage, planting, crop
management and harvesting Breakage of levees and other retention
structures
Permanent damage to perennial crops, trees,livestock, buildings and machinery Anaerobic processes Soil temperature reduction and/or retardation Permanent cessation of farming in
floodplains
Necessity of installation of expensive drainage systems
Permanent diversion /realignment of rivers, streams and other bodies of water and settlements
Loss of livestock and/or habitat Loss of livestock and/or habitat Grain spoilage, in field and off-site
Transportation interruptions
Feedback effect, enhancing precipitation due to large, free-water evaporative surfaces
2.6 Climate change
Africa is regarded as the most vulnerable continent and sensitive to the impacts and risk of climate change and climate variability due to low adaptive capacity (IPCC, 2013). Near-surface temperature in Africa has increased by 0.5 to 2 ºC in the past 100 years (IPCC, 2013).Unlike temperature, precipitation projections are uncertain and exhibit higher spatial and seasonal dependence (Niang et al., 2014). However, it has been projected that southern Africa will experience a decrease in annual precipitation in the mid-21st century (IPCC, 2013). Food production systems in Africa relies on rain-fed crop production, therefore making it the world’s most vulnerable to high intra- and inter-seasonal climate variability, recurrent droughts and
21 floods (Book et al., 2007). Intergovernmental Panel on Climate Change (IPCC), (2013) reported that the impact of climate variability and change is at present being felt.
IPCC (2007) projected that agricultural yield would be reduced by 50 % in 2020 while crop net revenue will decrease by 90 % in 2100. Small-scale farmers are the ones that will be affected the most as they lack adaptation means (IPCC, 2013). In Africa agriculture is the main source of livelihood for those residing in rural areas as it provides 60 % of the employment opportunities in Africa and contributes 30 % towards gross domestic product (GDP) (Nhemachena and Hassan, 2007). A study conducted by Benhin et al. (2010) has shown that a decrease in rainfall and an increase in temperatures will have a negative effect on both subsistence and commercial farmers in South Africa. Subsistence farmers are expected to have 151 % loss of net revenue while commercial farmers will have a loss of 111 % by 2080 resulting in significant net loses. The commercial farmers are more likely to have a loss of R694 billion by 2080 as a result of climate change (Benhin et al., 2010). Crop farmers are the ones vulnerable to climate change compared to mixed farmers and livestock farmers (Benhin et al., 2010).
22 CHAPTER 3: MATERIALS AND METHODS
3.1 Study area
The study was conducted for the Luvuvhu River Catchment (LRC) in the Limpopo Province over the north-eastern part of South Africa. It is located between the latitudes 22°17'33.57" S and 23°17'57.31"S and longitude 29°49'46.16" E and 31°23'32.02" E (Figure 3.1) (Singo et al., 2012). The Luvuvhu River Catchment and Letaba form the Luvuvhu/Letaba water management areas. The Luvuvhu/Letaba water management area is one of the 18 water management areas (WMA) that are recognized by the Department of Water Affairs (Jewitt and Garratt, 2004). The catchment covers an area of 5941 km² and is located on a plateau of about 199 to 1588 m above sea level. The catchment drains into the Limpopo River at the border of Mozambique and Zimbabwe (Singo et al., 2012). Agriculture (vegetables, citrus, and a variety of subtropical fruits such as bananas, avocadoes) is the main pillar of the economy at the catchment (Masupha et al., 2015). There is a large percentage of people practicing subsistence agriculture and residing in informal residential areas as than 50 % of the area of the catchment used for subsistence farming (Jewitt and Garratt, 2006) (Table 3.1). This means that people engage in crop, livestock production and other activities mainly for own consumption.
23 Figure 3.1 Location of the study area
Table 3.1 Land uses at the Luvuvhu River Catchment (Source: Jewitt and Garratt, 2006)
Land use Area (%)
Commercial forestry 4
Subsistence agriculture and grazing 50
Cultivated land (including irrigated lands representing 3%) 13
Protected game reserves areas 30
Urban areas 3
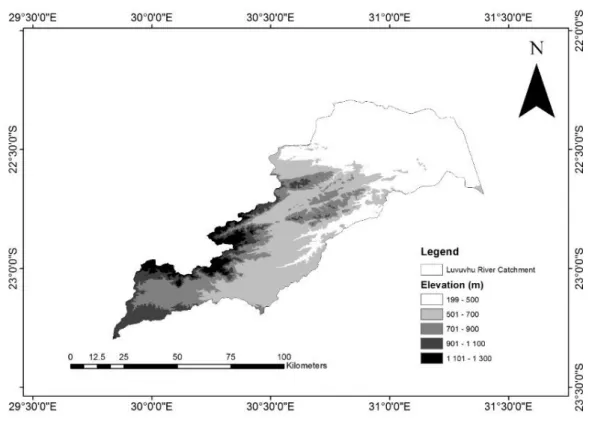
The climate of Luvuvhu River Catchment varies spatially and temporally and is mostly classified as a semi-arid and subtropical catchment (Warburton, 2012). The catchment experiences wet summers from October to April (Singo et al., 2011) and receives peak rainfall in January and February (Dlamini, 2013). Rainfall in the catchment is influenced by topography with high rainfall and low evapotranspiration occurring over the Soutpansberg mountain range and lowest rainfall and high evapotranspiration in the arid areas along the east of the catchment next to Kruger National Park (Jewitt and Garratt, 2004) (Figures 3.2 and 3.3). The catchment receives rainfall of about 450 mm per annum in the low-lying areas (north and eastern part)
24 (Figure 3.3) and 2300 mm at Entambeni in the Soutpansberg mountain (south-western and northwestern part) (Dlamini, 2013). The mean annual precipitation is 608 mm while the mean annual air temperatures are 17 oC in mountainous areas and 24 oC near Kruger National Park (Singo et al., 2011; Warburton, 2012).
3.2 Data acquisition
There are a number of datasets required in assessing the implication of rainy season characteristics on maize production. Data used in the study are explained in the sections that follow.
3.2.1 Daily rainfall and air temperature data
Daily rainfall and air temperature data were obtained from Agricultural Research Council databank. Only stations with data for a period of more than 25 years were chosen. The stations used in the study are shown in Table 3.2 and Figure 3.4. Stations used were spatially distributed across the catchment and were a representative of different climatic conditions within the catchment. Data were arranged using July to June calendar corresponding to the agricultural year.
25 Figure 3.2 Elevation at the Luvuvhu River Catchment
Figure 3.3 Annual rainfall at the Luvuvhu River Catchment
26 Table 3.2 Geographic information of meteorological stations used in the analysis
Station Latitude (o) Longitude (o) Elevation (m) Data period
Elim -23.17 30.05 808 1945-2004
Entabeni -23.00 30.27 1376 1923-2012
Folovhodwe -22.53 30.48 610 1954-2004
Levubu -23.04 30.15 877 1986-2015
Lwamondo -23.04 30.37 650 1978-2015
Mampakuil -23.17 29.00 945 1945-2004
Phafuri -22.42 31.22 201 1970-2004
Phunda Maria -22.68 31.02 462 1945-2004
Sigonde -22.40 30.71 416 1983-2015
Thathe -22.88 30.32 1250 1963-2004
Tshiombo -22.80 30.48 650 1983-2009
Vreemedeling -22.96 30.01 1421 1945-2004
Figure 3.4 Location of meteorological stations within the Luvuvhu River Catchment