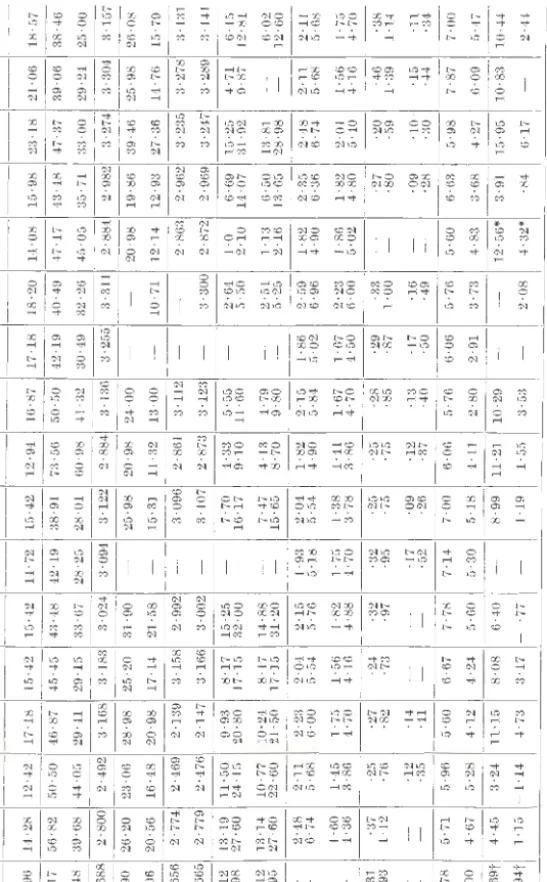
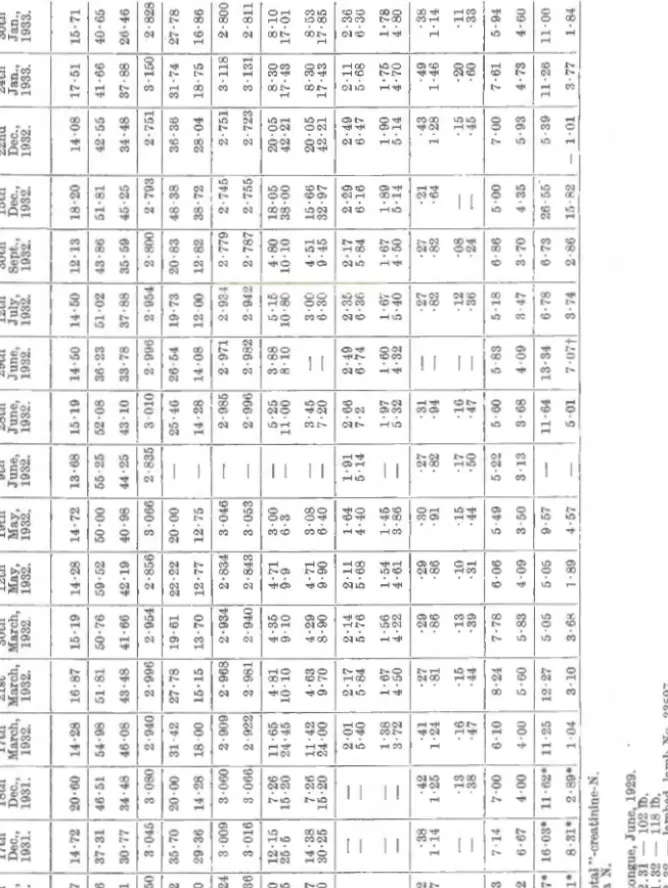
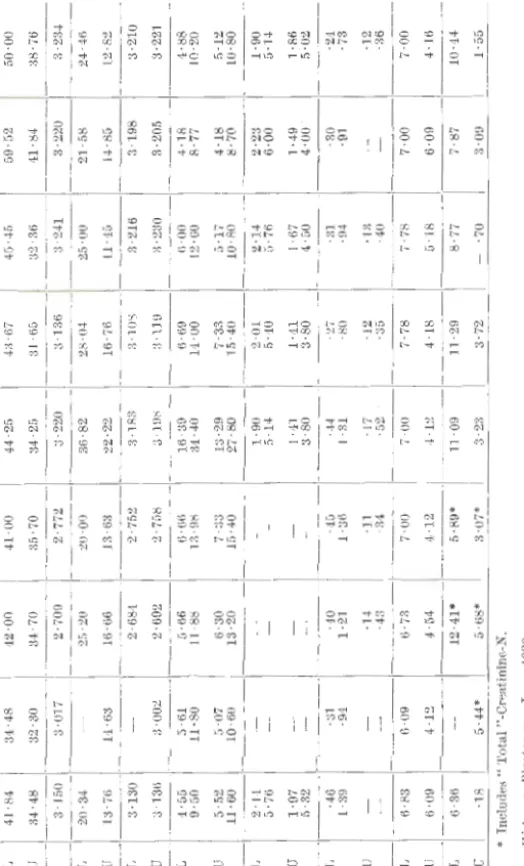
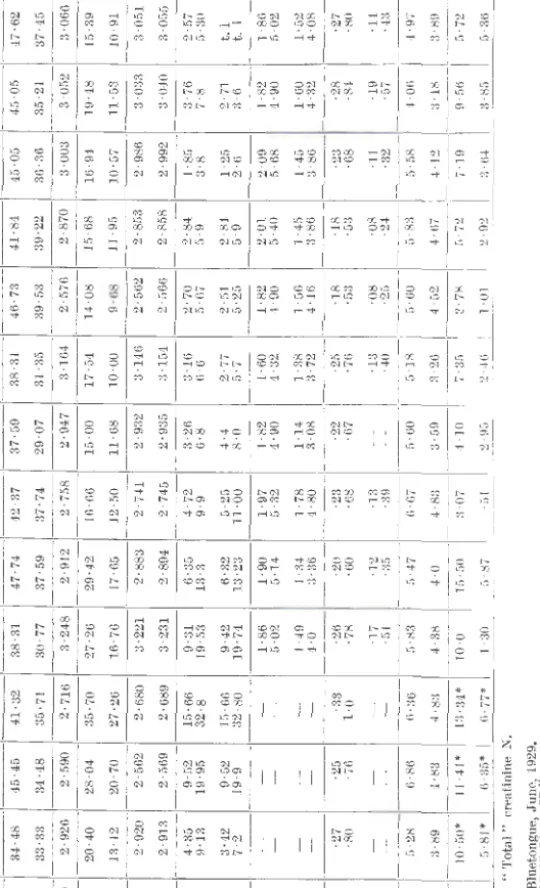
Due to the volatility of most blood components, such figures should be considered with caution. In the case of urea, only a small difference is observed between "lake" and "unbound" blood, and thus strengthens the opinion that the concentration of urea in cells and plasma is about the same. In order to emphasize the percentage variations of the various constituents (except hemoglobin, total nitrogen, and sugar) in both "lake" and "unlake" blood filters throughout the period, nitrogen partition curves are drawn, including monthly averages of all the different experimental data collected from a group as points for plotting the curves (Tables 7 to 17, 21 to 31).
Since the curves of the other groups were found to show the same general trends, they were omitted. By comparing the two signals (graph III), it is clear that the percentage increase gradually decreases towards winter (except from March to February), because the sugar. A table of the 'unvarnished' figures will differ little from Table 12, because the amount of urea in the cellular and plasma fractions of the blood is virtually the same.
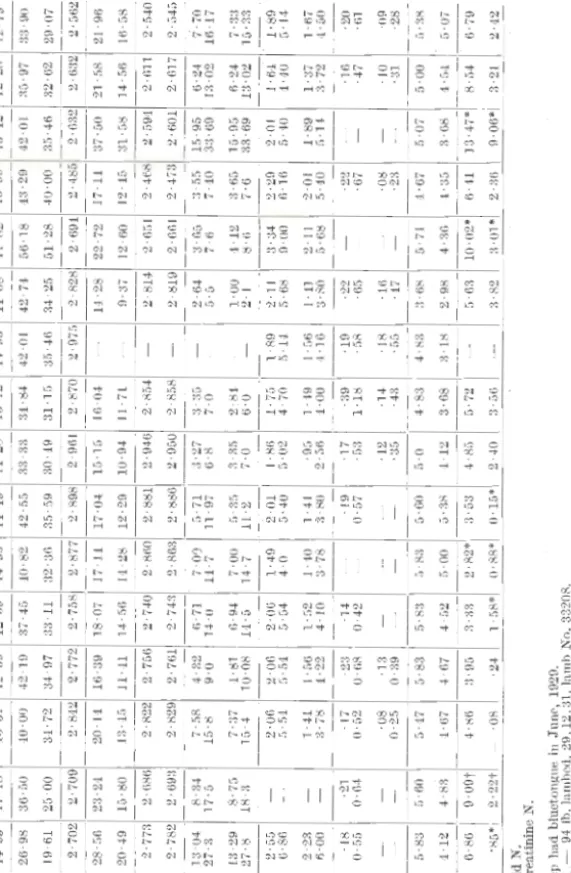
Since the urea nitrogen curves practically coincide, it is evident that the urea nitrogen is approximately equally distributed between the blDDd cells and the plasma. 33208 was 10 weeks old at the start of the analysis and his blood sugar was rising all the time towards June. Note the fall in the percentage curve in December (1932) and the rise in January (1933), which may, if not entirely, be due to the change in rations introduced during this period (Chart II).
The tables from which these graphs (III and IV) are plotted together with the same tables of Groups C, D and E and also of the Hb.
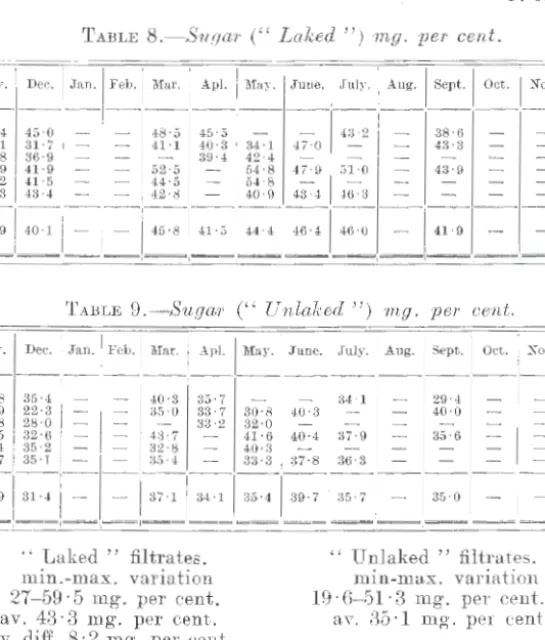
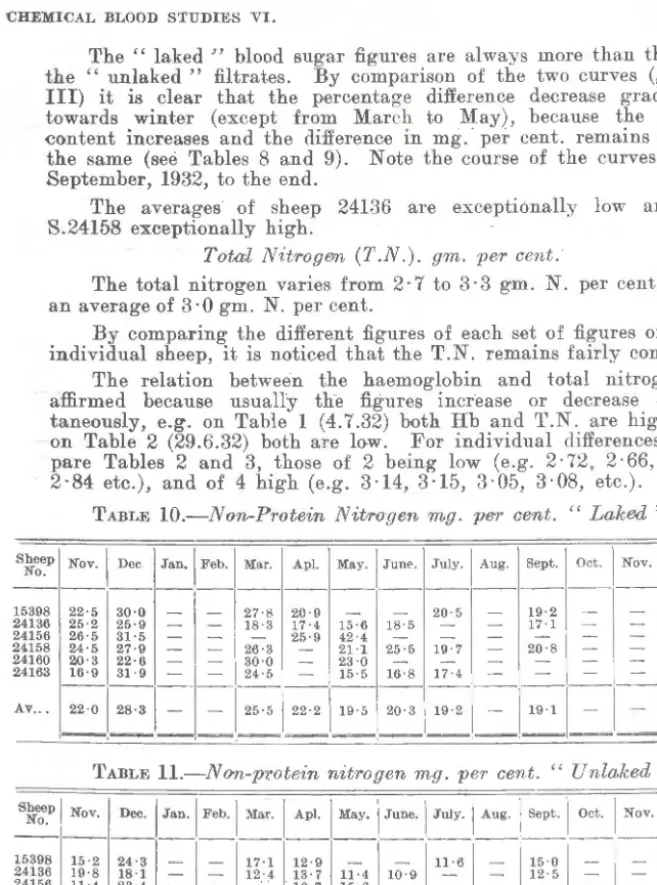
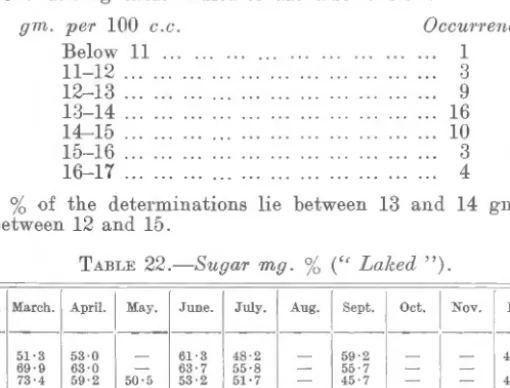
Sugcw·.-Green fodder was excluded from the diet in winter because it was unavailable, and in the sheep of the four older groups (A, 0, D, E), the sheep's blood sugar levels increased. Here, individual differences between sheep of the same sex and age in all different groups have also been noted. This is exactly the opposite of what happens in the case of the amino acids (see Uraph, I and II).
The average of group B is the lowest, but it should be noted that the lambs were not included from the beginning of the experiment. Again, the variations in the last part of the experiment, where the green feed was added and later withdrawn from the ration, must be noted to emphasize the influence of the diet on the composition. Amino acid 1Vit1'0'.qen.-The amino acid levels of the blood change greatly towards winter, the levels in all groups however rising towards December (1932) and with the exception of 0 falling towards January (1933) (see Graph IV).
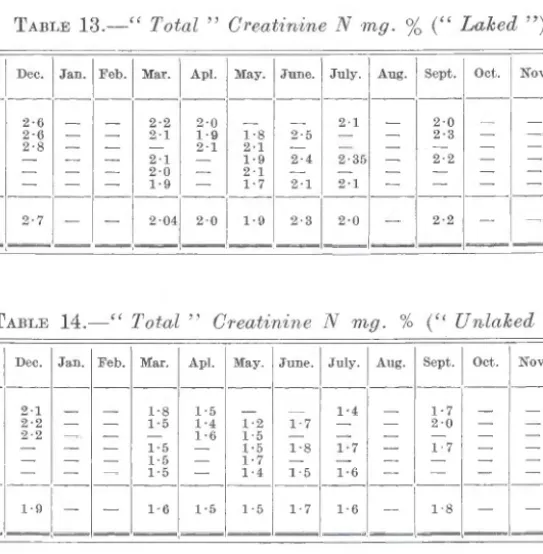
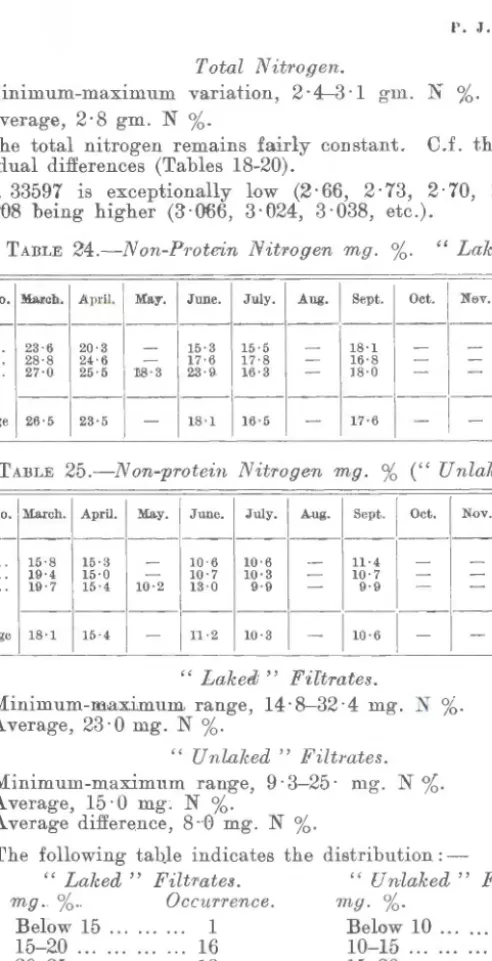
CHEMICAL BLOOD ST"t;JHES VI. 3) The presence of one or more substances in the blood filtrate which can cause a change in the copper complex so that the copper can be more easily recovered by the glucose or other reducing substances present. (Hawk, 1931, s. Lower amounts of non-sugar-reducing substances parallel the lower nitrogen content in the Yarious types of blood filtrates (Somogyi, 1930). Urea Nitrogen. The urea nitrogen is about ::;amen in the two kinds of filtrates.
An important phenomenon noted is that the urea nitrogen percentage of the N .P .N. While the essential metabolic end product of the proteins in the body is urea, one will not bring about such a drop in urea nitrogen, especially since the amino acid (in mg. The percentage curves of the other nitrogen-containing constituents are also inclined to be in the opposite change the direction of the urea nitrogen percentage curves, but the percentage of nitrogen lost in the urea decrease is not corrected by increasing the other nitrogen-containing substances, e.g.
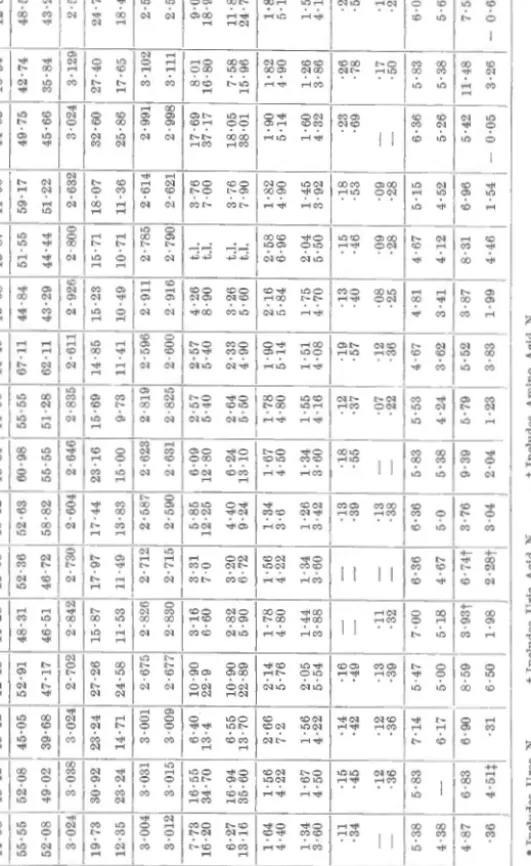
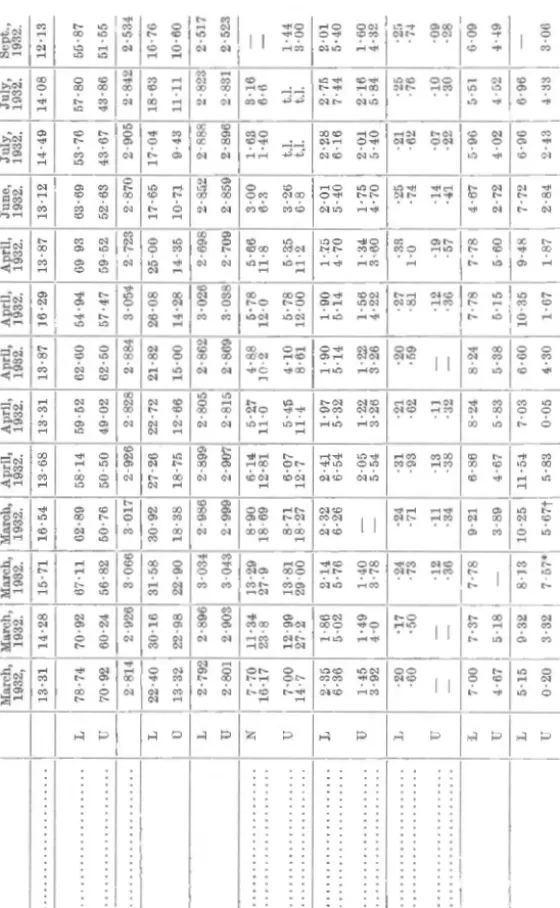
- Acidic nitrogen. - Amino acid nitrogen remains fairly constant in both filtrates, but the values in the "unlacquered" blood filtrate are much lower than in the "lacquered" blood filtrate. Taking into account the history of the development of biochemical methods and the rapid progress in the development of more precise techniques in the last decade, we consider these shortcomings, or rather the lack of more precise ones. For all groups, hemoglobin, total nitrogen, urea nitrogen, "total" creatinine nitrogen, uric acid nitrogen, and amino acid nitrogen were determined in both blood filtrates.
Graphs of two groups (A and B) of the 5 gr A chemical and histological study in Victoria (Australia) of the blood of cattle and sheep.