China’s economic hard landing impact on Africa: A scenario analysis
by Emmanuel Igbinoba Centre for Chinese Studies Stellenbosch University Rodney Hoaeb Namibia Trade Forum
Abstract
Shocks to aggregate commodity demand from China are having significant impact on global commodities and commodity prices. Fears persist that the economic slow- down in China might be steeper and more chaotic than anticipated and reported, as China rebalances its economy thus impacting on growth prospects across world economies. Using a scenario analysis technique, this study evaluates a risk scenario if economic growth in China falls to 4 per cent rather than the projected 6.5 per cent and its associated impact on African economies. The impact of China’s economic slowdown on African economies from an export perspective shows that there is an urgent need for African countries to undertake structural upgrading and diversifica- tion of different sectors of the economy with particular emphasis on agriculture in order to mitigate reduced demand from China.
Introduction
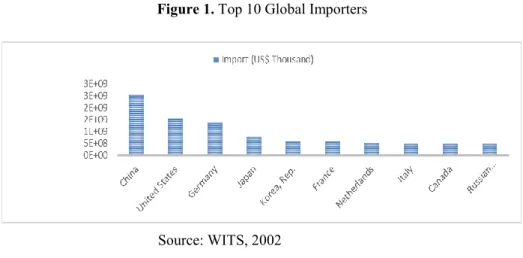
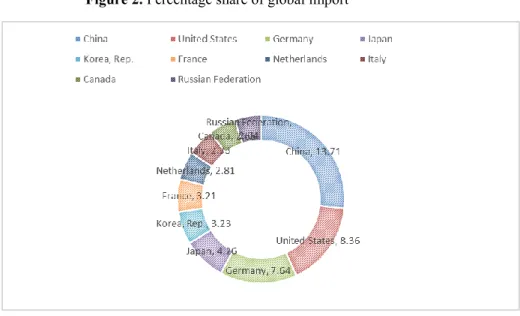
China has within the past two decades emerged as an influential and major player in the global economy. It is the world’s largest exporter of goods, the largest importer of commodities (see Figure 1), the most significant manufacturing economy and the largest trading nation. Clearly, for these reasons, the country plays a primary and significant role in international trade. China is also the second-largest economy by nominal Gross Domestic Product (GDP) and the biggest contributor, in terms of per- centage, to global growth. According to the International Monetary Fund (IMF) World Economic Outlook, published in 2016, 43 per cent of the global GDP growth rate from 2009 to 2015 was comprised of Chinese growth, implying that it accounted for almost half of the global growth (IMF, 2016). China’s investment-driven export growth model and its predominant position as the world’s low-cost manufacturing centre drove import demand for commodities, necessary for industrial growth and also helped support global recovery in the aftermath of the 2007-2009 economic crises. Since 2001, China’s impact on the world commodity market has made it a significant driver of global demand, as its percentage of world’s total import rose from 6.5 per cent to 13.7 per cent in 2014 (see Figure 2).
Figure 1. Top 10 Global Importers
Source: WITS, 2002
Figure 2. Percentage share of global import
Source: WITS, 2016
China’s meteoric three-decade economic growth was largely fuelled by capital investment (46 per cent of GDP was composed of gross fixed capital formation), low wages and rapid productivity growth, factors considered unsustainable for long-term sustainable growth. Since 2011, China’s economic growth rate has steadily decelerated from 10.6 per cent in 2010 to 6.9 per cent in 2015, its lowest growth rate in 25 years. This is the first time that the Chinese economy has had such a lengthened period of slowdown since it instituted market and economic reforms in 1979 (Lin, 2016).
Certain factors are responsible for the deceleration in China’s economic growth.
Firstly, growth at double-digit level is unsustainable when a country attains a certain level of GDP and a certain level of GDP per capita.1 Singapore, Hong Kong, Taiwan and South Korea all experienced deceleration and single-digit growth of 6 to 6.3 per
cent when their GDP per capita reached US$ 7,000 (Lin, 2016). Thus, China with a GDP of about US$ 10 trillion and a GDP per capita of almost US$ 7,000 is expected to experience a similar process of deceleration in its quest to transit to a developed economy. But in order to enable the sustainability of its growth, investments in innovation, research and development (R&D) is required. Moreover, weak recovery in global growth in the aftermath of the 2007-2009 global recession and instability in the economic and financial economy, negatively contributed to a slowdown in international trade growth as global export growth rate fell to 6.1 per cent in 2014 and to -1.8 per cent in 2015 (Lin, 2016). Most economies however, suffered sharper falls in growth relative to China.2 GDP growth in other emerging economies like Brazil and Russia fell from 7.5 and 4.5 per cent in 2010 to 0.14 and 0.6 per cent in 2014 respectively, and growth in developed economies like South Korea and Singapore fell from 6.1 and 15.2 per cent to 3.3 and 2.9 per cent within the same period (Lin, 2016). The global demand for Chinese goods has been so weak that policy-makers expects little contribution from exports in 2016, hence deciding that domestic demand will be the driver of future growth (Lin, 2016).
Structural changes in the labour market is the another factor responsible for the economic deceleration. Low wages was the fulcrum of China’s economic success which allowed China to undercut (offer goods and services at a lower price than its competitors) firms in developed economies. China’s aging population has, however, brought challenges to the Chinese labour market and exemplifies the notion that limits exist to the rate in which labour can contribute to the economy. China's population is getting older at a rapid pace and a government think tank report forecasted 25.9 per cent of the total population will be aged 65 or above in the year 2050 (East Asia Forum, 2013). China's one-child policy which initially created an economic boost is contributing to the falling birth rate, creating a lopsided demography, and a shrinking workforce with the labour market projected to decline by 30 per cent in 2050. The consequence is an increase in average wage cost with the minimum wage rising by 10.37 per cent in 2013 and 11 per cent in 2014. This is rendering Chinese firms to be less competitive in low value, labour-intensive
industries such as the textile, toys and plastic industry and requiring a shift towards an innovation-led economy (Economist, 2012).
The other significant cause of growth deceleration is Beijing's attempt to rein in on China’s excessive debt-fuelled investments, which was becoming unsustainable.
China is observed to spend more on economic infrastructure annually than North America and Western Europe combined. Chinese investment ratio as a percentage of its GDP stood at over 48 per cent in 2014 (Economist, 2014), as initially, higher investment rates was required by China in its attempt to bridge infrastructural gaps, needed to spur economic growth. With China's rapid rate of economic growth triggering one of the greatest rural to urban migrations in history, the promise of better wages and higher standards of living lured rural workers into the cities. In 2012, it was estimated that since 1980, over 145 million people had migrated from the country side to China's cities in search of a better life. This in turn led to an increased demand for housing and urban infrastructure, triggering a construction boom of tremendous proportions that saw China's construction sector account for around half of the global demand for industrial metals and become the largest importer of crude oil (IMFdirect, 2015). Recent investment and stimulus programmes such as easing credit restrictions, expanding social welfare and infrastructural spending programmes undertaken in the wake of the 2008 recession have been less productive due to the infrastructural gap been filled. Chinese economic and financial analysts contend that if China were to continue investing at a globally unprecedented rate of 48 per cent of national income - greater than even Japan at its 1980s peak-and accumulating debts at an annual rate of more than 15 per cent of GDP, China is at serious risk of a calamitous Japanese crash á la 1990. An IMF 2015 report estimated that China may have been overinvesting in recent years by around 15 per cent of its GDP, with the cost falling directly on the shoulders of households. China’s excessive investment now tends to channel scarce resources to commercially unviable sectors and away from household consumers leading to waste and creating asset bubbles. The Chinese government is now attempting to regulate investments so as to avoid slumps in key sectors of the economy.
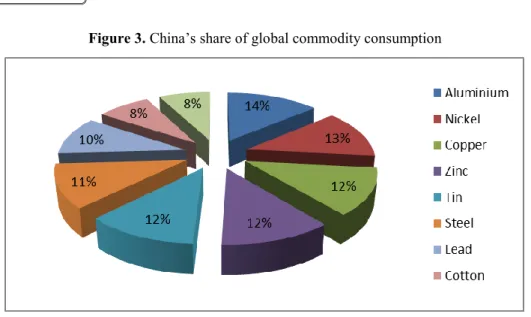
Figure 3. China’s share of global commodity consumption
Source: UNCTAD, 2016
To economists, China’s structural deceleration is inevitable. It signals the change in China’s growth model caused by narrowing the technological gap with developed economies thus necessitating a shift into the service sector. With China accounting for approximately 17 per cent of global economic activities (BBC, 2015) (see Figure 3), a percentage fall in Chinese growth will results in a 0.5 percentage fall in global growth (Independent, 2015). This can lead to a significant multiplier effect on the global economy by disrupting global trade and hindering growth, especially in emerging and developing economies. China’s “new normal” consumer-driven economic model looks inwards for growth, placing strong emphasis on promoting consumer demand, addressing income disparity and boosting energy efficiency.
While China’s economic rebalancing remains on course despite internal and external structural constraints, its 2015 growth rate of 6.8 per cent was observed to be primarily driven by its service sector, which exceeded the primary and secondary sector, growing at 11.7 per cent in 2015 and contributing 50.5 per cent of total GDP (See Figure 4).
Figure 4. China GDP composition by sector
Source: Statistica, 2016
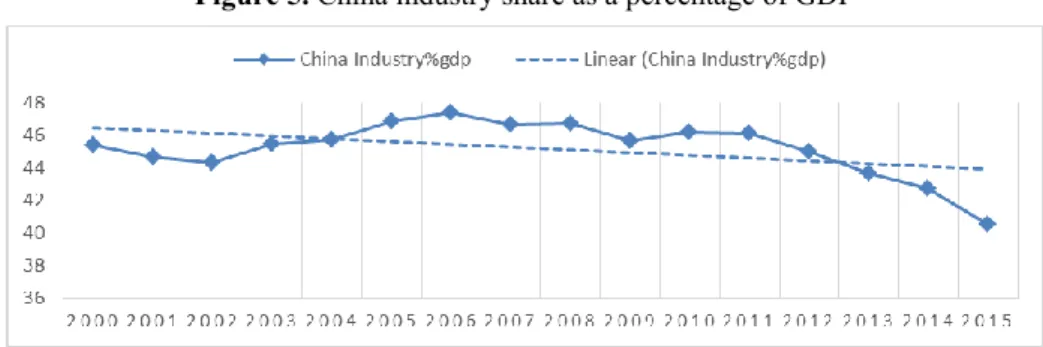
China’s recent growth has been powered by stronger domestic consumption and this has helped it compensate for the fall in net export. The deceleration is set to continue as its economy transits, and will be stabilised by stronger service and consumer growth. China’s deceleration is preceded by the economy becoming less import- intensive and the tertiary industry structurally exceeding the industrial sector as its competitiveness improves and it moves up the global value chain (see Figure 5).
While its deceleration is concentrated more in the industrial sector, its service sector has shown increased growth, but since its service sector is relatively closed and has less dependence on imports, growth in the service sector is unlikely to negate the adverse impact on global commodity trade.
Figure 5. China industry share as a percentage of GDP
Source: World Bank, 2016
Relative to the background literature, a vital question centres on the degree of adjust- ment of the Chinese economy towards a more sustainable growth path, as well as China’s rebalancing to a consumer-driven economy, and the impact on commodity trade. The impending crash of the Chinese economy has recently been a common discourse in the global media. The rationale for such prognosis is centred on the per- sistent slowdown in China’s growth since 2011. Reasons ascribed for the decelera- tion include internal structural defects such as China’s unsustainable investment rate, corruption and inefficient state-owned enterprises, aging and changes in the labour market as well as its turbulent stock market. Since these structural defects are diffi- cult to resolve, optimism for China’s growth is slim.
As China is a significant participant in the global commodity market, a strong corre- lation exists between China’s economic growth and a rise in commodity prices trig- gered by the commodity boom. Within the last two decades, as China’s growth ac- celerated, there has been a sharp rise in prices of commodities and since China’s subsequent deceleration in 2011, there has been a 70 per cent fall in energy prices, a 50 per cent fall in metal prices and a 35 per cent fall in agricultural commodity prices (World Bank Commodity Outlook, 2015). China’s deceleration is a cause for serious concern, especially among commodity trade partners to China though non- commodity exporters or economies with little direct trade relations with China might also feel the impact of China’s hard-landing if they are suppliers to countries that sell directly to China, or if they export commodities whose prices in international mar- kets are affected by weakened demand from China. The impact of this transition will vary as exporters of commodities tend to be more affected than exporters of manu- factured goods (IMF, 2016), and as resource-rich developing countries derive their income mostly from commodity export, they tend to be more exposed to China’s economic policies.
Against this background, this study renders two contributions to substantive litera- ture on global commodity trade. First, it applies a scenario analysis technique to a wide range of commodities, and secondly, it isolates the impact of global commodity demand and price to China as Yu (2011) ascribed growth in global demand to Chi- na’s industrialisation and urbanisation process. Our objective is to augment and en-
hance our understanding of China’s impact on commodity markets and its associated effect on African economies. Having an understanding of the degree of Chinese im- pact on commodity trade is important for certain reasons. First, it will enable com- modity producers to better assess the degree of risk on commodity prices, based on their evaluation of economic prospects in China. Secondly, it can also improve poli- cy-makers understanding of drivers of commodity price change. This paper is ex- ploratory in nature; its scope and the depth of its analysis are constrained by the availability of data. To achieve our objective, the paper is structured as follows: Af- ter the introduction, the next paragraph provides an overview of China-Africa com- modity relations and the third paragraph specifies the methodology and analysis un- dertaken. The final paragraphs present the conclusion and recommendations.
China-Africa commodity relations
In a study of 135 countries, United Nations (UN) economists found that two out of three developing countries are commodity-dependent, and that half of them are Afri- can nations (UN, 2015). Energy fuels (coal, petroleum and gas) accounts for more than 90 per cent of the export earnings for Nigeria, Algeria, Libya, and Equatorial Guinea. Various metals and ores make up 80 per cent of Botswana (diamonds, cop- per, nickel, gold), the Republic of Congo (petroleum), the Democratic Republic of Congo (DRC) (diamonds, cobalt, copper), Gabon (petroleum, manganese), Guinea (bauxite, aluminium, gold, diamonds), Sierra Leone (diamonds) and Sudan’s (petroleum, gold) export. Minerals and mineral fuels account further for more than 50 per cent of export earnings of Mali (gold), Mauritania(iron ore), Mozambique (aluminium), Namibia (diamonds, uranium, gold, zinc) and Zambia (copper, cobalt).
Agricultural commodities form 70 per cent of Benin’s exports; cotton embodies 50 per cent for Burkina Faso’s exports; coffee, sugar and tea make up 60 per cent of Burundi’s exports; peanuts, fish and cotton comprises 70 per cent of Gambia’s ex- ports; cashews, shrimps, peanuts and oil palm constitute 80 per cent of Guinea Bis- sau; tobacco makes up more than 53 per cent of Malawi’s exports; while cocoa con- stitutes 80 per cent of Sao Tome and Principe’s exports (UN Comtrade, 2014). Chi- na’s trade relations with Africa are important to both trading partners as Africa serves as an important source of raw materials for China - helping power China’s
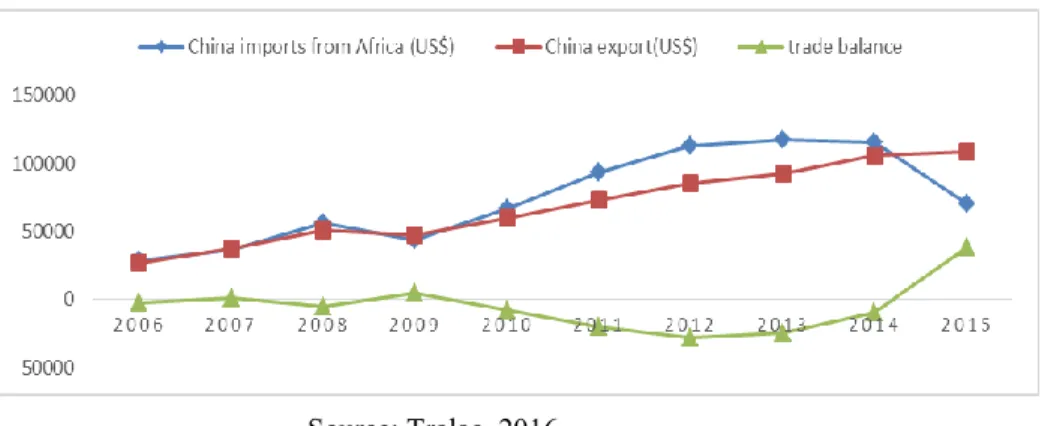
rapid economic growth, while China serves as an important investor for Africa that makes available cheap consumer goods, buys its natural resources, as well as pro- vides developmental aid and infrastructural loans. Though Africa constitutes just five per cent of China’s global trade, bi-lateral trade between both partners grew at a 30 per cent compounded annual growth rate from US$ 10.8 billion in 2001 to US$ 200 billion in 2015 (see Figure 6). Through a rise in commodity prices fuelled by strong commodity demands from emerging economies especially China, Sub-Saharan econ- omies have grown at an average of five per cent over the past decade helping im- prove living standards and strengthening human development indicators across the continent. Two-way trade between both partners constitute a quarter of Africa’s total trade, and a third of China’s total energy imports are sourced from Africa. In 2009, China became Africa’s largest trade partner as economies in Africa rode on China’s growth wave, although benefits accrued were differentiated by their trade position, their degree of comparative advantage and their level of export exposure to China.
While two-way trade has experienced an upward trajectory, its trade composition replicates traditional north-south pattern where Sub Saharan Africa largely exports raw materials and import manufactured products. More than 80 per cent of China’s imports from Africa are composed of mineral resources, while agricultural commod- ities imports have remained low.
For economists and researchers engaged in issues relating to African economic growth and development, a persistent question being discussed, is the impact of Chi- na’s slowdown on Africa’s economies (see Taylor, 2014; Drummond and Liu, 2013;
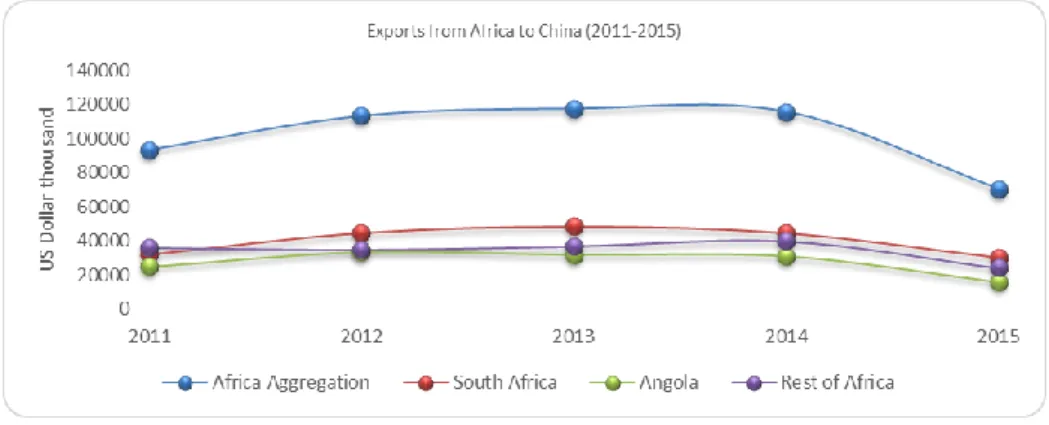
Baliamoune-Lutz, 2011 amongst others). While China needed natural resources and agricultural resources to enhance its growth, Africa as a resource-rich continent helped supply its commodity needs, and bi-lateral trade relations has enabled African economies experience higher growth rates, favourable trade terms, higher export volume and higher commodity income (Zafar, 2007). China’s economic transition has led to a slowdown in global economic growth as investments and importation of commodities has declined. Africa’s exports to China fell by two per cent in 2014 and 39.1 per cent in 2015, after having enjoyed positive export growth in the preceding years. Its 39.1 per cent fall in export to China was sharper than imports from the rest
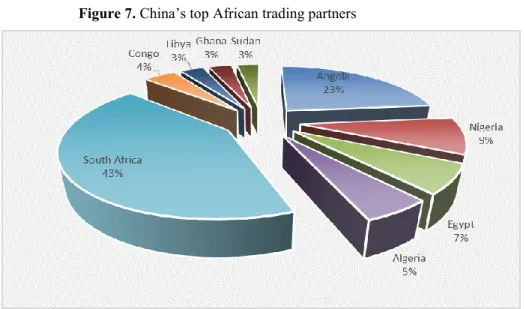
of the world to China which fell 14 per cent. This shows that Africa is impacted more, relative to other continents in its trade relations with China. Among its trade partners (see Figure 7), those with larger trade ratios experienced a significant drop in export volume to China (see Figure 8). Mozambique, a major exporter of alumini- um suffered a 73 per cent drop in its exports to China. Angola, another oil producer, saw exports drop 49 per cent, while South Africa and Egypt lost 32 and 21 per cent respectively in export volume. However, some economies saw a rise in their export volume to China such as Gambia, a major exporter of groundnuts which experienced a 47 per cent rise in its export, also Mauritius, Kenya, Togo and Morocco saw growth in their export volumes. Cumulatively, some commodities experienced drops in export volumes such as Africa’s crude oil export to China which fell by five per cent in 2013 and a further 48 per cent in 2015, also iron ore import to China from Africa dropped by two per cent in 2013 and further by 51 per cent in 2015. Some commodities saw gains in export volumes such as livestock which rose by 43.68 per cent from 2012 to 2013 and rose by 22 per cent in 2015, frozen fruits rose by 40 per cent in 2015 and sawn wood by 7.7 per cent in 2015. Reasons for these gains include stable global demand as well as the price elastic nature of such commodities, which are necessities.
Figure 6. China Africa trade relations
Source: Tralac, 2016
Figure 7. China’s top African trading partners
Source: Tralac, 2016
Figure 8. Africa’s commodity exports to China (2011-2015)
Source: Trade map, 2016
Hard or soft landing?
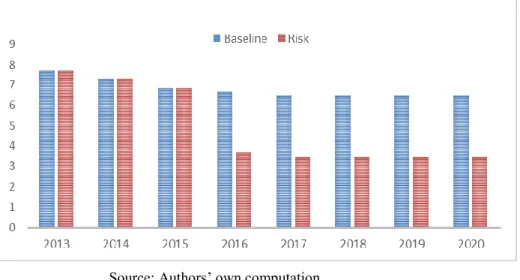
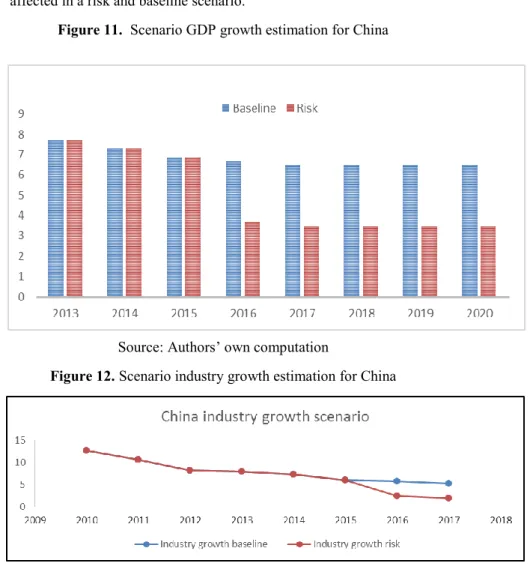
Strong volatility in commodity demand and price motivated our analysis of the pos- sible effect on Africa of a risk scenario in which China would grow below the base- line scenario, assumed to be 6.5 per cent till 2020. Our study addresses this scenario by evaluating the possible transmission channels of a sharper slowdown in China on African economies. Despite Beijing’s assertion that growth will continue at an annu- al rate of 6.5 per cent, it is imperative to explore the impact of a sharper, steeper slowdown in Chinese growth, which will lead us to significantly lower growth lev- els. The basis for such a hard-landing low growth scenario can be viewed from a position of meagre progress in structural transformation, as it transits from an invest- ment-driven to a service-based economy. From this perspective, if doubts exist over the characteristic of investment opportunities, industrial upgrading, as well as accu- mulated public debts, this will create opportunities for structural problems such as inefficient state ownership and huge debt leverage which has the potential to stifle growth in the next few years. While Chinese authorities will certainly intensify ac- tions to stimulate consumer demand, it might still be unable to compensate for an already contracted and dwindled private sector. Therefore, despite fiscal and mone- tary stimulus policies to stimulate growth, the economy will be running below its capacity. Concurrently, stimulus packages will impact forcefully on the yuan making it depreciate in value, thus helping stoke inflationary tendencies. This will create a scenario of persistent stagnation with growth rates outlook heading to less than four or four per cent rather than the projected 6.5 per cent and industrial production grow- ing below four per cent rather than the anticipated baseline scenario of seven per cent. It is imperative to understand that this scenario has a small, but ascertainable probability of occurring, especially given that current baseline economic forecasts for China already takes into consideration a soft landing deceleration in growth.
Even without taking our risk scenario into deliberation, the baseline scenario will still have significant effect on economies with close trade relations to China, African countries inclusive. Applying a scenario analysis approach, this study seeks to evalu- ate China’s deceleration impact on commodity markets and how it can impact on African countries.
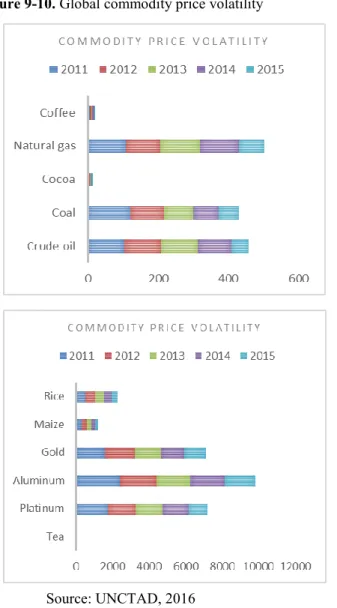
Figure 9-10. Global commodity price volatility
Source: UNCTAD, 2016
Methodology and analysis
To analyse China’s hard landing impact on the African economy, we apply a scenar- io analysis technique (see von Reibnitz, 1988; Wack, 1985).3 This approach is often employed to estimate changes to a portfolio's value in response to an unfavourable event, and may be used to examine a theoretical worst-case scenario analysis. Based on mathematical and statistical principles, scenario analysis provides a process to estimate shifts in the value of a commodity, based on the occurrence of different situations, referred to as scenarios, following the principles of “what if” analysis.
These assessments can be used to examine the amount of risk present within a given economic cycle as related to a variety of potential events, ranging from highly proba- ble to highly improbable. Depending on the results of the analysis, it can be deter- mined if the level of risk present falls within a threshold comfort zone. This study applies economic growth data from the Global Economic prospect, retrieved from the World Bank and analyses two scenarios (a baseline and a risk “adverse” scenar- io) for the next 5 years, assuming a static balance. This allows for comparability in commodity demand as the risk scenario would assume Chinese economic growth of four per cent till 2021, and the baseline scenario would assume growth of 6.5 per cent till 2021. Assessing our channels, we will assess the impact of our risk scenario on African economies, based on the notion that China is Africa’s largest trading part- ner and commodity importer (UNCTAD, 2016). It will also be based on the fact that Africa dependence on China is not restricted to commodity export alone, but also on China’s influence on Africa’s commodity prices. Thus, trade dependence will be significant, based on their weight and percentage export to China as this plays a sig- nificant role in determining their revenues. Also the impact of the prices of the com- modities will to a greater extent depend on the demand for each type of commodity, which is based on investment in China. (Figures 11 to 18 show the price elasticity of the commodities relative to a drop in demand from China, as well as the impact based on our baseline forecast scenario). The results would enable us to evaluate African economies’ ability to weather Chinese commodity shocks as well as identify areas for improvement to mitigate the potential impact of the shock. This study ap-
proach improves fiscal discipline as it shows how current account balance would be affected in a risk and baseline scenario.
Figure 11. Scenario GDP growth estimation for China
Source: Authors’ own computation
Figure 12. Scenario industry growth estimation for China
Source: Authors’ own computation
Figure 13. Agricultural commodity scenario analysis
Source: Authors’ own computation
Figure 14. Agricultural commodity scenario analysis
Source: Authors’ own computation
Figure 15. Agricultural commodity scenario analysis
Source: Authors’ own computation Figure 16. Minerals commodity scenario analysis
Source: Authors’ own computation
Figure 17. Minerals commodity scenario analysis
Source: Authors’ own computation Figure 18. Minerals commodity scenario analysis
Source: Authors’ own computation Findings
The conventional belief is that as long as China’s economy grows on average at 6.5 per cent or more annually, it will need to continue its reliance on Africa for resource commodities - the bulk of the US$ 200 billion trade. Correspondingly, this will ena- ble Africa’s economy to continue its annual average growth of 4.5 per cent. Thus,
Africa broadly cannot blossom without China and as countries like South Africa, Namibia and Chad increase demographically in size, a thriving trade with China will enable the possibility of reaping economic dividends for Africa. Shocks in Chinese growth are expected to hit African economies hard especially via lower demand in commodities and drops in commodity prices.
From the analysis, there exists a strong negative impact of the risk scenario on the prices of metals and ores due to a drop in industrial demand. Also, prices of energy commodities were observed to plunge, especially oil at a steeper rate than ores and metals. This may be due to China’s attempt to use green energy technology as it tries to curb its environmental issues as well as excess supply relative to demand by oil exporters. However, food commodities were noted to suffer fewer shocks. Generally, prices of agricultural commodities are observed to be less sensitive to cyclical condi- tions than minerals (see Figures 9 and 10), as their demand are more predictable (McFarlane, 2014; Roberts and Schlenker, 2009). A reason for this might be because prices of agricultural commodities tend to be determined by productivity gains and weather-related supply shocks. Another reason might be their close linkages with consumption. As agricultural commodities are known to be less volatile in world markets, China’s deceleration has had less noticeable impact on price trends of agri- cultural commodities. Thus, agricultural commodity exporters will be less affected by China’s hard landing. For mineral commodities, in the short run, exporters will be hit hard, but in the medium term, prices are expected to rise, due to increased de- mand from other emerging economies.
Our risk scenario of China’s transition and deceleration will have significant and substantial impact on Africa, which will be ameliorated by certain countries, which are observed to be more diversified and less mineral dependent. An economic hard landing in China will indicate a danger to African economic growth as non- agricultural commodity exporting countries are observed to be more vulnerable (see Figure 19). Faced with this kind of scenario, commodity exporting countries need to adopt counter-cyclical economic policies to avoid recession and stagnant growth.
Our simulation exercise shows that economies like Kenya and Ethiopia can absorb shocks from China relatively better (see Figure 20) due to diversity in their commod-
ity export baskets and countries like Namibia and Lesotho due to lower trade links.
This underscores the importance of counter cyclical policies to soften the impact of China’s slowdown.
Figure 19. Commodity scenario analysis on selected African economies
Source: Authors’ own computation
Figure 20. Commodity scenario analysis on selected African economies
Source: Authors’ own computation
Agricultural commodity export to China is very low representing just five per cent of Africa’s total exports to China, despite a rise in trade relations. Africa is not fully exploiting its comparative advantage in agriculture to expand its export share in the Chinese and global markets despite agricultural commodities being observed to be less volatile, relative to minerals and irrespective of the scenario approach applied.
Its agricultural potential is massive relative to its current output. With more than a quarter of global arable land residing in Africa, it lags behind other continents, pro- ducing less than ten per cent of the world’s output (FAO, 2015). The Balassa index on global competitiveness has consistently stated that Africa has been losing global competiveness in all sectors, especially its agricultural export competitiveness which has fallen over the years (World Economic Forum, 2016). Factors declared responsi- ble include structural deficiencies; real exchange rate depreciation; lack of capital investment and logistical constraints as well as high agricultural product import tariff which tends to hinder export. Also African economies like most commodity produc- ers are often participants in commodity markets in which they exercise little or no control on commodity prices and quantity. These are controlled by elaborate finan- cial market systems and western firms. This makes them susceptible to commodity super cycles of booms, bubbles and busts with the associated painful adjustment pro- cess from depressed prices. China’s position in commodity trade is significant in the manner it impacts on the demand and supply of commodities globally, for instance, its policy of self-reliance and sustainability in grain production and reliance on oil seed importation impacts globally on agricultural commodity patterns, as certain commodities tend to be more volatile in prices and demand. However, China tends to have a more assertive position in mineral commodities relative to agricultural com- modities due to its position as the largest importer of mineral commodities, though its percentage of agricultural commodity imports are observed to be increasingly gradually. Agricultural commodity exporters will have small direct exposure relative to mineral commodity exporters if it slows to four per cent, though the economic impact on Africa will be larger and broader even on diversified economies through currency depreciation, fiscal balance deterioration and trade balance deterioration.
Conclusion
Most African countries will be directly impacted by China’s hard landing as China accounts for approximately a third of Africa’s commodity exports. This is exclusive of other linkages such as capital flows, trade flows, aids, loans and exchange rate among others. The effect of China’s deceleration on non-commodity exporting coun- tries and countries with less economic exposure to China will be marginal, though lower commodity prices might indirectly impact on their public finances due to Chi- na’s influence on global commodity prices. Other channels for non-commodity countries include the spreading of a currency war. If China depreciates its yuan in its attempt to drive exports and more importantly, weaken confidence, which has a huge impact on the global economy, as observed in 2008 where weakened confidence brought down companies, banks, markets and financial systems in non-commodity economies and countries. African commodity exporters to China in the short run will be exposed to withering recession or stagnation as recently experienced by Nigeria or might have to borrow to narrow their current account deficit. African economies, such as Ghana, Rwanda, Burkina Faso and Ethiopia that initiated early actions such as the Comprehensive African Agricultural Development Plan (CAADP) and the regional agricultural development and food security initiatives within the last decade to invest in agriculture will experience higher and more stable economic growth with a decline in their malnutrition and poverty rates. With agriculture as the surest path to sustainable economic growth due to its tendency to have multiplier impacts on other sectors of the economy and with agricultural growth a more effective tool at reducing poverty relative to other sectors in Africa due to the higher percentage (approximating 60 per cent of labour force) engaged in agriculture, African policy- makers need to allocate a greater percentage of their national budget to agriculture transformation initiatives such as improved seed and availability of fertilizer; easy access to finance; irrigation; undertake land reforms as well as combat climate- related phenomena such as drought and flooding. Africa’s progress will require the implementation of correct policies, technology transfer and most importantly, politi- cal will power to enable it to achieve results similar to the Asian green revolution of the mid-1990s. The result of the simulation exercise shows that certain countries
such as Ethiopia, Kenya, Djibouti, Liberia, Namibia and Rwanda can withstand shocks associated with China’s hard landing better, as well as Burkina Faso, Mauri- tius, Swaziland and Lesotho. The former due to lower commodity trade links with China, and the latter, by having fiscal space to absorb commodity shocks through a more diversified economy. While little doubt exists that China’s slowdown matters, especially in the short run, a hard landing will have profound impact on African economies as it will have significant effects on commodity exporters and non- commodity exporters will not be immune.
Figure 21. World Bank global growth outlook
Source: WITS, 2016
However, China’s transitory economic outlook does not spell disaster for commodity exporters in the medium to long-term based on the World Bank’s growth forecast (see Figure 21). On the contrary, even if, as many fear, China’s economic growth slows further; its impact on commodity prices will be limited due to projected de- mand from other emerging economies. Bolstering prospects for commodity prices further are indications that demand from other emerging giants, such as India, Mexi- co, Turkey, Vietnam and Indonesia will accelerate in the coming years. The rest of developing Asia’s economy is currently about four per cent larger than China’s, and twice as large as China’s economy was in 2000, when growth in commodity demand
began to accelerate. If solid growth in Asia’s other emerging economies continues over the next decade and a half, it will generate commodity demand at least as large as China’s in the boom years. This implies that if China’s economy decelerates, in the short run commodity demand will fall but as it moves more into service, its de- mand for resources will be less, making other countries like India, Turkey, Mexico increase demand. In the long run, commodity prices will recover but remain stable, not rising as sharply as in 2010-2014 levels due to less demand from China.
Recommendation
If “what happens in China does not stay in China” is a qualitative sense, then Chi- nese growth matters. But quantitatively, how great would the fallout be from a se- vere China slowdown? As growth deceleration in China go hand-in-hand with the fall in commodity prices, changes in China’s economic structure present challenges and opportunities for African economies. If China’s growth falls to four per cent or less in the short run, mineral commodity producers will be severely affected, relative to agricultural commodity producers. Some African economies will fall into reces- sion, as fewer countries can cushion the flow of reduced demand. Most economies will struggle to initiate effective monetary policy response and this might lead to huge capital outflows, currency depreciation and inflationary pressures. Drops in commodity prices will lead to a fall in development prospects, due to costly capital needed to finance development projects. However, a fall in commodity price can aid and contribute to the structural rebalancing within Africa, as commodity exporters will be forced to engage in agriculture, the base for structural transformation. Agri- cultural commodities are observed to be less volatile relative to mineral commodities and have stronger linkages to other sectors of the economy. Structural changes should target technological innovation and industrial upgrading to raise labour productivity with policy-makers undertaking a facilitating role. The most effective long-term strategy for export-dependent economies is to adopt export diversification policies. Structural reforms should be undertaken to encourage export diversification and upgrading. Diversification processes should be vertical (expanding production into upstream and downstream sectors of the value chain) and horizontal (developing and expanding of new products). This will reduce concentration and reliance on a
few export commodities and reduce their vulnerability to exogenous shocks. In the short to medium run, contractionary revenue management is the most feasible ap- proach to stabilizing income from commodity sale. African policy-makers in com- modity exporting countries will need to ensure the current commodity income earned is either largely saved—such as in the case of Chile or Norway—or like Botswana, used in ways that supports future growth in non-commodity sectors, for example, through investment in education, health, and infrastructure. Fiscal transparency should help to ensure that effective development initiatives are made from any addi- tional revenues. Governments, however, must anticipate future decline in commodity prices and ensure that spending does not increase above sustainable levels in hard-to- reverse areas such as public sector wages. Also, governments of both exporting and importing commodity countries should approach the volatility in commodity prices from a “risk management” perspective and incorporate market information about prices and volatility into their fiscal planning and budgetary process. More broadly, governments in commodity-exporting countries should continue to aim at diversify- ing their economies to help reduce vulnerabilities to commodity price shocks.
Endnotes
1. Per capita GDP is a measure of the total output of a country that takes GDP and divides it by the number of people in the country
2. “Hard landing” is a scenario in which an economy has a sharp decline after years of significant growth. In contrast, “soft landing” is a steady decline in growth rate.
3. Scenario analysis is the process of estimating the expected value of a portfolio or commodity after a given period of time, assuming specific changes or key factors take place.
Bibliography
Baliamoune-Lutz, M. 2011. Growth by destination (Where You Ex- port Matters): Trade with China and growth in African countries.
African Development Review, 23(2):202-218.
British Broadcasting Corporation (BBC). 2015. China's economy is stumbling, but by how much? [Online]. Available: http://
www.bbc.com/news/business-34340936 [Assessed: 27 July 2016].
Clements, K., and Fry, R. 2008. Commodity currencies and currency commodities. Resources Policy, 33, 55-73.
Drummond, P. and Liu, E.X. 2013. Africa's rising exposure to China:
How large are spillovers through trade? IMF Working Paper Se- ries WP/13/250.
Food and Agriculture Organization (FAO). 2015. World agriculture:
towards 2015/2030 [Online]. Available: http://fao.org [Assessed:
30 April 2016].
East Asia Forum Quarterly, 2013. China’s declining working-age pop-
ulation [Online]. Available: http://
quarterly [Assessed: 19 February 2016].
Economist. 2014. China's $6.8 trillion hole? [Online]. Available:
http://www.economist.com [Accessed: 17 August 2016].
Economist. 2012. The end of cheap China [Online]. Available: http://
www.economist.com [Accessed: 28 August 2016].
Taylor, I. 2014. Africa Rising? BRICS – Diversifying Dependency.
Oxford: James Currey.
IMFdirect. 2015. Metals and oil: a tale of two commodities. [Online].
Available :http://imfdirect.imf.org [Assessed: 18 July 2016].
Independent Business News. 2015. How China’s slowing GDP growth could drag down the global economy [Online]. Available : http://
independent.co.uk [Accessed: 3 May 2016].
International Monetary Funds. 2016. World Economic Outlook Data- base. [Online]. Available: http://imf.org [Accessed: 2 March 2016] .
International Trade Centre (ITC). 2016. Trade Map. [Online]. Availa- ble: http://trademap.org [Accessed: 18 May 2016].
Lin, J. 2016. Don’t worry, China will keep growing. [Online]. Availa- ble: http://en.nsd. edu. cn [Accessed: 19 August 2016].
Lin, J. 2012. New Structural Economics: a framework for rethinking development and policy. [Online]. Available: http://
siteresources.worldbank.org [Accessed: 12 January 2016].
McFarlane, I. 2014. Agricultural commodity markets: Reference point for the real value of a currency. Modern Economy, 5, 533-540.
Statistica. 2016. China: composition of GDP (gross domestic product) across economic sectors. [Online]. Available: http://
statistica.com [Assessed: 8 September 2016].
World Economic Forum. 2016. Global Competitiveness Report [Online]. Available: http://weforum.org [Assessed: 12 February 2016].
World Bank. 2016. Global Economic Prospects. [Online]. Available:
http:// worldbank.org [Accessed: 14 February 2016].
World Bank. 2016. World Integrated Trade Solution (WITS). [Online].
Available: http://wits.worldbank.org/ [Accessed: 27 July 2016].
World Bank 2016. World Development Indicators. [Online] Available:
http://data.worldbank.org [Accessed: 13 May 2016].
Roberts, M., and Schlenker, W. 2009. World supply and demand of food commodity calories. American Journal of Agricultural Eco- nomics, 91, 1235-1242.
Trade and Law Centre (Tralac). 2016. China Africa trade relations.
[Online]. Available: http://tralac.org [Accessed: 17 March 2016].
United Nations Conference on Trade and Development (UNCTAD).
2015. [Online]. Available: http:// unctad.org [Accessed: 11 May 2016]
von Reibnitz, U. 1998. Scenario Techniques. Hamburg: McGraw-Hill.
Wack, P. 1985. Scenarios, shooting the rapids. Harvard Business Re- view 5, 131–142.
Yu, Y. 2011. Identifying the linkage between major mining commodi- ty circle and China economic growth: its implications for Latin America. IMF Working Paper, No. 11/86.
Zafar, A. 2007. The growing relationship between China and Sub- Saharan Africa: macroeconomic, trade, investment, and aid links.
The World Bank Research Observer, Advance Access.