A CRITICAL APPRAISAL OF POLICY ON EDUCATOR POST
PROVISIONING IN PUBLIC SCHOOLS WITH PARTICULAR
REFERENCE TO SECONDARY SCHOOLS IN KWAZULU-NATAL
by
INBANATHAN NAICKER
Thesis submitted in fulfillment of the DOCTOR OF EDUCATION (DEd) in the discipline Education Management and Leadership, School of Education and
Development, Faculty of Education, University of KwaZulu-Natal
PROMOTER: Prof. Thengani H. Ngwenya
DATE SUBMITTED: November 2005
DECLARATION
I declare that this thesis titled, A CRITICAL APPRAISAL OF POLICY ON EDUCATOR POST PROVISIONING IN PUBLIC SCHOOLS WITH PARTICULAR REFERENCE TO SECONDARY SCHOOLS IN KWAZULU- NATAL is my own work and that all the sources that have been used or quoted, have been indicated and acknowledged by means of complete references.
______________________
Inbanathan Naicker Reg. No.: 8116342 November 2005
ABSTRACT
Historically, educator post provisioning in South African public schools has been a contentious issue. Informed by the apartheid ideology, the staffing of schools was skewed both quantitatively and qualitatively in favour of the white population group. In contrast, the schools catering for the black population had to contend with high learner-educator ratios and poorly qualified educators. With the coming into power of the first democratically elected government in 1994 there was growing optimism that equity, redress and social justice would prevail in all spheres of society, including education. In the education arena there were significant attempts at addressing the inequity that prevailed in terms of educator distribution.
This study which is grounded in the field of policy analysis, critically analyses the policy on educator post provisioning in public schools in KwaZulu-Natal in the post apartheid era. It focuses on the ideological underpinnings of policy on educator provisioning, the evolution of policy on educator post provisioning and the impact of policy on educator post provisioning from a social justice perspective. The views of the implementers of policy on educator post provisioning, namely, the school principals are also elicited.
A combination of both the quantitative and qualitative research paradigms was employed in order to gather data in this study. A survey questionnaire was administered to principals in order to elicit their views on educator provisioning. Semi-structured and unstructured interviews were also conducted with principals and teacher union officials, respectively. An extensive study was also made of documents relating to educator post provisioning. The data gathered from these data sources was analyzed using critical theory as an over-arching analytical framework. Neoliberalism, managerialism and RAMs were also used as analytical tools in this study.
The conclusions arrived at indicate that we are far from attaining equity in educator distribution. The state’s preoccupation with neoliberal ‘managerialist’ reforms in the education sector is in fact exacerbating inequity in educator distribution. Principals also view the state’s policy on educator post provisioning with much negativity.
DEDICATION
For my children, Kreevin and Leasha.
May this study serve as a source of inspiration to you.
ACKNOWLEDGEMENTS
An undertaking of this magnitude is not possible without the grace of God. I am, therefore, indebted to Swami Shri Sathya Sai Baba for granting me the courage, strength, wisdom and sustenance to complete this study.
I am extremely thankful to my promoter, Prof. T H Ngwenya for his competent guidance and wisdom throughout this study. His tremendous insight, illuminating critical comments and unfailing support proved invaluable.
To my wife Silochana and children Kreevin and Leasha, go my sincerest thanks for their love and encouragement, and for being committed to my aspirations. They really served as a tower of strength. Their patience and endurance when I was not always available is much appreciated.
I am also grateful to my parents, Kistasamy and Devanai Naicker, for instilling in me, from a very young age, the value of education. Their constant encouragement and support served as a tremendous motivation.
My in-laws, Arumugam and Asothama Pillay also contributed significantly to the success of this study. My father-in-law, a retired school principal and SEM, voluntarily at times served as a research assistant, engaging in the distribution and retrieval of the questionnaires.
I am also grateful to my principal, Dr Saths Govender who not only inspired me into pursuing this study but who also very unobtrusively monitored my progress with regard to this study. At times when my workload became increasingly demanding, he unfailingly provided the necessary support and encouragement. Further, his competent proof reading of this study helped to enhance the quality of the final product.
My profound gratitude is extended to my to my seminar group, Prof. R Sookraj, Dr P Ramrathan, Prof. N Bojuwoye, Dr S Reddy, Ronicka Mudaly, A K Mohamed, Meara Applesamy, Jabulani Mpungose, Mona Singh, Marge Bhagowat and Tilly Moodley for their healthy debates and constructive criticisms of my work in progress with regard to this study. Their inputs assisted me tremendously in providing new insights to this study.
A special thank you is due to Mr Y I Ramcheron (Deputy Provincial Secretary – SADTU) and Mr T P Reddy (Provincial Negotiator – APEK) for so willingly making available documentation relevant to this study.
To the many principals across the province who took the time to complete my questionnaire, and to the principals and union officials who made time available for the interviews go my profound thanks. Your input made this study possible.
The assistance of the Spencer Foundation is much appreciated. The granting of the Spencer Fellowship to me proved to be of immense help. Their financial assistance enabled me to meet much of the costs associated with this study.
TABLE OF CONTENTS PAGE
Title Page Declaration Abstract Dedication
Acknowledgements List of Tables List of Figures
Abbreviations and Acronyms
CHAPTER ONE : BACKGROUND AND ORIENTATION TO THIS STUDY
1.1 Introduction 1.2 Purpose of this Study
1.3 Critical Questions 1.4 Rationale for this Study 1.5 Significance of this Study 1.6 Statement of the Problem 1.7 Delimitation of the Study 1.8 Definition of Terms
1.8.1 Post Provisioning Model (PPM) 1.8.2 Post Provisioning Norm (PPN) 1.8.3 Learner-Educator Ratio
1.8.4 Public Schools 1.8.5 Equity
1.8.6 Redress 1.8.7 Policy 1.8.8 Ideology
1.9 Review of Literature
i ii iii iv v xiv xviii
xxi
1 5 5 5 6 7 7 8 8 8 9 9 9 10 10 10 11
1.10 Research Methodology 1.10.1 Overview of Research Plan 1.10.2 Methodology
1.10.3 Instrumentation and Data Collection 1.10.4 Sampling Procedure
1.11 Chapter Outline 1.12 Summary
CHAPTER TWO: THE INTRICACIES OF THE POLICY PROCESS:
THE CASE OF EDUCATOR POST PROVISIONING
2.1 Introduction 2.2 The Macroeconomic Framework
2.2.1 The Essence of Gear 2.2.2 The RDP and the GEAR
2.2.3 The Gear and its Impact on Education
2.3 The Gear and the Medium-Term Expenditure Framework (MTEF) 2.3.1 The South African Budgetary Process and Budgetary Reform 2.3.2 The Link Between GEAR and The Medium Term Expenditure Framework (MTEF)
2.4 The Financing of Public Education in South Africa 2.4.1 Provincial Budgets and Education Expenditure 2.4.2 Personnel Expenditure
2.4.3 Non-Personnel Expenditure
2.4.4 The NSSF and Personnel Expenditure 2.4.5 Commentary on the NSSF
2.5 The Policy Framework for Schools in South Africa 2.5.1 The South African Schools Act
2.5.2 The South African Schools Act and Private Funding 2.6 Developments with regard to Educator Provisioning 2.6.1 Resolution 3 of 1996
2.6.1.1 Determinination of Staffing Norms
11 11 12 13 13 14 16
17 17 18 20 20 22 22 23
24 24 26 27 28 29 30 31 32 35 36 36
2.6.1.2 Implementing Resolution 3 of 1996
2.6.1.3 Termination of the Nationally Driven Rightsizing Process 2.6.1.4 Resolution 3 of 1996 and Rightsizing
2.6.2 Showdown Between Educator Unions and the State with regard to Educator Provisioning
2.6.3 Personnel Costs
2.6.4 The Employment of Educators Act, 76 of 1998 and Educator Post Provisioning
2.6.5 The Creation of Educator Posts and the New Post Distribution Model 2.6.5.1 The Post Provisioning Model (PPM)
2.6.5.2 Weighting Norms
2.6.6 Implementation of Resolution 6 of 1998
2.6.7 Educator Post Provisioning since the Implementation of Resolution 6 of 1998
2.6.8 The Timing of the Release of the PPN 2.6.9 Dissatisfaction with the PPM
2.6.10 The Revised PPM
2.6.10.1 Determination of Educator Post Establishments of a Provincial Department of Education by the MEC
2.6.10.2 Features of the Revised PPM 2.6.10.3 Weighting Norms
2.6.10.4 An Assessment of the Revised PPM
2.6.11 Post Provisioning and Learner-Educator Ratios
2.6.12 Procedures for the Implementation of the Post Provisioning Norm (PPN) at School Level
2.6.12.1 Objectives of the PPN Implementation 2.6.12.2 Main Principles
2.6.12.3 Implementation of the PPN
2.6.12.4 Identification of Educators ‘Additional/Surplus’ to the Staff Establishment
2.6.12.5 Management Plans
38 40 40 42
46 46
46 47 49 50 53
54 55 56 56
57 58 60 62 65
65 65 65 66
67
2.6.12.6 Commentary on PPN Implementation
2.6.12.7 PPN Implementation and School Organisation 2.6.13 The Unfolding of the 2004 PPN Debacle in KZN 2.7 Summary
CHAPTER THREE: THEORETICAL ORIENTATION
3.1 Introduction 3.2 Policy Analysis
3.2.1 Critical Policy Analysis and Critical Theory 3.2.1.1 Critique of Ideology
3.2.1.2 Critique of Instrumental Rationality 3.2.1.3 Enlightenment
3.2.1.4 Emancipation 3.2.2 What is Policy?
3.2.3 Types of Policies 3.2.4 Policy Making
3.2.4.1 The Policy Making Process 3.2.4.2 The Policy Actors
3.2.5 Policy Implementation Analysis 3.2.5.1 The Policy Message
3.2.5.2 The Bureaucrats and the Administrators 3.2.5.3 The Educators
3.2.6 Policy Tools 3.2.6.1 Authority Tools 3.2.6.2 Capacity Tools
3.2.6.3 Symbolic and Hortatory Tools 3.3 The Neoliberal Ideology
3.3.1 The Concept Ideology
3.3.2 The Essence of Neoliberalism
3.3.3 South Africa’s Commitment to Neoliberalism 3.3.4 From a Neoliberal to a Developmental State
67 67 69 75
77 77 78 79 80 80 80 81 83 84 84 86 87 89 90 91 91 91 92 92 93 93 94 95 97
3.4 Managerialism
3.4.1 The Paradigm Shift to Public Management 3.4.2 The Doctrines of NPM
3.4.3. Managerialism and Education 3.4.3.1 An International Perspective 3.4.3.2 The Costs of Managerialism 3.5 Resource Allocation Models 3.5.1 Characteristics of a RAM 3.5.2 Why use a RAM?
3.5.3 Potential Problem Areas in the Use of a RAM 3.5.4 Equity Considerations in the Use of a RAM 3.6 Summary
CHAPTER FOUR: RESEARCH DESIGN AND METHODOLOGY 4.1 Introduction
4.2 Methodological Approach 4.3 The Survey Questionnaire
4.3.1 Construction and Design of the Questionnaire 4.3.2 Measurement
4.3.3 Pre-Testing and Validation of the Questionnaire 4.3.4 Sampling Framework
4.3.4.1 Defining the Population 4.3.4.2 Drawing the Sample 4.3.4.3 Sample Size
4.3.4.4 Selection of Schools
4.3.5 Administering the Questionnaire
4.3.5.1 Permission from the Department of Education 4.3.5.2 Distribution of Questionnaires
4.3.6 Analysis of Data 4.3.6.1 Descriptive Statistics 4.3.6.2 Inferential Statistics
97 98 99 99 99 102 104 105 106 106 108 109
110 110 112 112 114 115 116 116 117 118 122 123 123 123 124 124 124
4.4 Interviews
4.4.1 Rationale for the Use of Interviews 4.4.2 Interview Informants
4.4.3 Selection of Informants 4.4.4 Nature of The Interviews
4.4.5 Trialling of Interview Questions 4.4.6 Ethical Considerations
4.4.7 Analysis of Interview Data 4.5 Document Study
4.6 Summary
CHAPTER FIVE: PRESENTATION, ANALYSIS AND DISCUSSION OF DATA
5.1 Introduction
5.2 Presentation of the Quantitative Data 5.3 Presentation of the Qualitative Data
5.3.1 Transparency in the Distribution of Educators 5.3.2 Workshops on Post Provisioning
5.3.3 Criteria Used for the Allocation of Redress Posts 5.3.4 School Curricula
5.3.5 Class Size
5.3.6 Learners With Special Educational Needs
5.3.7 Admission of Learners from Disadvantaged Communities 5.3.8 Second Language Speakers of English
5.3.9 Employment of SGB Paid Educators 5.3.10 Release of the PPN
5.3.11 Filling of Vacant Posts
5.3.12 Documents on Implementation
5.3.13 Support for and Participation in the Process of PPN Implementation 5.3.14 Multi-Term PPN
5.4 Emerging Trends and Patterns from the Data
124 124 125 125 126 127 127 127 128 128
129 130 184 184 185 186 188 191 192 193 194 194 195 198 201 202 205 205
5.4.1 Equity Concerns 5.4.2 Redress Concerns
5.4.3 Consultation of Principals on Post Provisioning Issues 5.4.4 Workshops on the Post Provisioning Formula
5.4.5 Ranking of Factors in the PPM
5.4.6 The PPN and the Curriculum Needs of Learners 5.4.7 Timing of the Announcement of the PPN 5.4.8 Filling of Educator Posts
5.4.9 Implementation of the PPN 5.4.10 Multi-Term PPN
5.5 Emerging Trends and Patterns from the Document Study 5.5.1 Decentralisation in Educator Provisioning
5.5.2 Trimming of Education Budgets 5.5.3 Downsizing of Educator Posts 5.5.4 Privately Paid Educators 5.6 Summary
CHAPTER SIX: CONCLUSIONS AND RECOMMENDATIONS 6.1 Introduction
6.2 Conclusions 6.3 Recommendations
BIBLIOGRAPHY
ANNEXURES
Annexure A: Permission to Conduct Research
Annexure B: Granting of Permission to Conduct Research Annexure C: Covering Letter – Questionnaire
Annexure D: Questionnaire
Annexure E: Semi-Structured Interview Schedule – Principals Annexure F: Unstructured Interview – Union Officials
205 209 210 212 213 219 220 221 224 227 228 228 228 228 229 230
231 231 236
243
265 266 267 268 274 275
LIST OF TABLES
PAGE Table 1.1: Average learner-educator ratios by race and phase, 1994
Table 1.2: Average learner-educator ratios by new province and race in1994
Table 2.1: Integrated scenario projections, 1996-2000
Table 2.2: Education as a percentage of provincial expenditure.
Table 2.3: Provincial education personnel expenditure as a percentage of the education budget.
Table 2.4: Learner-educator ratios in KZN
Table 2.5: Learner-educator ratios in South Africa
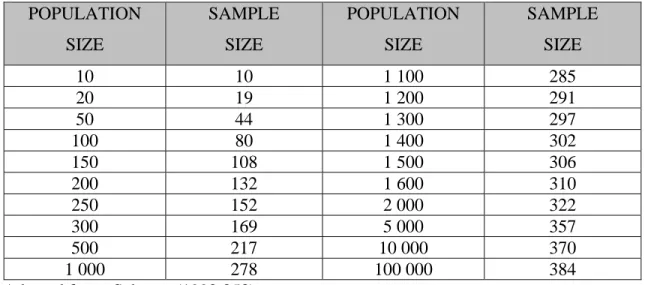
Table 4.1: Table for determining sample size from a given population Table 4.2: Sampling framework
Table 5.1: Frequency distribution of years of experience as principal Table 5.2: Frequency distribution of geographic location of schools.
Table 5.3: Frequency distribution of functionality of SGB.
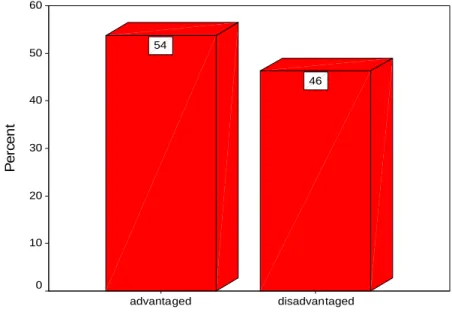
Table 5.4: Frequency distribution of classification of school in terms of funding.
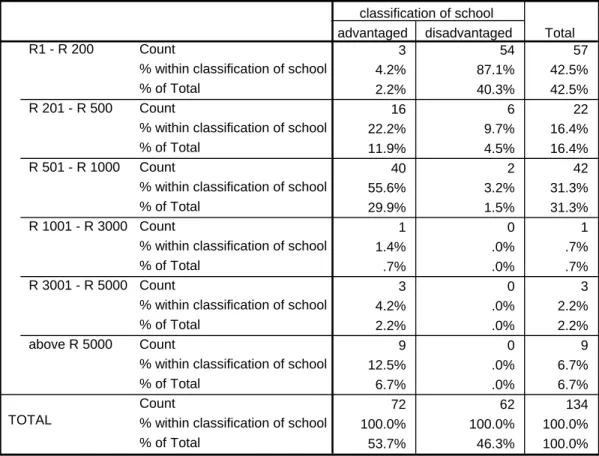
Table 5.5: Frequency distribution of annual school fee payable per learner.
Table 5.6: T-test for equality of means between advantaged and
disadvantaged schools in terms of annual school fee payable.
Table 5.7: Frequency distribution of percentage of parents who actually pay school fees.
Table 5.8: Frequency distribution of the socio-economic status of the community from which the school draws the majority of its learners.
Table 5.9: Frequency distribution of the material resources available in the school.
Table 5.10: Pearson’s product moment correlation between annual school fees paid and material resources available in the school.
Table 5.11: Frequency distribution of general infrastructure of the school.
3 3
19 25 27
63 64 119 121 130 131 132 133
134 136
137
138
139
141
141
Table 5.12: Pearson’s product moment correlation of annual school fee paid per learner and general infrastructure of the school.
Table 5.13: Frequency distribution in respect of consultation with regard to the design of the PPM.
Table 5.14: Frequency distribution indicating the consulting agency with regard to the design of the PPM.
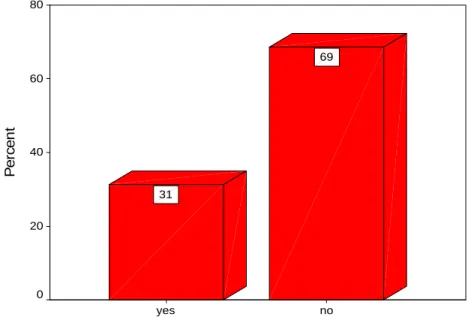
Table 5.15: Frequency distribution with regard to whether principals were workshopped on the formula used to calculate the post
provisioning norm (PPN).
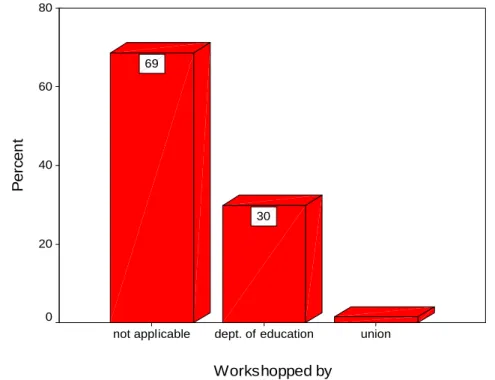
Table 5.16: Frequency distribution of the agency that workshopped principals on the formula used to calculate the PPN.
Table 5.17: Frequency distribution showing educator distribution in terms of redress.
Table 5.18: Frequency distribution showing rank order of poverty grading of a school.
Table 5.19: T-test for equality of means between advantaged and
disadvantaged schools in terms of the factor poverty grading of a school.
Table 5.20: Frequency distribution showing the ranking of the factor the need to promote particular subjects/learning areas in schools.
Table 5.21: T-test for equality of means between advantaged and disadvantaged schools in terms of the factor the need to promote subjects/learning areas.
Table 5.22: Frequency distribution showing ranking of the factor maximum ideal class size of specific subjects/learning areas.
Table 5.23: T-test for equality of means between advantaged and disadvantaged schools in terms of the factor the maximum ideal class size of subjects/learning areas.
Table 5.24: Frequency distribution of the ranking of the factor more than one language medium of instruction.
143
143
144
146
147
148
149
150
151
152
153
154
155
Table 5.25: T-test for equality of means between advantaged and disadvantaged schools in terms of the variable language medium of instruction.
Table 5.26: Frequency distribution showing the ranking of the factor learners with special educational needs.
Table 5.27: Frequency distribution showing the factor qualification level of educators at a school.
Table 5.28: T-test for equality of means between advantaged and
disadvantaged schools in terms of the factor qualification level of educators at a school.
Table 5.29: Frequency distribution of the factor learners admitted from disadvantaged communities.
Table 5.30: T-test for equality of means between advantaged and
disadvantaged schools in terms of the factor learners admitted from disadvantaged communities.
Table 5.31: Frequency distribution of the factor learners who are second language speakers of English.
Table 5.32: T-test for equality of means between advantaged and
disadvantaged schools in terms of the factor learners who are second language speakers of English.
Table 5.33: Frequency distribution showing whether the incremental revisions made to the PPM has resulted in equity in educator distribution.
Table 5.34: Frequency distribution of classification of school and curriculum diversity.
Table 5.35: Frequency distribution showing whether the number of state- paid posts caters for the curriculum needs of learners.
Table 5.36: Frequency distribution showing whether the SGB allocates funds for the employment of educators.
Table 5.37: Chi-square test of classification of school and allocation of funds by SGBs for the employment of additional staff.
156
156
157
159
159
161
161
163
163
165
166
168
169
Table 5.38: Frequency distribution depicting the number of SGB paid educators employed.
Table 5.39: Pearson’s product moment correlation between annual school fee payable and number of educators employed by the SGB.
Table 5.40: Frequency distribution showing whether the education
department’s timing of the announcement of the PPN leads to effective school organisation.
Table 5.41: Frequency distribution showing whether substitute educators are appointed timeously by the department.
Table 5.42: Frequency distribution showing whether vacant posts are filled timeously by the education department.
Table 5.43: Frequency distribution showing whether principals are consulted on issues of implementation of the PPN
Table 5.44: Frequency distribution showing whether the department of education sets clear directives as to how the PPN is to be implemented.
Table 5.45: Frequency distribution showing whether the documents on the implementation of the post provisioning norm are clear and unambiguous.
Table 5.46: Frequency distribution showing whether members of staff are apprised of the objectives and processes of the post
provisioning norm implementation.
Table 5.47: Frequency distribution showing support for and participation in the process of implementation.
Table 5.48: Frequency distribution showing participation of site stewards in the implementation process.
Table 5.49: Frequency distribution showing support provided by the department via. SEMs with regard to implementation.
Table 5.50: Annual release dates of the PPN
Table 5.51: State-paid educators employed in public schools in KZN Table 5.52: State and SGB paid educators employed in public schools
170
171
171
172
173
175
176
177
178
179
180
181
220 229 229
LIST OF FIGURES
PAGE Figure 5.1: Bar graph depicting years of experience as principal.
Figure 5.2: Bar graph depicting geographic location of schools.
Figure 5.3: Bar graph depicting functionality of SGB.
Figure 5.4: Bar graph depicting classification of school in terms of funding.
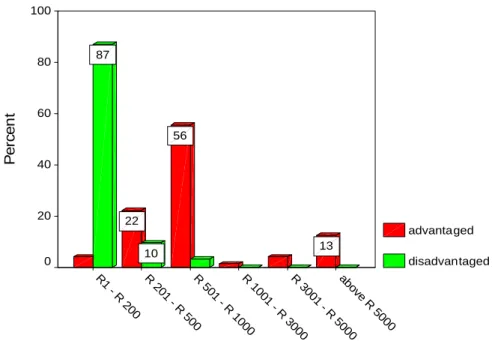
Figure 5.5: Bar graph depicting annual school fee payable per learner.
Figure 5.6: Bar graph depicting the socio-economic status of the community from which the school draws the majority of its learners.
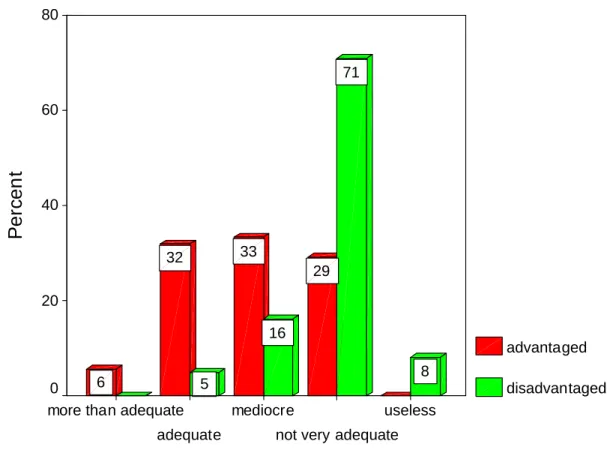
Figure 5.7: Bar graph depicting the material resources available in the school.
Figure 5.8: Bar graph of general infrastructure of the school.
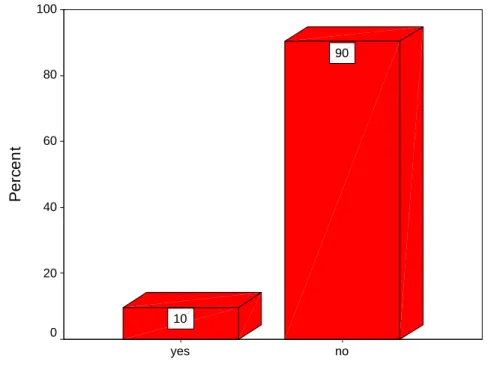
Figure 5.9: Bar graph depicting consultation with regard to the design of the PPM.
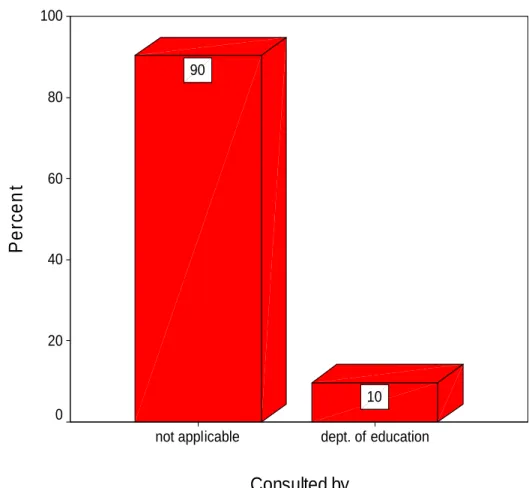
Figure 5.10: Bar graph depicting the consulting agency with regard to the design of the PPM.
Figure 5.11: Bar graph depicting whether principals were workshopped on the formula used to calculate the post provisioning norm (PPN).
Figure 5.12: Bar graph depicting the agency that workshopped principals on the formula used to calculate the PPN.
Figure 5.13: Bar graph showing educator distribution in terms of redress.
Figure 5.14: Bar graph showing rank order of poverty grading of a school.
Figure 5.15: Bar graph depicting ranking in terms of the need to promote particular subjects/learning areas in schools.
Figure 5.16: Bar graph depicting ranking of the factor maximum ideal class size of specific subjects/learning areas.
Figure 5.17: Bar graph showing the ranking of the factor more than one language medium of instruction.
130 131 132 133 135 138
140
142 144
145
146
147
148 149 151
153
155
Figure 5.18: Bar graph depicting the ranking of the factor learners with special educational needs.
Figure 5.19: Bar graph showing the factor qualification level of educators at a school.
Figure 5.20: Bar graph showing the factor learners admitted from disadvantaged communities
Figure 5.21: Bar graph showing the factor learners who are second language speakers of English.
Figure 5.22: Bar graph showing whether the revisions made to the PPM has resulted in equity in educator distribution.
Figure 5.23: Bar graph of classification of school and curriculum diversity Figure 5.24: Bar graph depicting whether the number of state paid posts caters for the curriculum needs of learners.
Figure 5.25: Bar graph depicting whether the SGB allocates funds for the employment of educators.
Figure 5.26: Bar graph showing the number of SGB paid educators employed.
Figure 5.27: Bar graph depicting whether the education department’s timing of the announcement of the PPN leads to effective school organisation.
Figure 5.28: Bar graph depicting whether substitute educators are appointed timeously by the department.
Figure 5.29: Bar graph depicting whether vacant posts are filled timeously by the education department.
Figure 5.30: Bar graph showing whether principals are consulted on issues of implementation of the post provisioning norm.
Figure 5.31: Bar graph showing whether the department of education sets clear directives as to how the PPN is to be implemented.
Figure 5.32: Bar graph showing whether the documents on the
implementation of the post provisioning norm are clear and unambiguous.
157
158
160
162
164
165 167
168
170
172
173
174
175
176
177
Figure 5.33: Bar graph showing whether members of staff are apprised of the objectives and processes of the post provisioning norm implementation.
Figure 5.34: Bar graph showing support for and participation in the process of implementation by staff members.
Figure 5.35: Frequency distribution showing participation of site stewards in the implementation process.
Figure 5.36: Frequency distribution showing support provided by the department via. SEMs with regard to implementation.
178
179
180
181
ABBREVIATIONS AND ACRONYMS
ANC African National Congress
APEK Association of Professional Educators of KwaZulu-Natal COSATU Congress of South African Trade Unions
DBSA Development Bank of Southern Africa
DNE Department of National Education
ELRC Education Labour Relations Council
EMIS Education Management Information Systems
FET Further Education and Training
GDP Gross Domestic Product
GEAR Growth, Employment and Redistribution Strategy
GNU Government of National Unity
HOD Head of Department
KZN KwaZulu-Natal
KZN DEC KwaZulu-Natal Department of Education and Culture KZN ELRC KwaZulu-Natal Education Labour Relations Chamber
MDM Mass Democratic Movement
MEC Member of the Executive Committee
MTEF Medium Term Expenditure Framework
NAPTOSA National Professional Teachers Organisation of South Africa
NP National Party
NSSF National Norms and Standards for School Funding NUPSAW National Union of Public Service and Allied Workers OECD Organisation for Economic Co-operation and Development
PPM Post Provisioning Model
PPN Post Provisioning Norm
RDP Reconstruction and Development Programme REQV Relative Equivalent Qualification Value SACE South African Council for Educators
SADTU South African Democratic Teachers Union
SADTU KZN South African Democratic Teachers Union KwaZulu-Natal SAFCERT South African Certification Council
SAIRR South African Institute of Race Relations SEM Superintendent of Education Management
SGB School Governing Body
TLSA Teachers League of South Africa
VSP Voluntary Severance Package
1
CHAPTER ONE
BACKGROUND AND ORIENTATION TO THIS STUDY
1.1 INTRODUCTION
Prior to 1994, education in South Africa was structured along racial lines in keeping with the apartheid ideology of the National Party government. Separate education departments catered for the needs of the four principal racial groups in South Africa. This resulted in the creation of nineteen education departments catering for the educational needs of Whites, Indians, Coloured and Africans on a separate and grossly unequal basis. This education system prepared learners in different ways for the positions they were expected to occupy in the social, economic and political life under apartheid.
Apartheid education was characterized by wide-ranging imbalances and inequities. Some of the more notable input inequities in school-based education were the disparities in the per capita expenditure, the learner-educator ratios, the qualifications of educators and physical resource allocation (Naicker 1996:11). The Education White Paper 2 highlighted these disparities by pointing out that the former racially and ethnically organized departments of education embodied substantial inequalities in per capita spending, the largest disparities being accounted for in the ‘skewed’ distribution of teacher qualifications, inappropriate linking of salary levels to qualifications, and disparities in learner-educator ratios (South Africa 1996b:29). Thus under apartheid, educator provisioning at public schools, in terms of both their quantitative and qualitative distribution, was a contentious issue and was one of the major contributory factors to the differences in output of the public schooling system of the four race groups in the country.
The coming into power of South Africa’s first democratically elected government in 1994 heralded the introduction of a major reform process in education. This reform process
2
commenced with the creation of a single national ministry of education together with nine provincial education departments which were to cater for the needs of the nine newly formed provinces (Gilmour 2001:6, Soudien 2001:34). Further, the newly elected government committed itself to the elimination of inequalities in the provision of education (Steyn 1999:67). It was the intention of the government to ensure an equitable, efficient, qualitatively superior and financially sound school system for all its learners.
The Education White Paper 2, therefore, advocated that funding must ensure both equity and redress in funding from public (budgetary) resources, in order to achieve a fair distribution of public funds and the elimination of backlogs caused by past unequal treatment. It further alluded to prioritizing efficiency in resource allocation, utilization and expected outcomes (South Africa 1996b).
Since the Government of National Unity (GNU) came into power in 1994, volumes of policy documents were produced. The majority of these policies were aimed at the transformation of the South African society. Some of the national policies aimed at social transformation were the Constitution of the Republic of South Africa Act, 108 of 1996, the Reconstruction and Development Programme (RDP) and the Growth, Employment and Redistribution Strategy (GEAR). These policies set the general context for the development of policies that were more specific to particular sectors such as education.
The general policy context promoted the principles of redress, equity, nation building and democracy (Harley, Bertram & Matson 1999:15).
Historically, the learner-educator ratios favoured the White population group. African education was characterized by extremely high learner-educator ratios. The National Teacher Education Audit, commissioned by the Department of National Education (DNE) noted the following inequitable learner-educator ratios in 1994.
3
Table 1.1: Average learner-educator ratios by race and phase, 1994
RACE PRIMARY SCHOOLS SECONDARY SCHOOLS
White 23:1 16:1
Indians 27:1 16:1
Coloureds 27:1 20:1
Africans 43:1 31:1
Source: SAIRR (1996:23)
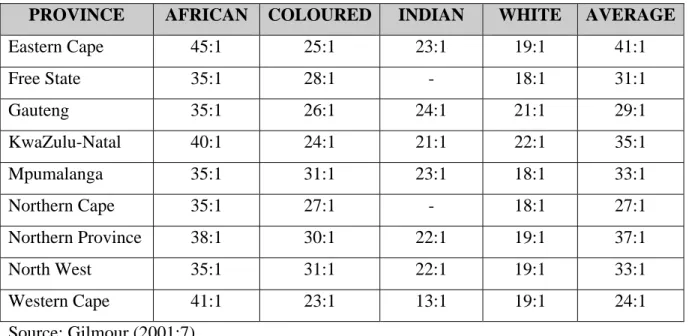
The learner-educator ratios by province in 1994 further reveals the inequity that prevailed.
Table 1.2: Average learner-educator ratios by new province and race in1994
PROVINCE AFRICAN COLOURED INDIAN WHITE AVERAGE
Eastern Cape 45:1 25:1 23:1 19:1 41:1
Free State 35:1 28:1 - 18:1 31:1
Gauteng 35:1 26:1 24:1 21:1 29:1
KwaZulu-Natal 40:1 24:1 21:1 22:1 35:1
Mpumalanga 35:1 31:1 23:1 18:1 33:1
Northern Cape 35:1 27:1 - 18:1 27:1
Northern Province 38:1 30:1 22:1 19:1 37:1
North West 35:1 31:1 22:1 19:1 33:1
Western Cape 41:1 23:1 13:1 19:1 24:1
Source: Gilmour (2001:7)
The above tables (table1.1 and table 1.2) illustrate the inequity that prevailed in terms of educator distribution. Therefore, as a matter of priority the DNE set about addressing the issue of the differences in learner-educator ratios through negotiations in the Education
4
Labour Relations Council (ELRC)1. Strongly influenced by World Bank studies which maintained that a learner-educator ratio of 35:1 was appropriate for schools in developing countries, the ELRC in late 1995 passed a significant resolution setting uniform national learner-educator ratios of 40:1 and 35:1 in primary and secondary schools respectively.
These norms took effect from January 1996. Further, the Education White Paper 2 pointed out that these ratios did not stipulate exact class sizes, but instead provided parameters within which each provincial bargaining chamber could negotiate educator provisioning scales for its schools. This was seen as a major step towards equity in the provision of educators to all public schools in the province (South Africa 1996b:29).
Notwithstanding these pronouncements to enable the provinces to move towards an equitable distribution of educators within 5 years, there were serious setbacks to this plan (DNE 1998:62).
Given the government’s macro-economic policies which focused on financial austerity in terms of spending on social services such as education, serious tensions were created in the provinces in terms of what was affordable and what was needed in terms of educator provisioning. Consequently, many of the provinces as a cost saving measure did not increase their human resource base but instead looked at a more equitable distribution of the existing human resource pool. Further, with the introduction of a decentralized budgetary process and the delegation of educator provisioning to the provinces since 1998, numerous problems were experienced in almost all provinces in attaining national guidelines in terms of learner-educator ratios. Provincial education budgets just weren’t large enough to employ additional educators in order to meet the dictates of national guidelines.
1 The ELRC is a registered bargaining council for educators. It is made up of two main parties viz. the employer (the state) and the employee (educators, through their representatives which are registered trade unions or organisations).
5 1.2 PURPOSE OF THIS STUDY
The purpose of this study is to critically analyze the policy on educator post provisioning in ordinary public secondary schools in the province of KwaZulu-Natal.
1.3 CRITICAL QUESTIONS
This study seeks to answer the following critical questions:
What are the ideological underpinnings of the policy on educator post provisioning?
What changes has policy on educator post provisioning undergone in order to meet the needs of schools?
What impact does policy on educator post provisioning have on issues of equity and redress?
What are the views of school principals with regard to policy on educator post provisioning and its implementation?
1.4 RATIONALE FOR THIS STUDY
Collectively, the following factors provide the rationale for this study:
The apartheid policies of the National Party government in education have resulted in an inequitable distribution of educators on racial lines to public schools.
The socio-political change that occurred in 1994 heralded the dawn of the pursuit of transformative policies in education. These policies were underpinned by values of social equity and redress. In terms of educator post provisioning, the goal was equity in educator distribution in public schools.
The implementation of policy on educator post provisioning has proved controversial and is fraught with problems. There are frequent reversals of policy decisions, postponements of implementation dates and ambiguity in the interpretation of policy documents.
6
From the researcher’s experience as an educator and member of a school management team (SMT) the following observations were noted:
- The efforts by SMTs to ensure the delivery of quality public education as well as to ensure effective and efficient schools is being seriously
undermined and compromised by the indecisiveness of the KwaZulu-Natal Department of Education and Culture (KZN DEC) with regard to educator post provisioning.
- The annual announcement of the post provisioning norm for schools together with the prospect of redeployment of educators declared in surplus to their institutions has created tension, bitterness and conflict among
educators at public schools. Further, it has led to low morale and a reduction in educator productivity.
- The movement of educators whilst the academic year is in progress has serious implications for sound school organization and administration.
1.5 SIGNIFICANCE OF THIS STUDY This study is significant in that it will:
add to the scholarly research and literature in the field of educator post provisioning.
draw the attention of policymakers to the tension between the development of policy on educator post provisioning and the challenges of implementation.
provide information to policymakers with a view to improving policy on educator post provisioning.
sensitize both policymakers and education authorities to the views of principals on educator post provisioning.
inform education authorities of the incongruence between policy intentions of educator post provisioning and practice.
7 1.6 STATEMENT OF THE PROBLEM
According to Motala and Mungadi (1999:7), the formation of post apartheid education policies is largely shaped by a macro-economic framework rooted in globalization. They contend that the quest ‘for equity, redress and social development’ as a policy vision in education is seriously ‘being constrained by demands for fiscal restraint and curbs in social spending’.
Given this scenario, the problem to be studied in this envisaged research is whether educator provisioning in a province is ‘needs driven’ or ‘market-driven’. In terms of needs, does prevailing policy ensure equity and redress in educator distribution?
Inevitably, this raises questions about the country’s macro-economic policies and the ideology or set of ideologies underpinning it.
1.7 DELIMITATION OF THE STUDY
This study is confined to educator provisioning in the post 1994 era when a democratic order was installed into power in South Africa. It is specifically limited to the Province of KwaZulu-Natal.
Given the constraints of time and finance, it was not possible to focus on all school sectors in the Province. Hence, this study is confined to educator post provisioning in the ordinary public secondary school sector in the Province. Notwithstanding this limitation, the researcher is confident that this study has significance for the other eight provinces in South Africa as well as the other public school sectors.
8 1.8 DEFINITION OF TERMS
In order to facilitate understanding, broad explanations of the key terms associated with this study are provided.
1.8.1 POST PROVISIONING MODEL (PPM)
The PPM is a resource allocation model (RAM). Once the educator pool of a province is determined by the MEC for education in the province, the PPM is used to distribute that pool of educators to public schools. The PPM takes various factors into account which has a bearing on a school’s educator post provisioning needs. It is extremely technical and has a number of formulae built into it. It was first used as a RAM in 1999. Owing to growing discontent with the PPM, minor revisions were effected to it in 2002.
1.8.2 POST PROVISIONING NORM (PPN)
The outcome of the application of the PPM is the PPN. The PPN refers to the total number of state paid educator posts allocated to an institution regardless of their post level. It includes classroom-based educators (level 1) and management staff (Education Specialists, Deputy Principal/s and Principal). A PPN report is given annually to all public schools which stipulate the number of state paid level 1 and management posts the school is entitled to.
If a school’s staff establishment is above the declared PPN for the year, then that school must declare those posts that are above the PPN as ‘surplus’. Educators who are deemed
‘surplus’ are redeployed through compulsory temporary transfers (CTTs) to schools were vacancies exist. On the other hand, if a schools staff establishment is below the declared PPN for the year, then the school has vacant posts. These posts may initially be filled by educators who are ‘surplus’ in other schools through a compulsory temporary transfer (CTT) or through the appointment of a temporary educator. The vacant post can only be filled in a permanent capacity through advertisement in a provincial vacancy bulletin.
9 1.8.3 LEARNER-EDUCATOR RATIO
The learner-educator ratio refers to the ratio between the total number of enrolled learners and the number of state paid educators in the province. It includes educators employed in management posts such as education specialists, deputy principals and principals. It indicates on average the number of learners to be taught by one educator.
In practice, the learner-educator ratio is not a true reflection of class size. Class size is reflected by the leaner-classroom ratio. Owing to educators in management positions carrying lower period loads than their post level 1 counterparts, the class size is increased so as to accommodate the reduced period load of management members. In large secondary schools the class size can be as many as six to eight learners above the learner- educator ratio.
1.8.4 PUBLIC SCHOOLS
The South African Schools Act, 84 of 1996 categorizes all schools in the country as either public schools or independent schools. Public schools refer to the category of schools which, in theory, are almost entirely funded by the state with just minor contributions by the users of the service. In contrast, independent schools are almost entirely funded by personal or private funds of individuals or organisations with the state making only minor contributions or no contribution at all. In South Africa, by far the vast majority of learners attend public schools. The independent schools are the privilege of an elite few.
1.8.5 EQUITY
Equity refers to ‘leveling the playing field’ with no group being privileged in a transformed system (Motala & Mungadi 1999:13). It refers to fairness and justice. Justice may require providing special support to those who were disadvantaged in the past.
Equity would ensure that those who were more favoured in the past would receive less, while more will be given to those who were disadvantaged. Therefore, equity may mean that individual persons, even groups of people are treated unequally.
10 1.8.6 REDRESS
Redress refers to the correcting of past inequalities in policies and practice. In the South African context it refers to a commitment to shift the balance of power in favour of those who have been disadvantaged by apartheid. It is about correcting historical imbalances (Harley, Bertram & Mattson 1999:55).
1.8.7 POLICY
Some simplistic definitions of policy include ‘policy as a general expression of general purpose or desired state of affairs’, ‘policy as specific proposals’, ‘policy as decisions of government’, ‘policy as formal authorization’ and ‘policy as a programme’ (Taylor, Rizvi, Lingard & Henry 1997:23). Ball (1990:3), however, refers to policy as, ‘statements of prescriptive intent’ and ‘as operational statements of values’. Haddad (1995:18) defines policy as an explicit or implicit single decision or group of decisions which may set out directives for guiding future decisions, initiate or retard action, or guide implementation of previous decisions.
Policies are made by, for example, national and provincial governments, municipalities and schools. The policies made by national and provincial governments and implemented through state bureaucracies (central and provincial) are usually referred to as public policy. Social policy, which covers aspects such as health, welfare and education, is one type of public policy. Thus, education policy is a part of social policy (Claassen & Van Wyk 1999:5).
1.8.8 IDEOLOGY
Ideology refers to a set of beliefs and values which coheres together in a more or less systematic way and can, therefore, be differentiated from other such sets. An ideology is held by a group of people, for whom it explains the nature of the reality they experience, and it also has the power to commit them to action (Ashley 1989:2). Zvobgo (1997:49)
11
defines ideology as a system of thought based on related assumptions, beliefs, and explanation of social movements and policies.
1.9 REVIEW OF LITERATURE
The literature that was selected for review was obtained from a comprehensive search of national data bases such as the NEXUS data base on current and completed research in South Africa and international data bases such as ERIC and EBSCO. The majority of the books and journal articles on the political economy, public management, policy analysis and educator provisioning was obtained from the libraries at the former University of Durban-Westville and University of Natal (Durban) and through inter-library loans.
Further, literature on policy issues was obtained from the Education Policy Units at the University of Natal and Witwatersrand.
In addition, literature with regard to educator post provisioning, was obtained from national and provincial ELRC proceedings and annual reports from the DNE and KZN DEC. Circulars issued by the KZN DEC were also surveyed. Memoranda, minutes of meetings and communiqués issued by the teacher unions and associations such as SADTU and APEK were also utilized as a source of information. Information was also obtained from educator publications such as The Educators Voice and The Teacher. The various newspapers available in KZN were also used as sources of information.
Intergovernmental fiscal reports, policy documents on educator provisioning and the relevant legislative Acts were surveyed.
1.10 RESEARCH METHODOLOGY
A summary of the research methodology employed in this study is presented.
1.10.1 OVERVIEW OF RESEARCH PLAN
In order to address the first critical question namely, what are the ideological underpinnings of the policy on educator post provisioning?, the researcher consulted the
12
following data sources: the Growth Employment and Redistribution Strategy (GEAR) policy document, the Medium Term Expenditure Framework (MTEF), the national Norms and Standards for School Funding (NSSF), ELRC deliberations (minutes and reports) and the Intergovernmental Fiscal Review reports. These documents were critically analyzed with regard to its relevance to ideology and educator post provisioning.
The second critical question, namely, what changes has policy on educator post provisioning undergone in order to meet the needs of public schools?, was addressed by consulting the following data sources: ELRC Resolution 3 of 1996, Government Regulation R.593/4 of April 1998, Government Regulation R.1676 of December 1998 and Government Notice R.1451 of November 2002. These data sources were critically analyzed in terms of the incremental changes that policy on educator post provisioning has undergone.
In order to address the third and fourth critical questions, namely:
What impact does policy on educator post provisioning have on issues of equity and redress? and
What are the views of school principals with regard to policy on educator post provisioning and its implementation?
survey questionnaires and interviews (unstructured and semi-structured) were used to gather data. The data obtained from the survey questionnaires were analyzed using a statistical package (SPSS). The interview data were subjected to content analysis by grouping the data into themes and categories.
1.10.2 METHODOLOGY
Based on the critical questions and the available data sources, this study employed both the qualitative and quantitative research paradigms. The researcher saw both the paradigms as complementing each other in this study where the quantitative data was
13
used to provide ‘breadth’ and the qualitative data was used to provide ‘rich descriptions’
in support of the quantitative data. Further, by combining both methods the researcher was able to ensure that some form of triangulation of the data occurred which in turn enhanced the validity of this study.
1.10.3 INSTRUMENTATION AND DATA COLLECTION
A questionnaire, which was largely quantitative, was used to gather data from principals based at ordinary public secondary schools in the province of KwaZulu-Natal. The questionnaire was the researcher’s primary data gathering tool. Qualitative data was also gathered using semi-structured as well as unstructured interviews in order to corroborate the data gathered from the questionnaire as well as to provide depth. The principals of ordinary public secondary schools were used as informants for the semi-structured interviews and provincial negotiators of educator unions serving on the staffing committee of the ELRC were used as informants for the unstructured interviews.
The qualitative paradigm was also used in the study of documentary sources owing to the fact that the data is largely qualitative. In the study of documentary sources, the researcher sought primarily to describe and secondarily to critically analyze its contents.
The study of the documentary sources was integrated into the literature review.
1.10.4 SAMPLING PROCEDURE
Being aware of the fact that it was not possible nor practical to survey the views of the entire population of principals in the province, the researcher opted for selecting a representative sample of principals. In selecting the sample, the stratified systematic sampling technique was used. All 306 principals who were part of the sample were requested to complete the survey questionnaire.
In selecting the informants for the interviews, the purposeful sampling technique was used. Nine principals were selected for the semi-structured interviews and three
14
provincial negotiators serving on the ELRC Staffing Committee were selected for the unstructured interviews.
The documents selected for study were chosen using the purposeful sampling technique based on their direct or indirect relevance to educator provisioning.
1.11 CHAPTER OUTLINE
This research study is divided into six chapters.
CHAPTER ONE provides a general background and overview of the key aspects of this study. The study is introduced by pointing out the inequity that prevailed in educator distribution during the apartheid era and the subsequent transformative initiatives undertaken in the education arena since the advent of democracy in South Africa. The purpose of this study, the critical questions, the rationale for this study, the problem statement as well as the definition of key terms is then presented. A brief outline of methodology employed in this study brings this chapter to a close.
CHAPTER TWO points out the intricacies of the policy process by showing the interconnectedness of all social policies and its impact on educator post provisioning. It commences with a discussion on the macroeconomic framework of the country by outlining the essence of the GEAR strategy and its impact on education. The financing of education in terms of overall provincial budgets as well as personnel and non-personnel expenditure trends is also explored. A brief outline on the policy framework for schools is discussed with specific emphasis on the South African Schools Act and the role of school governing bodies (SGBs). An account of the private financing provisions of the Act is then presented. A study with regard to state policies on educator provisioning is then explored.
15
CHAPTER THREE presents the chosen theoretical frameworks and concepts. It commences by grounding this study in the field of policy analysis and provides a justification for employing critical theory as an over-arching analytical framework in this study. The concept of ideology is then explored with particular reference to neoliberalism. Linked to neoliberalism, managerialism is increasingly being adopted as a mode of governance in the public sector in many societies. Therefore, an account on managerialism and the emergence of a new institutional culture called New Public Management (NPM) is presented. As a consequence of managerialist approaches, the use of resource allocation models (RAMs) are employed to raise efficiency. An account on the characteristics of RAMs, the potential problem areas in the use of a RAM and the equity considerations in using RAMs is then presented.
CHAPTER FOUR outlines the methodological approach and methods used to gather data. A justification for combining quantitative and qualitative methods in this study is presented. A description of the survey questionnaire, trialling of the questionnaire the sampling framework and distribution of the questionnaire is outlined. An account on the interviews conducted and documents studied is then presented.
CHAPTER FIVE presents the data gathered in response to the critical questions. The questionnaire data which is largely quantitative is presented followed by the qualitative data obtained through interviews. An analysis and discussion of the interview and questionnaire data as well as the document study using the theoretical and conceptual frameworks namely, critical theory, policy analysis, neoliberalism, managerialism and RAMs is then presented.
CHAPTER SIX presents the main conclusions and the pertinent recommendations.
Conclusions are drawn on the basis of the empirical findings and the relevant recommendations are made.
16 1.12 SUMMARY
This chapter has provided an introduction and broad orientation to this study. The purpose of this study, critical questions, rationale for this study, statement of the problem and the significance of this study have been clarified. Further, key terms used in this study have been explained. The research methods employed in this study have also been described. This chapter concludes with an outline of each of the six chapters in this study.
The next chapter explores the intricacies of the policy process with regard to educator post provisioning.
CHAPTER TWO
THE INTRICACIES OF THE POLICY PROCESS: THE CASE OF EDUCATOR POST PROVISIONING
2.1 INTRODUCTION
The previous chapter outlined the background and orientation to this study. This chapter commences with a discussion of the macroeconomic Growth, Employment and Redistribution Strategy (GEAR). The GEAR’s impact on the budgetary process as well as its link to the Medium Term Expenditure Framework (MTEF) is highlighted. The financing of education in terms of overall provincial budgets as well as personnel and non-personnel expenditure trends is also explored.
A brief outline on the policy framework for schools is discussed with specific emphasis on the South African Schools Act, 84 of 1996 and the role of school governing bodies (SGBs). An account of the private financing provisions of the Act is then presented.
A study with regard to state policies on educator provisioning is then explored. The impact of ELRC Resolution 3 of 1996 as well as ELRC Resolution 6 of 1998 on educator provisioning is outlined. A discussion as well as commentary on the first nationally approved educator post distribution model as well as the revised post distribution model is presented. This chapter concludes, mainly for illustrative purposes, with an account of how the implementation of policy on educator post provisioning has unfolded in KZN in 2004.
2.2 THE MACROECONOMIC FRAMEWORK
In outlining the macroeconomic framework in South Africa, the essence of the GEAR, the RDP and the GEAR and the GEAR’s impact on education is presented.
2.2.1 THE ESSENCE OF THE GEAR
The GEAR represents the considered strategy of government to rejuvenate the South African economy within a framework of economic policies designed to provide a stable environment for long term growth and development. According to the document, the key elements of the vision of the GEAR relate to:
• A competitive fast growing economy which seeks to create jobs for all work seekers.
• The redistribution of income and opportunity in favour of the poor.
• A society in which health, education and other services are available to all, and
• An environment in which homes are secure and work places productive (South Africa. Department of Finance 1996:3).
The document points out that notwithstanding the considerable progress made since the successful democratic transition in the country in economic development, job creation, which is a primary source of income redistribution, remains inadequate. It adds that the present growth trajectory of approximately 3% per annum:
• Fails to reverse the unemployment crisis in the labour market.
• Provides inadequate resources for the necessary expansion in social service delivery; and
• Yields insufficient progress towards an equitable distribution of income and wealth (South Africa. Department of Finance 1996:1).
Consequently, the GEAR argues that in order to attain sustained growth on a higher plane, transformation towards a competitive outward orientated economy is essential. The document claims that the GEAR strategy will attain a growth rate of 6% per annum and job creation of 400 000 per annum by the year 2000 (South Africa. Department of Finance 1996:1).
Pampallis and Motala (1998:7-8) point out that the key argument of the document seems to be that high levels of growth are essential for the delivery of social services such as education and for attaining equity. They add that the GEAR asserts the need for human resource development and for the effective training of managers and workers to enhance
productivity. In keeping with Levin’s (1998:131) postulation that education is a key component of a country’s ability to improve or maintain their economic welfare; the GEAR regards education as an important determinant of long term economic performance and income redistribution. The sustained improvement of the public education system is a high priority as is the growth in student numbers and improvements in mathematics and science education.
According to Weber (2002:274), the GEAR plan hopes to reduce the budget deficit to 3%
of GDP within four years and hopes to achieve this by cutting government spending amongst others. Therefore, careful management of the overall government wage bill is central to the GEAR strategy. Affordability considerations, maintenance of public services and macroeconomic consistency are considered paramount. Right-sizing of the public service is considered key to the management of the government wage bill (South Africa. Department of Finance 1996:8). In terms of government consumption expenditure the GEAR projects the following scenario:
Table 2.1: Integrated scenario projections, 1996-2000
MODEL CHARACTERISTICS 1996 1997 1998 1999 2000 AVERAGE Real govt. consumption (% of GDP) 19.9 19.5 19.0 18.5 18.1 19.0 Real govt. investment growth 3.4 2.7 5.4 7.5 16.7 7.1 Source: South Africa. Department of Finance (1996:7)
According to Nicolaou (2001:66), from the GEAR projections it is evident that government consumption expenditure is declining making it likely that allocations to education will continue to decline in real terms, thereby implying a decrease in the wages and salaries component to civil servants. Moreover, it is evident that government investment expenditure is expected to increase dramatically especially in year 2000 to more than double. Nicolaou (2001:67) adds that these projections are only possible given a 6% growth rate. The smaller the growth rate the more detrimental the effect on the government budget and its components.
2.2.2 THE RDP AND THE GEAR
The RDP was drafted, in the main, by organisations associated with the Mass Democratic Movements (MDMs) of the country, mainly COSATU. Hence, it articulated the concerns of the masses and was aimed at addressing the needs of the previously disadvantaged people of South Africa. The RDP assigned a pivotal role to the government in that it was to play a leading and enabling role in guiding the economy and the market towards reconstruction and development. It cautioned that policies aimed purely at economic growth would accentuate existing inequalities and perpetuate mass poverty (Terreblanche 2002:108).
Terreblanche (2002:109) points out that the merits of the RDP were that it clearly and comprehensively described all the distortions and injustices that had become part of South African society during apartheid. More specifically for education it stressed the need to redress the inequalities prevalent in the education system and as such was a policy designed to attain equity.
The GEAR on the other hand was an efficiency policy drafted by economists. In essence, it was a financial strategy aimed at stimulating financial growth in the country. It represented government’s strategy to revive the South African economy. The key argument of the GEAR was that high levels of economic growth are essential for the delivery of social services such as education and the attaining of equity (Pampallis &
Motala 1998:7) In other words, equity would result as a spin-off from economic growth.
2.2.3 THE GEAR AND ITS IMPACT ON EDUCATION
The GEAR forecasts that it could create jobs and increase GDP by 6% per annum. Since the economy’s national income cannot be controlled directly by the government, the government budget becomes the only variable that can be controlled. According to Nicolaou (2001:69), if the growth rate is 3% instead of 6% then the government’s budget needs to decrease dramatically since less revenue has been generated. As the government budget declines so does state expenditure on civil service salaries, social investment etc.
She adds that in reality the annual growth rate has been declining since 1996 with only
1.7% in 1997 and 0.1% in 1998. With declining growth rates, the smaller national income implies large decreases in government expenditure. The total education budget highlights this trend. Mabe (1998:12) therefore adds that the great irony is that the GEAR document notes that progress in education is vital for economic performance, redistribution and long term transformation of this country but then simultaneously calls for a cut in government spending on education.
According to the GEAR, emphasis is placed on education reform in a context of fiscal constraint, a focus on decentralization, cost saving and cost recovery (through user fees) and a shift of financial responsibility for education from public to private sources (Vally
& Tleane 2001:180). This, according to Nicolaou (2001:68), implies that the market system, through user fees, will create an unequal educational process resulting in an elite group of highly educated individuals who attend excellent schools on the one extreme and a mass of poorly educated individuals from public schools on the other. Further, as more services are provided privately (or not at all) the exclusion principle becomes more dominant. Mabe (1998:13) adds that the problem with this is that impoverished communities do not have the means to pay. Consequently, education may become a rare commodity afforded by only the rich. Learners from disadvantaged communities will not be able to attend better and more successful schools. Therefore, the GEAR objectives will in fact increase inequality between the races, gender and provinces (Nicolaou 2001:70).
According to Mabe (1998:12), the GEAR shows many similarities to structural adjustment programmes which reversed the gains made by many African states in the immediate post colonial era. Harber (1988:248), therefore, questions the extent to which educational policy in the new South Africa reflects the educational priorities usually associated with structural adjustment programmes. He adds that countries with structural adjustment programmes have typically undergone the following educational experiences:
• Cuts in the education budget
• A decline in the value of teachers salaries
• Stagnation and reduction in teacher employment
• A slowdown in progress towards education for all
• An increase in the learner-educator ratio
• A decline in enrolment rates
• A reduction in expenditure on teaching materials such as textbooks
• A shift from public finance of education to private finance
• A decline in access for the poor (Harber 1998:248).
2.3 THE GEAR AND THE MEDIUM-TERM EXPENDITURE FRAMEWORK (MTEF)
The manner in which budgets are put together (centralized or decentralized) impacts on the autonomy of the provinces in determining their expenditure on education in general and educator personnel in particular. Hence, a discussion follows on the South African budgetary process and budgetary reform as well as a link between the GEAR and the MTEF.
2.3.1 THE SOUTH AFRICAN BUDGETARY PROCESS AND BUDGETRY REFORM
The Republic of South Africa Constitution Act, 108 of 1996, officially adopted in 1997, changed the way budgets are put together in the country. The new budget process is much more decentralized, giving provinces a greater amount of choice in determining expenditures on health, education, welfare and the public service. The new budget process is much more complicated than the old one. In the past only one budget was produced for the whole country. Now, the national government and each provincial government must produce a separate budget – a total of ten budgets instead of one (Heintz 1998:5).
The new thinking focuses on budgets as a tool or operational plan to achieve government’s stated objectives. This means that a budget should be driven at all times by substantive policy norms. The net result is that budgets are now viewed as vehicles to produce specific outputs. In South Africa, budget reform is directed by the Medium-Term Expenditure Framework (MTEF) and the Public Finance Management Act. The MTEF is simply a planning tool that enables spending agencies to project the cost of existing