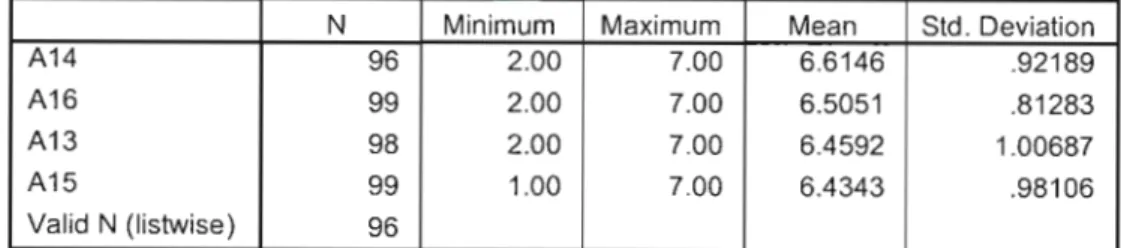
71 Table 4.9 Average satisfaction scores of customer perception - figure 71 Table 4.10 Average satisfaction scores of customer expectations for assurance 72 Table 4.11 Average satisfaction scores of customer perception for assurance. Perception Satisfaction means – upper half of differences) 76 Table 4.17 Paired T-tests (Expectation Satisfaction means vs.
INTRODUCTION
BACKGROUND OF THE RESEARCH
One of the reasons for these regulations is that smaller, independent gas stations will not be able to compete with those owned by large retail organizations. It is for this reason that their perception of the brand should be studied: their emotional connection to the brand across a spectrum of interactions with both people and tangible elements of the brand.
VALUE OF THIS PROJECT
MOTIVATION FOR THE RESEARCH
PROBLEM STATEMENT
OBJECTIVES
RESEARCH METHODOLOGY
The tolerance will also be calculated on behalf of the customer Le: the survey will build 95% confidence intervals for the population mean expectations per dimension. Hypothesis tests will then be run to test whether the population perception falls within these calculated confidence intervals.
DELIMITATIONS
ASSUMPTIONS
STRUCTURE OF THE RESEARCH
- Chapter Two - Review of the Related Literature
- Chapter Three - The Research Design and Methodology
- Chapter Four - The Data Design and Collection
- Chapter Five- Recommendations and Conclusions
Days of the week and hours of the day will be randomly selected from this set. Most questions will be measured using a likert scale, but we will also use dichotomous variables and an open-ended qualitative question.
SUMMARY
Note that these questions will be adapted from Servqual theory and from questionnaires previously designed within Caltex.
INTRODUCTION
WHAT DO WE MEAN BY SERVICE I GOODS QUALITY?
VARIOUS TECHNIQUES APPLIED IN RESEARCHING SERVICE QUALITY
These covert audits must be undertaken independently, must be objective and must be consistent. This allows a company to assess customer satisfaction, especially in relation to the contact person with whom the transaction was made.
Customers Comments
Similar Industry Studies
More Contemporary Service Quality Research
VARIOUS TECHNIQUES APPLIED IN RESEARCHING AND PROMOTING SERVICE QUALITY BY THE COMPETITORS
- Shell's customer satisfaction department strives for excellence In a global organization like Shell, customer satisfaction surveying, both
- The Proudly South African Approach by Total
Using Metrics, Shell's global customer satisfaction team builds ad hoc surveys in a fraction of the time it used to take. When it comes to analyzing survey results, "Right Now" Metrics simplifies that part of the process as well.
III Up at
This is not only empowering for individual departments, but also unleashes customer satisfaction. Although the following images are not exactly an alternative form of research, they are an indication of what the competition is doing in South Africa within the petroleum retail industry in order to reposition themselves in the mind of the customer and as such become important for the study. .
TOTAL
Various approaches in promoting Service in Singapore Petroleum
This company promotes its services strictly online as part of its overall marketing program and is listed on many search engines under the category of "petroleum customer service", one of the few players in the industry to do so. SPC's refinery located on Jurong Island is consistently ranked in the top quartile of refineries worldwide and is well positioned to benefit from growth.
AN OVERVIEW OF THE SERVQUAL MEASURING INSTRUMENT
- Service Quality as attitude
- The relationship between Service Quality and Satisfaction
- The Servqual Measuring Instrument In More Detail
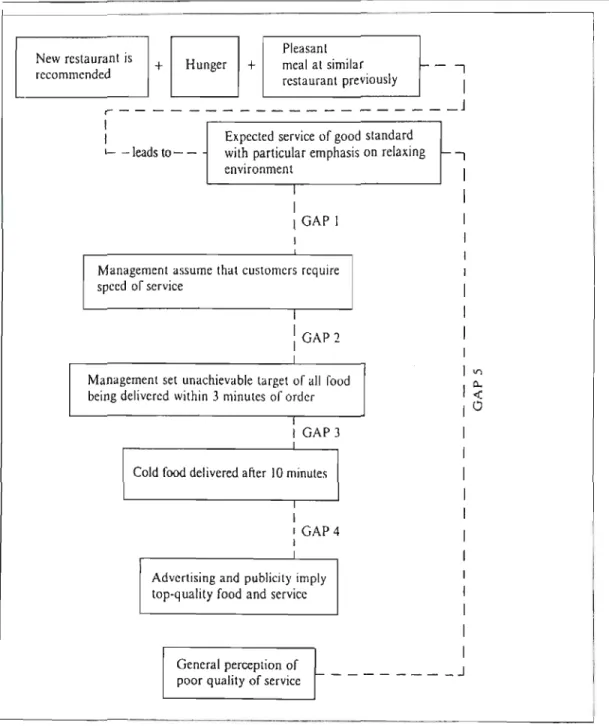
- Practical Application of the Gaps
Perceived service quality is therefore viewed as the degree and direction of discrepancy between customer perceptions and. This has led to the idea that zones of tolerance may exist in customer perceptions of service quality.
Nature of Service Expectations
According to Odayar (2003), much attention has recently been devoted to the processes by which customer expectations regarding service quality are formed. Parasuraman, Zeithaml and Berry (1993) suggested that three levels of expectations can be identified against which quality is judged; a desired level of service that reflects what the customer wants; an adequate level of service, defined as a standard that customers are willing to accept; and the predicted level of service – that which they believe is most likely to actually occur. If perceptions fall below the desired level of service, this may still be acceptable as long as it does not fall below expectations based on the appropriate level of service.
In other words, instead of a service meeting or falling short of customer quality expectations, there is an intermediate zone of tolerance (Figure 2.2).
Zone of
RELlABILTY AND VALIDITY
The advantage of using the Servqual methodology questionnaire as a template is that it has proven to be reliable and valid in the industries in which it has been used. The reliability of the measurement instrument was confirmed using Cronbach's coefficient alpha as a measure of internal consistency and as long as each dimension had an alpha value greater than 0.6. The validity of the questionnaire and the dimensions that make it up have been confirmed by factor analysis and the literature uses it to a great extent.
THE ADAPTED SERVQUAL MEASURING INSTRUMENT
Their physical facilities must be visually appealing, / Their employees must be well dressed and look neat. The appearance of the physical facilities of these companies must be in accordance with the type of services they offer. It is not realistic for customers to expect fast service from the employees of these companies.
It is unrealistic to expect these firms to have their clients' best interests at heart.
SERVQUAL A TYPICAL APPLICATION
CRITICISMS OF SERVQUAL
- Shortcomings of ServQual
- An extension of the model by Carman ( 1990)
- Managerial implications and recommendations
- Setting Quality Standards
- ISO 9001 Standard
For accurate measurements of service quality, consumer expectations should be measured before the service experience and service evaluation after patronage (Clow & Vorhies 1993). He suggests that a significant portion of the variance in the expectations scale is due to differences in question interpretations rather than variance in respondents' attitudes. These high scores on the expectancy scale are likely to result in negative P-E estimates, affecting both the diagnostic utility of the measure and its underlying conceptual interpretation (Smith 1995).
Many companies now offer compensation if certain specified services are not performed correctly.
WHY IS SERVICE QUALITY SO IMPORTANT
Industrial buyers of services are increasingly seeking assurance that their suppliers are ISO 9001 registered. Tom Peters once made the argument that you can't build a business based on customer service as a differentiator, because anyone can do it. It is very difficult, if not impossible, to replicate great customer service in an existing organization that doesn't have it.
Only with a leader who is a customer service freak can you even have a remote chance of making it.
GRAPHICAL MODEL ILLUSTRATING APPLICATION OF THE SERVICE QUALITY THEORY
It's not just the right thing to do to make your customers happy by treating them right—it's also the right thing to do for your company's bottom line.
SUMMARY
INTRODUCTION
THE PROBLEM STATEMENT
THE OBJECTIVES OF THE STUDY
THE HYPOTHESES OF THE STUDY
SAMPLE SIZE AND SAMPLING TECHNIQUE
DELIMITATIONS
ASSUMPTIONS
THE RESEARCH DESIGN AND METHODOLOGY
To further improve the reliability of the research, the questionnaire will be well designed and the interviewer will be well trained. All questions will be worded using the correct methodologies and most questions will be measured using the likeart scale. Random sampling will be applied in selecting the days of the week and times of each day.
A combination of both convenience and probability sampling will be used in selecting the sample of 20 customers per each of the nominated six service stations.
THE DATA DESIGN AND COLLECTION
- The Questionnaire as Adapted to the Petroleum Industry
Tolerance zones will also be calculated on behalf of the customer Only: the study will construct 95% confidence intervals for the population mean expectations per dimension. Hypothesis tests will then be conducted to test whether the population perception means fall within these calculated confidence intervals and to test whether different dimensions have significantly different means in expectations and perceptions. I believe that my Caltex service station must accept all forms of payment that are acceptable by law.
The data will therefore all be primary data and the authenticity of such data will be ensured by using a well-trained interviewer and obtaining "by in" from the respondents, by emphasizing the fact that truthful answers in the long run could benefit respondents.
VARIOUS TECHNIQUES APPLIED IN RESEARCHING SERVICE QUALITY AT CALTEX
PRESENT TECHNIQUES APPIED IN QUALITY CONTROL AT CALTEX
14. The screen must be clean and free of dust and oil spills. 15. Uniforms of yard staff must be clean and tidy. 20. If the garbage area is in the line of sight of customers, it must be clean, tidy and well maintained. 25. The front glass windows of the store must be clean. 26. The equipment in store C must be clean.
27.Ceiling lights in store C must work 28.00 all shelves have correct stock weight.
THE SERVAL QUESTIONAIRE AS ADAPTED TO THE PETROLEUM INDUSTRY
STATISTICAL ANALYSIS
If they are truly parallel, the correlation between them will provide an estimate of the reliability of the parallel forms of one half of the test (rather than the entire test). For example, in the case of a 30-item test, the first 15 may form one half and the last 15 may form the other half. As the number of subjects in the test increases, the total number of splits increases geometrically.
Intuitively, it makes sense to argue that the average of all these halving coefficients will provide a better estimate of the test's reliability than each individual split.
SUMMARY
A sample of customers in the Durban area were asked to complete the questionnaire and the results are presented in Chapter 4. The statistical techniques used in this analysis involve various descriptive and inferential processes, the first involving different measures of central location and spread included and numerous tables and graphs, while the inferential techniques used were the Cronbach Alpha coefficient (which helped test both reliability and validity) and confidence interval analysis.
INTRODUCTION
DATA COLLECTION
- Sample Size
- Sampling Technique
STATEMENT OF RESULTS The statement of results follows
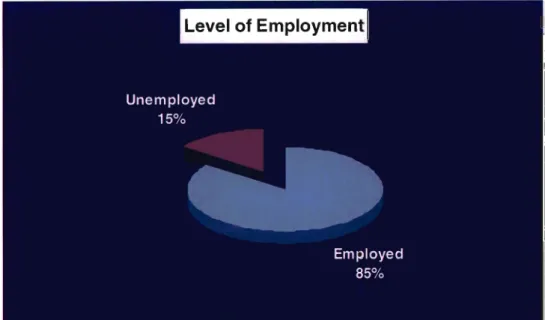
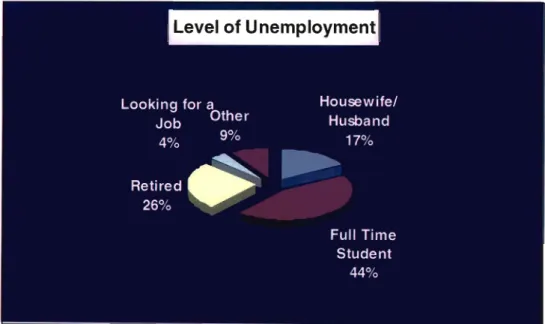
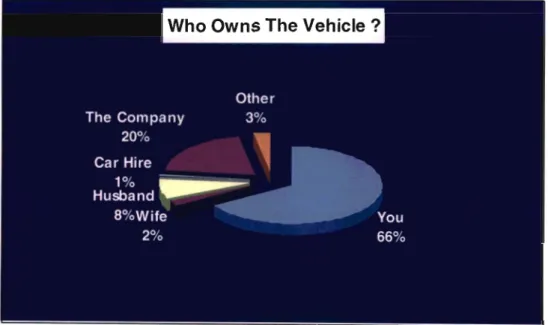
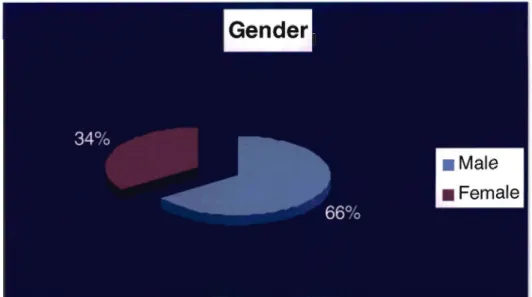
Once again only 4% of respondents were actively looking for work, again reflecting the LSM band in this area. Due to the high level of employment in the sample group, 86% of respondents owned their own vehicle or the vehicle was company owned. Unemployment was only 15%, with most unemployed people being housewives, full-time students or retirees.
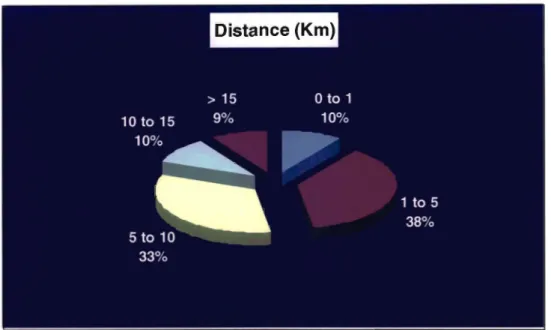
81 % of the sample group lives within 10 km of the service station, which enforces the belief that location and convenience are important factors for the customers when.
Gap Analysis (Expectation
Perception)
0.77 Question 6 = 0.67
- INTERNAL CONSISTENCY METHOD
- INTRODUCTION
- RELAIBILlTY AND VALIDITY OF MEASURING INSTRUMENT The Servqual measuring instrument as adapted to the petroleum industry
- GENERAL STATISTICAL INFORMATION
- RESPONSIVENESS
- SECURITY
- IMAGE
- ASSURANCE
- EMPATHY
- RELlABILTV
- SUMMARY
This employee should be viewed as a "Forecourt Relations Officer", a marketing representative of the gas station rather than a CSA. Once again, service is the point of differentiation in the petrol station industry in South Africa. If you believe that the characteristics mentioned in each statement are essential to your assessment of a gas station, please circle 7.
Strongly disagree Strongly agree (1) An excellent service station must have a nice appearance 1..2.. 7 of Forpladsen, at an excellent service station. 7 layout of the convenience store at an excellent service station. uniform, name tags, grooming, etc. 7 (10) An excellent service station will provide prompt service Staff at an excellent service station will always be willing 1..2.. 7 will instill confidence in a client.