Obstacles to entering the role of 'producer' are mainly in the ownership of knowledge and in the capital-intensive nature of the production process. So if the company's strategic intent is long-term improvement (either process, product, or functionality), then WCM's focus on lean and eliminating all waste is considered within those long-term goals, with the accompanying recognition that cutting all costs at all costs does not necessarily pave the way. to sustainable long-term growth (Brown Bessant, 1995: 4).
South Africa: Human Resources in Relation to Value Chain Trajectories
- Management and Labour: Issues of Trust
- Skills in the South African National Economy
- Training
- Conclusion
As a result, the picture is mixed, particularly in terms of the impact of the current state of human resources in South Africa on the course of the value chain. This was used due to the small numbers included in each of the subgroups. The validity of proxy measures for dependent and independent variables is well established in the literature (Bames, 2001: 66).
For example, section 4.1 presents the results of analyzes of the Human Resource Input/Management Commitment Indicators;
METHODOLOGy
Choice of the Study Population
- History and Current Situation of the South African Automotive Sector
The development of the automotive value chain in South Africa dates back to the 1920s, when Ford and General Motors established local assembly plants in anticipation of policies of tariff barriers and import permits. The realization of these policies resulted in the establishment of the first local component manufacturers, which predominantly took care of the aftermarket for these vehicles. In 2000, five out of the seven MNCs were owned and two were operated through joint ventures.
For the purposes of the statistical analyzes required for this study, all relevant data from the Benchmarking Club was transferred into SPSS.
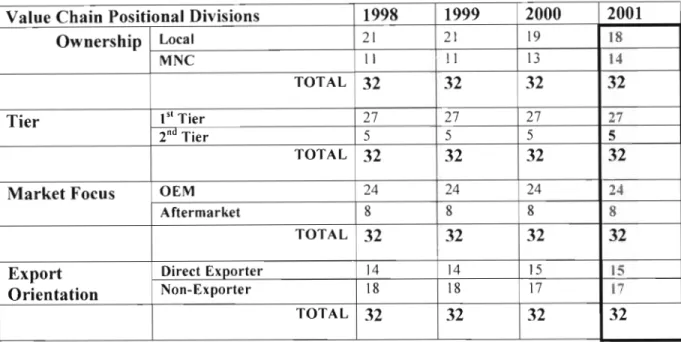
Independent Variables: Value Chain Positional Indicators
This puzzling lack of balance was kept in mind in analyzes of the findings. The statistical significance of the year 2001 difference was p=O.OO 1, while for the historical analyzes it was 0.000. Regarding the first of the research questions posed for this thesis, whether there is an element of value chain positional dependence in commitment to HR upgrading, a factor often discussed in the literature as an independent variable, this supports research a positive response.
This chapter briefly discussed the main findings of this research in light of the existing literature on the SA automotive value chain and with reference to the local historical and current contexts of human resource and skills development in the country.
Dependent Variables: Human Resources and Economic Indicators
- Human Resource Indicators
- Economic Indicators
Validity and Reliability
The reliability of the human resources and financial indicators is established through the fact that these measurements are well-defined and well-known in global best-practice production and business literature (Brown, 1996). Since no previous attempts to classify companies in this way could be found in the literature, definitions of the various classifications were determined through consensus among the staff of the benchmarking clubs and have been described in. However, in future studies it can be stated that problems of joint ownership will come in question, or it may be considered better to set the export requirement at a value other than the 10% of output chosen for use in this study.
Thus, the assignment of the various variables of the value chain position indicator to Finns was made as transparent as possible, being aware that somewhat arbitrary decisions have to be made and that future studies may decide to redefine some of these categories.
Limitations of the Study
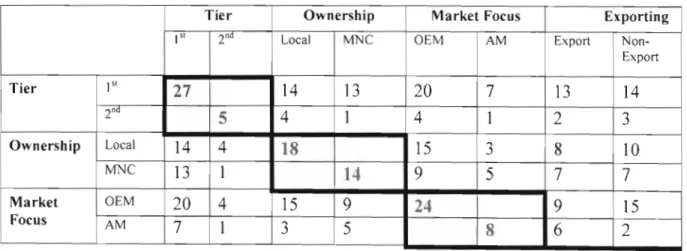
This chapter presents the results of the analysis of data from the 32 firms belonging to the KZN, Eastern Cape and Gauteng Benchmarking Clubs at the end of 2001. Despite the fact that none of the differences for the static 2001 subgroup comparisons were statistically significant, it is noteworthy that MNC-owned firms, 1 SI level suppliers, aftermarket-focused firms, and exporting firms showed the lower absenteeism rates in each of their groups ( figure 4.5). Although none of the differences were statistically significant in 2001, it is notable that locally owned companies, 2nd Tier suppliers, OEM-focused companies and non-exporters had shown higher revenue growth than their opposite subgroup categories (Figure 4.27), with 2nd Tier suppliers , showing the greatest improvement.
Unfortunately, information for one of the management engagement indicators (the number of formal days of off-line training per employee) and both indicators of "seen" skills (% literacy) did not allow such a historical trend analysis.
RESEARCH FINDINGS
Human Resource Input/Management Commitment Indicators
- Spending on Training as a % of Remuneration
- Days of Formal Off-Line Training per Employee
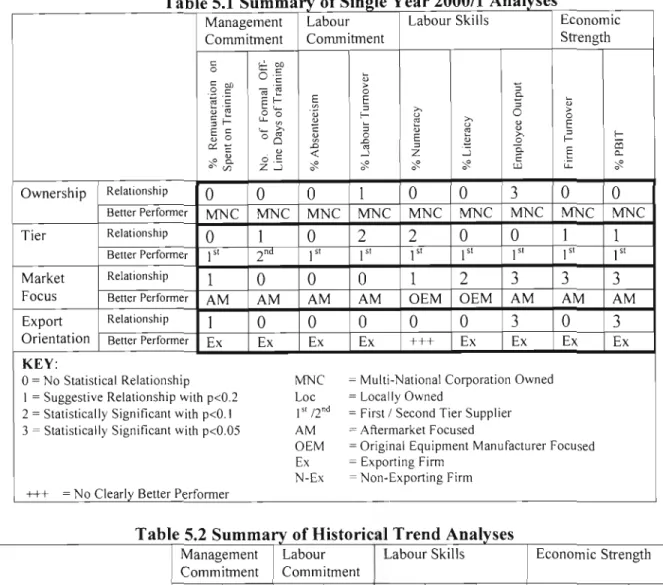
For the group as a whole, an average of 1.78% of pay was spent on training in 2000, the latest year for which most companies provided data (see Figure 4.1). An analysis of historical trends in training spending as a % of pay further supported these static findings from 2000. While there were no clear correlations for ownership and level, aftermarket-focused companies consistently outperformed OEM-focused companies, with statistically suggestive p = 0.187 (Figure 4.2), while exporting firms significantly outperformed non-exporting firms with p = 0.021 (Figure 4.3).
Thus, the performance of the subgroups of MNC owned (2.7 days), Aftermarket focused (3.2 days) and exporter firms (2.5 days) outperformed the subgroups of Locally owned (1.7 days), OEM -focused (1.8 days) and Non-Exporting Firms (1.9 days).
Labour Commitment Indicators
- Employee Output
As can be seen above, the differences for the Market Focus and Export Orientation subgroups were supported by historical trend analysis with a significance level of p=O.08 for the former (see Figure 4.6), and a statistically suggestive p=O.l72 for the latter (Figure 4.7). Historical analysis of labor turnover data from 1999 to 2001 supported the static 2001 analysis by revealing that MNC-owned companies, 1st Tier suppliers and aftermarket-focused companies performed better with lower labor turnover rates in all three years than locally owned companies (Figure 4.9) , 2nd Tier suppliers (Figure 4.10) and OEM-focused companies (Figure 4.11). Average literacy levels for the entire population of companies was 79.95% (Figure 4.12), but the subgroups that performed better were MNC-owned companies, 1 sI Tier suppliers, OEM-focused companies and exporting companies.
For the population of firms as a whole, an average rate of 7l.74% numeracy among the workforce was reported (Figure 4.13).
Economic Indicators
- Firm Monetary Turnover
- Turnover Growth
The 2001 static analysis shows that first-level suppliers, with an annual turnover of Rmil 125, have significantly higher turnover (p=0.174) than second-level suppliers, with an annual turnover of Rmil 64. The differences for market focus and export orientation were statistically significant in both the static and historical 2001 analyses, with aftermarket and exporter firms outperforming their counterparts (Figures 4.25 and 4.26). For exporters, the average turnover in 2001 was Rmil 186, while for non-exporters it was Rmil 63.
Despite the fact that companies owned by multinationals, 1 si Tier suppliers, aftermarket-oriented companies and exporters generated more revenue than their counterparts in terms of real sales, the direct opposite was true for indexed sales growth (1998=100).
Conclusion
Do firms subject to similar sectoral pressures demonstrate different levels of commitment to improving human resources according to the different value chain positions they occupy. In other words, is there an element of value chain positional dependence in the commitment to HR improvement, a factor which is often discussed in the literature as an independent variable. To what extent such value chain positional differences, if any, can be explained by the framework of value chain analysis, which raises political economy pressures within sectors, and as such opportunities and constraints for improvement.
The findings presented in Chapter 4 show a striking consistency in the 'positions' of the more successful subgroups, a summary of which is presented in Table 5.1 and Table 5.2 below.
Summary of the Key Findings and Potential Value Chain / Political
- Relating to Ownership
Broadly, however, the results of the historical analysis support the single-year 2000/1 findings, with MNC-owned, 1st-tier suppliers, aftermarket-focused and exporting firms consistently outperforming. The following sections will take a more in-depth look at each of the value chain positional sections (except in terms of turnover growth, which will be treated in Section 5.2) and attempt to summarize the findings in relation to the political economy factors of the value chain in which these firms function. An initial expectation using the VC approach suggested that OEM-focused firms, which are closer to the 'driver' of the chain, would show superiority in terms of both HR inputs and outputs.
This suggests that the situation in terms of awareness of the problem is likely to be even worse outside of cluster monitoring schemes such as the benchmarking clubs.
Specifically Addressing the Research Questions
Fourth, it was extremely interesting to note that AM-focused firms managed to command a steady decline in absenteeism levels in the face of rapidly increasing national absenteeism levels due to the country's growing HIV/AIDS epidemic (Whiteside, 2002). ) and despite having the workforce with the lowest levels of literacy and the second lowest level of numeracy. This suggests very strongly that current high rates of absenteeism may not be due to HIV/AIDS alone, and that while such actual absenteeism will inevitably continue to increase, a resulting reduction in absenteeism from job dissatisfaction can help reduce the economic impact of the epidemic. While this is positive in the sense that it suggests that rapid growth is possible for firms with lower levels of value chain pressures if they demonstrate some proactivity with regard to improvement and improvement, it also suggests caution that if growth and commitment have not been gradually channeled more towards the development of conditions for sustainability, i.e.
However, it is worth noting that second-tier supplier and AM-focused companies are relatively underrepresented, and such underrepresentation may be due to lower pressure from the key drivers of the chain, the OEMs.
Conclusion
Therefore, the issue of dependence that is so suggestive in this research seems to be more about the reactive upgrading of human resources: the response of companies to the pressures of the political economy of the value chains in which they operate. The value chain analysis framework promises to help identify realistic long-term upgrading strategies by understanding the various opportunities and constraints associated with the 'mode of integration' of firms and national economies into global production chains. On the other side of the scale, the human resource and organizational development literature argues that commitment to human resource development is the most important component of the long-term survival and growth of a firm and the national economy.
Bames, J., 2001, World-class manufacturing as a necessary but insufficient condition for industrial success: A case study of the South African automotive parts industry, PhD.
CONCLUSION & POLICY RECOMMENDATIONS
BIBLIOGRAPHY