Unique cellular responses to the presence of the replicative gene expression technology were also observed. This led to the transmission of a 'softer' form of the disease, and the development of immunity.
The Immune system – The author of immunity
This in turn induces activation of the interphase centromere damage response (iCDR) pathway (Gross et al., 2012). Cytomegalovirus, for example, inactivates IFI16 before the second phase of CMV infection begins (Diner et al., 2016).
Viral infections – Chronic viruses and those difficult to vaccinate
28 stopped prematurely due to ineffectiveness and demonstrated a possible increased likelihood of HIV infection in some patients who had immunity to AD5 (Buchbinder et al., 2008; Sekaly, 2008). Their use to generate this type of immunity is therefore a viable design strategy for the development of novel rational vaccine design (Jia et al., 2011; Williamson and Swanstrom, 2015).
Vaccinology in our modern world
However, these new methods are often expensive and do not provide the desired levels of improvement that are technically necessary (Hu et al., 2016). Their distribution greatly affects their immunogenicity, especially in large animals and humans (Bai et al., 2017; Dupuis et al., 2000).
Aims and objectives
Skeletal muscle myoblasts and myocytes have been shown to have intrinsic antigen-presenting cell (APC) capabilities under these conditions as well as the ability to respond to and endogenously produce a variety of cytokines and chemokines. They have been shown to express Toll-like receptors as well as both classes of major histocompatibility complexes (MHCI and MHCII).
Hypotheses
The cell morphology of the RCR+ cells also appears to be different, especially in the most fluorescent cells. It is therefore difficult to evaluate the rate of the compound amplification effect created by the RCR cycle.
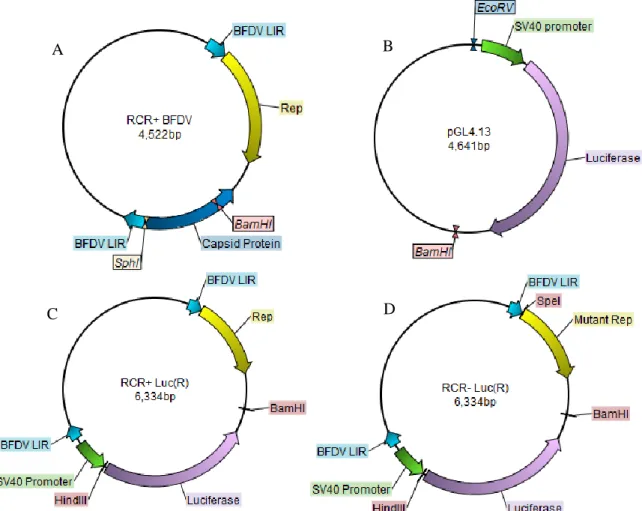
Development of a Rolling Circle Replication Expression System
Materials and methods
All restriction endonuclease digestions used endonucleases supplied by Thermofisher (USA) or New England Biolabs (USA) according to the manufacturer's instructions. The linearized DNA was then subcloned into the CloneJET PCR cloning kit (Thermofisher Scientific) according to the manufacturer's instructions.
Results
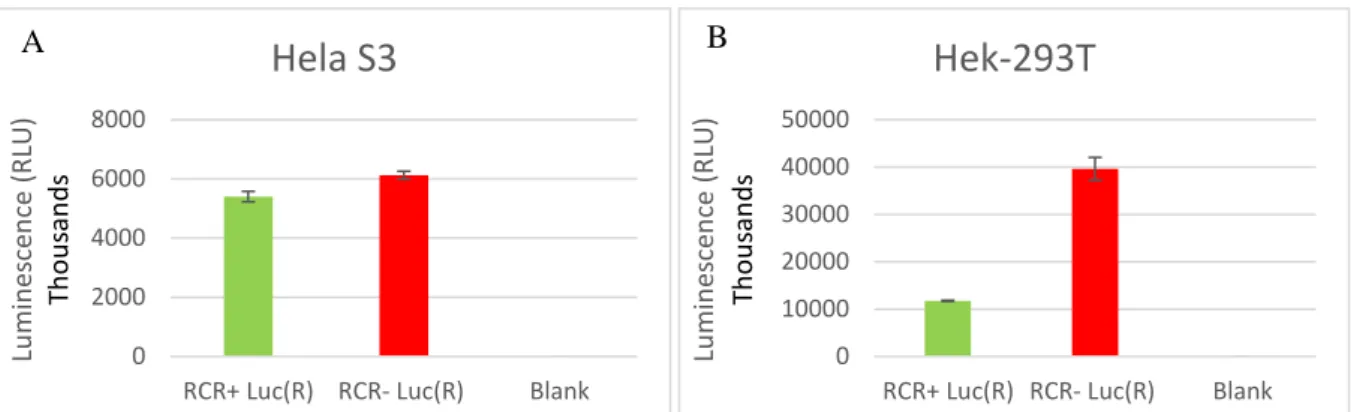
For transient expression of Rep in trans, pTHRep was co-transfected with the RCR mutation plasmid (Figure 2.7:A-B) in HEK-293T cells. The RCR-Luc(F) vector was co-transfected with rep and luciferase activity as measured by relative luminescence units (RLU) estimation (Figure 2.10). Combinations of the pTHRep vector with the inducible RCR vectors, namely RCR-Luc(F) and RCR-Luc ∆SV40, resulted in a very significant decrease in luminescence (Figure 2.12) (purple and light blue), as previously shown (Figures .
The RCR+ Luc(F) replicating vector consistently produced a luminescence readout of approximately 12-18% of that obtained by the non-replicating RCR-Luc(F) vector in all cell lines tested (Figure 2.14). The expression cassette insert was then excised from the pGL4.13 vector using EcoRV and BamHI (Figure 2.15:B).
Discussion
A pure population could very well be cultivated longer; however, the growth rate of the RCR+. Cells were transfected with either 1.0 µg, 0.5 µg or 0.25 µg DNA per well of the RCR- and RCR+ Gag expression vectors. Among the cellular changes detected in flow cytometry, the significant changes in internal cellular granularity for the RCR+ samples are of interest.
The direct observation of the overall increase in the proportion of cells showing relatively high fluorescence of RFU for the RCR+. It is known to be one of the most potent chemoattractant molecules and is an important stimulant of the innate immune response (Oliveira et al., 2019).
Characterization and quantification of RCR gene expression technology
Materials and methods
Fluorescence-activated cell sorting (FACS) flow cytometry was used to sort, count, and quantify HeLa S3 fluorescence and cell morphology. Data were collected using BD FACS Diva v6.0 software and subsequent analysis in FlowJo v10.5.0 under Africa Free License. Fluorescence-positive cells were identified using the merged-channel image data and (independently) carefully labeled with a patch contour tool, e.g.
Zen Blue software was then used to calculate the mean eGFP fluorescence level per positively identified cell. Densitometric analysis of bands was performed in imaging lab 5.2.1 using the same HIV-1C Gag mosaic gene expressed in MVA as a positive control and as the reference band required for densitometry.
Results
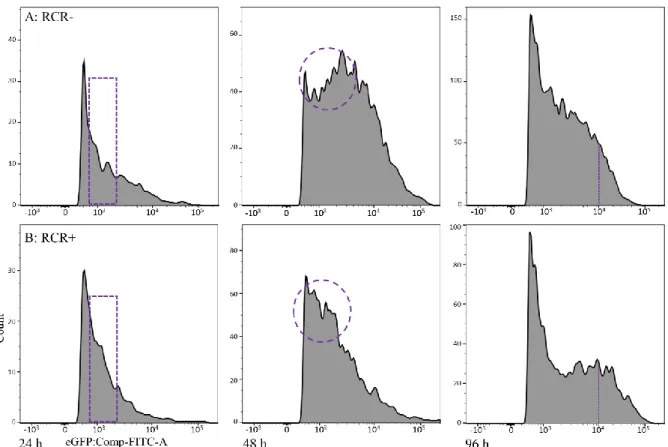
Flow cytometry experiments were set up to evaluate the expression profile and cellular characteristics at 24 h, 48 h and 96 h using HeLa S3 cells transfected with the RCR+ and RCR-eGFP variant expression vectors (Appendix A4). It is also noted that transfection efficiency between the RCR+ and RCR-eGFP vectors was tested (data not shown) and was highly consistent. While still a relatively small proportion of total cells, this population appears to be three times greater for the RCR+ transfected cells at a pt of 96 hours than for the RCR transfected cells.
To evaluate the nature of the differences between the RCR+ and RCR- transfected cells, data were collected from flow cytometry for Q2 fluorescent positive populations (Figure 3.3) and plotted as a series of sets of histograms for analysis (Figures 3.4-3.6). For the RCR+ sample, however, there appears to be a shift to the right and the expansion occurs earlier, at 48 hours as of now.
Discussion
This analysis helped to detect the divergent nature of the differences caused by the replicating vector effects. As far as I could determine, there is no suitable statistical model that can account for this fundamental change in the nature of the RKR vector. These numbers also effectively demonstrate the effectiveness of the RCR amplification process to achieve potent and constitutive intracellular change.
Exploitation of the internal cellular changes that occur during this time and ultimately hinder the progression of normal S phase (Cheung, 2012; Laufs et al., 1995; Palmer and Rybicki, 1998). This led to more accurate quantification and determination of the effects of RCR on eGFP expression at 24 h pt.
Conclusions
It is known to be involved as part of the innate immune response to various RNA viruses and DNA viruses (including smallpox viruses). This directly implies the RCR, DNA replication process itself with the enhanced activation of the type I and II interferon response pathways (Verhelst et al., 2012). In the case of PCV, its promoter has been demonstrated to exhibit expression enhancing activity when placed upstream of the CMV Enhancer/promoter sequence (Tanzer et al., 2011).
Beyond the Myths: New Findings for Old Paradigms in Smallpox Vaccine History. Dual ATPase and GTPase activity of the replication-associated protein (Rep) of the beak and feather disease virus.
Testing RCR expression and antiviral response in Balb/cJ mice
Materials and Methods
Each mouse received a single 50 µl inoculation into the anterior tibialis muscle of the right hind leg on day 0. Then, their spleens and the anterior tibialis muscle at the inoculation site were harvested, placed in RPMI media, and placed on ice. A cut-off threshold of 2σ from the mean of the negative control was used to eliminate background and autofluorescence, and this was applied to all images.
Because this normalization method was used, it also helped to justify lowering the cutoff threshold from the standard 2.0-fold to 1.5-fold. Data normalization is performed automatically when analyzing the Qiagen MS Excel template for batch data analysis.
Results
This analysis indicated that the RCR-eGFP sample had a mean eGFP fluorescence level in affected muscle fiber bundles that was 129 +/-5% brighter than the background/autofluorescence level. Only samples that had been inoculated with both the RCR+ eGFP and pTHRep vectors showed such high extremes in fluorescent levels. These bright outliers account for the increased margin of error overall for RCR+ eGFP and RCR+ eGFP with pTHRep samples.
Tissue samples inoculated with the RCR-eGFP vector had visibly more eGFP fluorescence than the negative control. Several differences in gene expression profile were identified when comparing the RCR+ and RCR-Gag expression vectors.
Discussion
It has been shown to be secreted by various types of immune cells and especially by activated CD8+ T cells ( Cocchi et al., 1995 ; Zapata et al., 2016 ). This regulatory factor is proinflammatory in nature and has been directly linked to Toll-like receptor stimulation (Ren et al., 2014). Therefore, repression of CASP10 by Rep appears to be a viral defense mechanism against the innate apoptotic defense pathway (Fan et al., 2005; Wang et al., 2001).
NF-κB is also directly involved in B and T cell activation and is known to help regulate immune responses to infections and inflammation (Zhang et al., 2017). Necrosis begins with a process known as oncosis, which involves cellular swelling and ends in karyolysis of the nucleus (Galluzzi et al., 2016; Li and Chen, 2018).
Conclusions
This experiment showed that an addition of the SV40 promoter is not required to use this technology and the activation of RCR can be used to simultaneously activate gene expression from an input plasmid (Figure B2). Specific functions of the Rep and Rep' proteins of porcine circovirus during copy release and rolling circle DNA replication. Comparison of the Structures of Three Circoviruses: Chicken Anemia Virus, Porcine Circovirus Type 2 and Beak and Feather Disease Virus.
Interaction of the replication proteins and the capsid protein of porcine circovirus types 1 and 2 with host proteins. The DNA immunization site determines the level of gene expression and the extent, but not the type, of the immune response induced.
Final discussion and conclusions
Recommended future work
Furthermore, the dosage may have been too low and weak for RCR to initiate and develop a strong effect in the limited duration of the study. Statistical formula definitions adapted from the FlowJo documentation: Mean = The arithmetic mean; Median = Relative value of the 50th percentile (the median is a more robust estimator of a population's central tendency). Safety of immunization during pregnancy: a review of the evidence for selected inactivated and live attenuated vaccines.
Molecular mechanisms of iron metabolism and transport in normal and neoplastic cells. Molecular analysis and associated pathology of beak and feather disease virus isolated in Italy from young African Congo gray parrots (Psittacus erithacus) with a "peracute atypical form" of the disease.