Developing antibodies against Plasmodium lactate dehydrogenase, glyceraldehyde-3-phosphate dehydrogenase and phosphoethanolamine-N-
methyltransferase
by
Robert Gerd Erich Krause MSc. (cum laude) Biochemistry
Submitted in fulfilment of the academic requirements for the degree of Philosophy of Science in the School of Biochemistry, Microbiology and Genetics
University of KwaZulu-Natal Pietermaritzburg
As the candidate’s supervisor I have approved this thesis for submission.
Signed: _______________ Name: Prof. J.P.D. Goldring Date:______________
i Abstract
Rapid diagnostic tests (RDTs) function in a diagnostic niche, linking point of care diagnosis with sophisticated lab-based methods tracking drug resistance. As ambitions move from malaria control to eradication, diagnosis is needed to identify the species causing disease, detect asymptomatic reservoirs and quantitate parasite loads. The latter is important to improve treatment dose and duration as well as preventing the spread of drug resistance.
Multiple groups are developing alternate diagnostic methods; however improving RDTs would allow easier in situ implementation due to the popularity of these tests. This work aimed to identify alternate diagnostic targets and antibodies to those currently used in RDTs.
The current RDT target, lactate dehydrogenase (LDH), was included for comparative purposes. Two metabolic proteins were identified as potential diagnostic targets, namely glyceraldehyde-3-phosphate dehydrogenase (GAPDH) and phosphoethanolamine-N- methyltransferase (PMT). The latter, like the other RDT target histidine rich protein 2 (Hrp2), is a plasmodial protein that is not expressed in humans. GAPDH and PMT were chosen based on in silico data suggesting higher transcript and protein concentrations in infected red blood cells in comparison to LDH. Both proteins are expressed throughout the red blood cell and gametocyte stages of the parasite life cycle and are conserved in the three most malignant species, Plasmodium falciparum, P. vivax and P. knowlesi. The P. falciparum orthologue (among others) of each of the target proteins was recombinantly expressed, affinity purified and their quaternary structure assessed by molecular exclusion chromatography. LDH formed a 145 kilo Dalton (kD) tetramer in solution, which resolved as a 35 kD protein on reducing SDS-PAGE and was shown to be enzymatically active. Similarly GAPDH formed a tetramer in solution of 148 kD and was identified as a 38 kD monomer on SDS-PAGE. PMT remained as a monomer in solution of approximately 29 kD, similar to its reduced form on SDS-PAGE.
These recombinant proteins had similar quarternary structures to their native counterparts and formed the basis of the tests characterising all the antibodies prepared and described here.
A peptide common to all Plasmodium PMT proteins (LENNQYTDEGVK) and peptides unique for P. falciparum GAPDH (ADGFLLIGEKKVSVFA), P. falciparum PMT (EVEHKYLHENKE), P. vivax PMT (VYSIKEYNSLKD) and P. knowlesi PMT (LYPTDEYNSLKD) were identified and synthesized. Chicken antibodies were raised against each peptide coupled to a rabbit albumin carrier protein and against purified recombinant PMT and GAPDH. Antibodies raised against the whole recombinant proteins were coupled to
ii HRPO and used as detection reagents in western blots and ELISAs. All antibodies detected only the Plasmodium parent proteins and did not cross react with human red blood cell, other malarial parasite or E. coli lysate proteins. Antibodies raised against the whole recombinant proteins and against unique and common peptides within these proteins detected all recombinant Plasmodium proteins tested. The species-specific anti-peptide antibodies detected only their specific Plasmodium protein orthologs. The antibodies detected each of the P. falciparum orthologs in parasite lysate samples by western blot. Detection of the respective recombinant proteins LDH and GAPDH in a double antibody sandwich ELISA assay, which mimics the RDT format, detected both proteins between 0.0004 to 1.5 µg.
Single chain fragment variable (scFv) antibody clones were isolated against all three target proteins using the Nkuku® chicken scFv library. Polyclonal chicken antibodies specific to the cmyc peptide tag on the soluble scFvs were also produced and used to detect and purify soluble scFvs. The scFv clones detected their targets and did not cross react with human red cell or E. coli host cell proteins. Five distinct scFv clones were identified against rPfLDH, three against rPfGAPDH and one against the P. vivax PMT peptide epitope. These reagents represent unique antibody variable-gene regions which can be expressed for the detection of the specific target they detect. A human anti-malaria antibody pool obtained from malaria patients was assessed for the presence of specific antibodies against the three target proteins.
Lower yields of specific human antibodies against P. falciparum GAPDH and PMT were attained from the pool in comparison to P. falciparum LDH. This suggests that there are low titres of host antibodies against these proteins which are therefore unlikely to interfere with antibody-based detection of P. falciparum GAPDH or PMT in the blood of patients in a malaria endemic area.
The chicken antibodies as well as the scFv clones need to be further characterised to determine their limits of detection. The concentration of each of the target proteins in parasite lysates needs to be determined in relation to LDH. The scFv expression and purification needs to be optimised further and all these reagents need to be tested in an ELISA and RDT format. The heat stability of these reagents should also be assessed. We propose the use of multiple test lines on RDTs to allow semi-quantitative detection of the parasite burden in patients. This could allow for discerning between mild and severe infections and aid with the dose and duration of anti-malarial drug treatment. These novel targets and immune-reagents present malaria diagnostic research with alternatives to the current targets and could allow for improved RDT based tests in the future.
iii Graphical Abstract
iv Preface
The experimental work described in this thesis was carried out in the Discipline of Biochemistry, School of Biochemistry, Microbiology and Genetics, University of KwaZulu- Natal, Pietermaritzburg from July 2012 to April 2016 under the supervision of Prof. J.P.D.
Goldring.
These studies represent original work by the author and have not otherwise been submitted in any form to another University. Where use has been made of the work by other authors it has been duly acknowledged in the text.
Signed:
_______________
Date:
_______________
v Faculty of Science and Agriculture
Declaration of Plagiarism
I, Robert Gerd Erich Krause declare that:
1. The research reported in this thesis, except where otherwise indicated, is my original research.
2. This thesis has not been submitted for any degree or examination at any other university.
3. This thesis does not contain other persons’ data, pictures, graphs or other information, unless specifically acknowledged as being sourced from other persons.
4. This thesis does not contain other persons' writing, unless specifically acknowledged as being sourced from other researchers. Where other written sources have been quoted, then:
a. Their words have been re-written but the general information attributed to them has been referenced
b. Where their exact words have been used, then their writing has been placed in italics and inside quotation marks, and referenced.
5. This thesis does not contain text, graphics or tables copied and pasted from the Internet, unless specifically acknowledged, and the source being detailed in the thesis and in the References sections.
Signed:
_______________
Date:
_______________
Declaration Plagiarism 22/05/08 FHDR Approved
vi Acknowledgements
Science…
“Don’t get excited unless it’s in triplicate.”
“The experiment works…until I included all controls”
“The plan is to do A, B, C and end at D…we started with A, had to include 1, 2 and 3, revised B and C and ended at D, although future work should include…”
Science is exciting yet humbling at the same time. It tests your patience and teaches perseverance. If you don’t pay attention it will confuse and mislead you. If you do it right, there’s nothing else like it!
The list of people to thank for this thesis is too long to mention. I would like to thank Professor Goldring, my supervisor, for all his support, mentoring, patience and criticism, especially throughout my postgraduate studies. I would like to thank all the lecturers and administrative staff of the department as well as the support staff. Thank you to all my fellow lab-members and all the journal clubs, shut up and writes and fun runs along the way.
Thank you to the South African Malaria Initiative, the National Research Foundation of South Africa, the Medical Research Council and the University of KwaZulu-Natal for their financial assistance, without which my postgraduate studies would not have been possible.
I would like to thank my friends, family and loved ones, but above all I would like to dedicate this thesis to my parents and my brother. “Ich hab euch lieb und danke für Alles!”
“Aanhouer wen!”
Danket dem Herrn denn Er ist freundlich und Seine Güte währet ewiglich!
Amen.
vii Contents
Abstract ... i
Graphical Abstract ... iii
Preface ... iv
Declaration of Plagiarism ... v
Acknowledgements ... vi
Contents... vii
List of Tables ... xiv
List of Figures ... xv
Abbreviations and symbols ... xviii
Chapter 1 ... 1
Introduction and literature review ... 1
1.1. An overview of malaria focused on diagnosis ... 1
1.1.1 Importance of diagnosis ... 1
1.1.2 Which species infect humans and differences in treatment? ... 1
1.1.3 Brief life cycle description ... 2
1.1.4 When do symptoms appear and what is the diagnostic window? ... 4
1.1.5 The importance of diagnosis to prevent spread of resistance ... 6
1.1.6 Complicated malaria infections ... 7
1.2. Malaria control to date and the setting of diagnosis... 8
1.2.1 The importance of the malaria pool and the need for more sensitive diagnosis 12 1.2.2 Entomologic inoculation rate ... 12
1.2.3 Insecticide resistance ... 13
1.3. The stages of the malaria life cycle targeted for diagnosis ... 13
1.4. Methods to diagnose malaria... 14
1.4.1 Clinical diagnosis of malaria ... 15
1.4.2 Serodiagnosis of malaria ... 15
viii
1.4.3 Spectral analyses of malaria infections ... 16
1.4.4 Haemozoin based detection of malaria ... 17
1.4.5 Microscopic detection of malaria... 19
1.4.6 Antigen detection methods ... 21
1.4.7 PCR based methods for malaria detection ... 21
1.5. Molecular targets for malaria diagnosis and laboratory-based detection ... 22
1.5.1 Molecular targets for the diagnosis of malaria infection ... 22
1.5.2 Targets for transmission studies... 25
1.6. Methods and targets used to detect drug resistant strains ... 27
1.7. The diagnostic niche of RDTs ... 27
1.8. The aims and objectives of the current study. ... 28
___________________________________________________________________________ Chapter 2 ... 30
Materials and Methods ... 30
2.1 Introduction ... 30
2.2 Equipment ... 30
2.2 General molecular biology methods ... 31
2.2.1 Reagents ... 31
2.2.2 Bradford protein determinations ... 31
2.2.3 Sodium dodecyl sulphate polyacrylamide gel electrophoresis (SDS-PAGE) ... 32
2.2.4 Molecular exclusion chromatography (MEC) using the ÄKTA Prime Plus system ………34
2.2.5 Colony Polymerase Chain Reaction (PCR) ... 34
2.2.6 Plasmid isolation ... 35
2.2.7 Agarose gel electrophoresis ... 36
2.2.8 Sequencing ... 36
2.3 General immunochemical techniques ... 37
ix
2.3.1 Reagents ... 37
2.3.2 Western blotting ... 37
2.3.3. Direct ELISA method ... 38
2.4 Bioinformatics (Chapter 3)... 39
2.4.1 Identifying malaria protein targets for diagnosis ... 39
2.4.2 Sequence alignments ... 39
2.4.3 Predict7TM ... 39
2.4.4 3D modelling………..39
2.4.5 Sequencing (see section 2.2.8) ... 40
2.5 Recombinant work with malarial proteins (Chapter 4) ... 40
2.5.1 Reagents ... 40
2.5.2 Expression host E. coli ... 40
2.5.3 Expression vectors ... 40
2.5.4 Transformation of E. coli BL21(DE3) host ... 44
2.5.5 Expression of recombinant malarial proteins ... 44
2.5.6 Affinity purification ... 45
2.5.7 SDS-PAGE analysis, dialysis and storage of recombinant proteins ... 46
2.6 Raising antibodies (Chapter 5) ... 46
2.6.1 Reagents ... 46
2.6.2 Peptide synthesis ... 47
2.6.3 Coupling peptides to rabbit albumin ... 47
2.6.4 Chicken immunisation………49
2.6.5 Isolation of crude IgY from chicken egg yolk ... 49
2.6.6 Preparation of affinity matrices ... 50
2.6.7 IgY affinity purification ... 52
2.6.8 Human IgG affinity purification ... 52
2.6.9 Conjugation of horse radish peroxidase to IgY antibodies ... 52
x
2.6.10 Enhanced chemiluminescence ... 53
2.6.11. Double antibody sandwich ELISA method ... 53
2.7 ScFv work (Chapter 6) ... 54
2.7.1 Reagents ... 54
2.7.2 E. coli hosts ... 54
2.7.3 Helper phage ... 54
2.7.4 pHEN1 vector ... 55
2.7.5 Library preparation ... 55
2.7.6 Panning the Nkuku® library ... 59
2.7.7 Polyclonal ELISA to determine phagemid enrichment against target molecules ………61
2.7.8 Picking single scFv clones ... 61
2.7.9 Preparation of scFv clone glycerol stocks ... 62
2.7.10 Transduction of E. coli expression host, Top10 ... 62
2.7.11 Soluble expression of scFvs from Top10 E. coli ... 63
2.7.12 Periplasmic isolation of soluble scFv antibodies ... 63
2.7.13 Restriction digest ... 63
2.7.14 Nested PCR ... 64
___________________________________________________________________________ Chapter 3 ... 65
Search for possible new Plasmodium diagnostic target proteins and peptides for antibody production using a bioinformatics approach ... 65
3.1 Introduction ...65
3.2 Results ...68
3.2.1 Compilation of a list of proteins from which the diagnostic targets were selected……….68
3.2.2 Peptide epitope selection...71
xi 3.2.3 Verification of peptide epitopes in the recombinant proteins used in this
study...82
3.3 Discussion ...83
Chapter 4 ... 88
Recombinant expression, purification and characterisation of the potential Plasmodium diagnostic target proteins LDH, GAPDH and PMT ... 88
4.1 Introduction ... 88
4.2 Results ... 91
4.2.1 Results from the E. coli expression host using the proposed expression and affinity purification strategies ... 91
4.2.2 Optimisation of expression and affinity purification strategies for the recombinant Plasmodium LDH proteins ... 93
4.2.3 Optimisation of expression and affinity purification strategies for the recombinant Plasmodium GAPDH proteins ... 97
4.2.4 Optimisation of expression and affinity purification strategies for the recombinant Plasmodium PMT proteins ... 100
4.2.5 Expression and affinity purification of the recombinant Plasmodium proteins……… ... 103
4.2.6 Assessing the recombinant Plasmodium proteins’ native structures ... 108
4.3 Discussion………..115
Chapter 5 ... 118
Assessment of polyclonal IgY raised against both the recombinant Plasmodium proteins and peptide targets of LDH, GAPDH and PMT ... 118
5.1 Introduction ... 118
5.2 Results ... 121
5.2.1 Assessing the specificity of the IgY antibodies raised against rPfLDH and the selected LDH peptides ... 121
xii 5.2.2 Assessing the specificity of the IgY antibodies raised against rPfGAPDH and
the selected GAPDH peptides ... 122
5.2.3 Assessing the specificity of the IgY antibodies raised against rPfPMT, PvPMT and the selected PMT peptides ... 124
5.2.4 Double antibody sandwich ELISAs for the detection of the recombinant PfLDH and PfGAPDH proteins in solution... 131
5.2.5 Human IgG pool affinity purified over the respective recombinant P. falciparum protein AminoLink® columns ... 133
5.3 Discussion………..134
Chapter 6 ... 138
Selection of monoclonal recombinant scFv antibodies from the Nkuku® library against the potential Plasmodium target proteins and their respective peptide epitopes ... 138
6.1 Introduction ... 138
6.2 Results ... 142
6.2.1 Raising and affinity purification of anti-cmyc IgY antibodies to detect soluble scFvs………...142
6.2.2 Panning the Nkuku® library ... 143
6.2.3 Polyclonal phagemid ELISA results after rounds one to four of panning ... 144
6.2.4 Anti-LDH monoclonal phage selection ... 144
6.2.5 Anti-GAPDH monoclonal phage selection ... 149
6.2.6 Anti-PMT monoclonal phage selection ... 154
6.2.7 Detection of soluble scFv fragments using the anti-cmyc IgY ... 159
6.2.8 Sequencing results of the scFv clones ... 160
6.3 Discussion ... 167
___________________________________________________________________________ Chapter 7 ... 171
General discussion and future work ... 171
xiii
7.1 Brief overview ... 171
7.2 Identification of new malaria diagnostic candidates (chapter 3) ... 172
7.3 Recombinant expression of the target proteins (chapter 4) ... 172
7.4 Producing polyclonal IgY against the selected peptide and protein targets (chapter 5) ... 173
7.5 Assessing the relative levels of human antibodies against each target from a human anti-malaria hyperimmune antibody pool (chapter 5)... 174
7.6 ScFv clones against all peptides, rPfLDH and rPfGAPDH from the Nkuku® library (chapter 6) ... 174
7.7 Future studies involving the scFv clones identified here ... 175
7.8 Comparative characterisation of the scFv and polyclonal IgY reagents ... 176
7.9 The possibility of capturing the native target proteins using IgY and scFv antibodies and exploiting their native enzymatic activity for detection ... 176
7.10 Retrospective analysis of the peptide targets with respect to post-translational modifications... 177
7.11 Retrospective analysis of the peptide targets with respect to single point mutations ... 178
7.12 Comparing the half-lives of the target proteins ... 179
7.13 Essential field testing of the antibodies in an RDT format ... 179
7.14 A proposed semi-quantitative test for malaria ... 179
7.15 Conclusions ... 182
Bibliography……….183
xiv List of Tables
Table # Title pg.
Table 1.1 Endemic malaria statistics for 2013 / 2014 from the WHO and malaria atlas project 11
Table 1.2 Summary of the source materials used for diagnosis 14
Table 1.3 A summary of methods based on the detection of the host response as well as
Plasmodium specific metabolites 18
Table 1.4 A summary of methods based on the physical/visual detection of the Plasmodium parasite 18 Table 1.5 A summary of methods based on the detection of Plasmodium-specific molecular targets 20
Table 1.6 Molecular targets for diagnosis of malaria 26
Table 2.1 Running and stacking gel recipes to prepare a single gel for SDS-PAGE 33 Table 2.2 Primer sequences used in this study (sequencing and PCR) 35 Table 2.3 List of vectors used in the study for expression of the respective malarial proteins 41 Table 2.4 Expression media used per recombinant protein and additional supplements 45 Table 2.5 List of targets immunised into chickens for IgY production 47
Table 2.6 Media recipes for phage display work 55
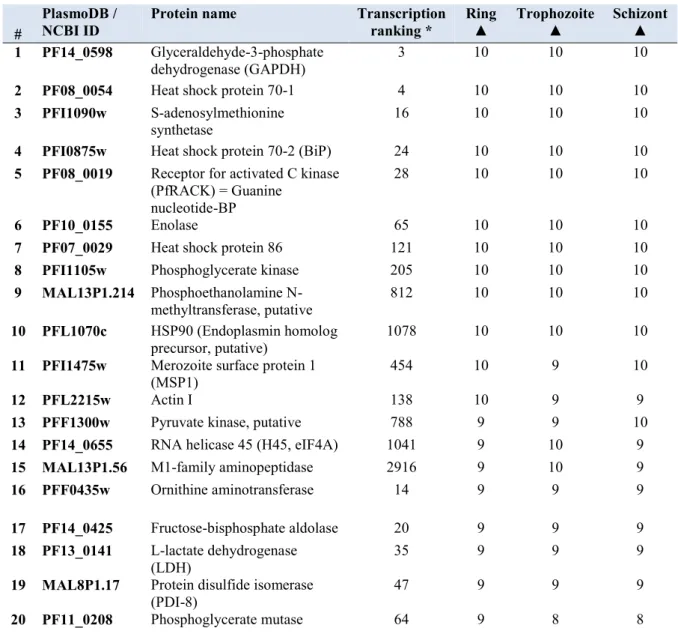
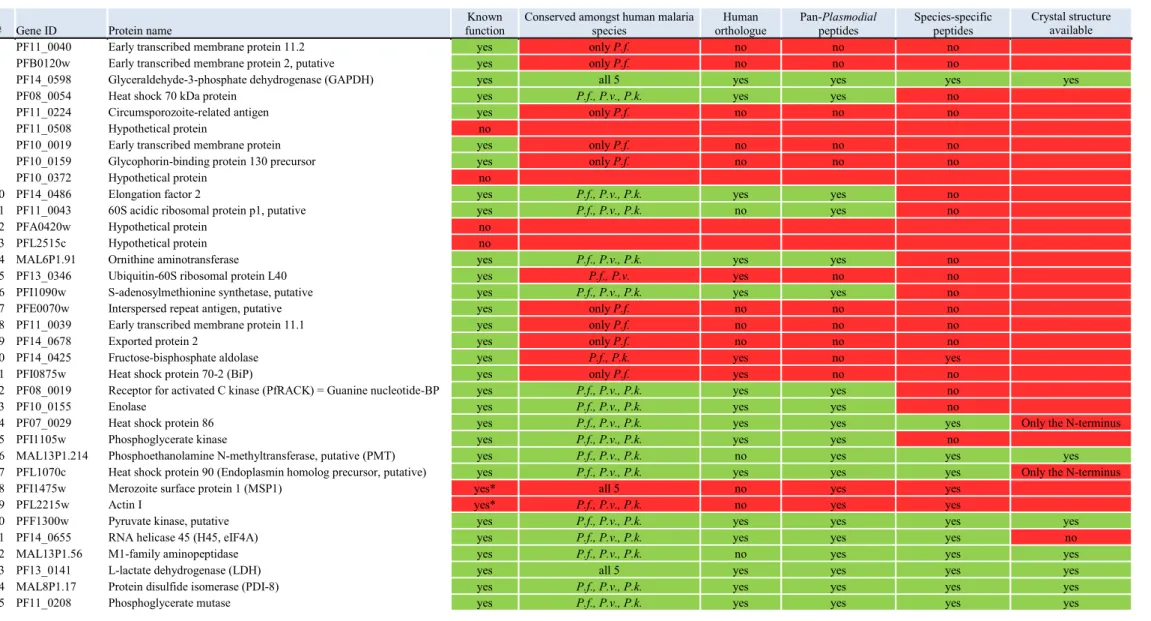
Table 2.7 Malarial targets used to pan the Nkuku® library and the concentrations used per round 60 Table 3.1 Twenty highest expressed genes based on mRNA abundance (LeRoch et al., 2003) 68 Table 3.2 Twenty most abundant proteins according to proteome data from Foth et al., (2011) 69 Table 3.3 Compilation of the 35 most abundant proteins, highlighting potential diagnostic targets in
green and proteins that were excluded in red 70
Table 3.4 Alignment and BLAST results of the selected Plasmodium LDH, GAPDH and PMT
peptides 81
Table 3.5 Alignment and BLAST results for the sequenced vector DNA inserts and translated
sequences 82
Table 4.1 The predicted monomeric and quaternary sizes of the native Plasmodium target proteins
recombinantly expressed in this study 88
Table 4.2 Imidazole concentrations required for elution of bound BL21(DE3) proteins off the
TALON® (Co2+) resin 93
Table 4.3 Imidazole concentrations required for elution of bound recombinant Plasmodium LDH
proteins off the TALON® (Co2+) resin 97
Table 4.4 Imidazole concentrations required for elution of bound recombinant Plasmodium
GAPDH proteins off the TALON® (Co2+) resin 100
Table 4.5 Imidazole concentrations required for elution of bound recombinant Plasmodium PMT
proteins off the TALON® (Co2+) resin 103
Table 4.6 Optimized expression conditions for each recombinant proteins including affinity purified
yields 103
Table 5.1 IgY yields per antigen used in this study 131
Table 6.1 Malarial recombinant protein or peptide targets used to pan the Nkuku® library and the
concentrations used per round 143
xv List of Figures
Figure # Title pg.
Figure 1.1 Generic malaria life cycle diagram including estimated number of parasites released per
stage 3
Figure 1.2 Dynamics of infection of each of the human infective malarias and the resulting diagnostic window for P. falciparum, P. knowlesi and P. vivax
5
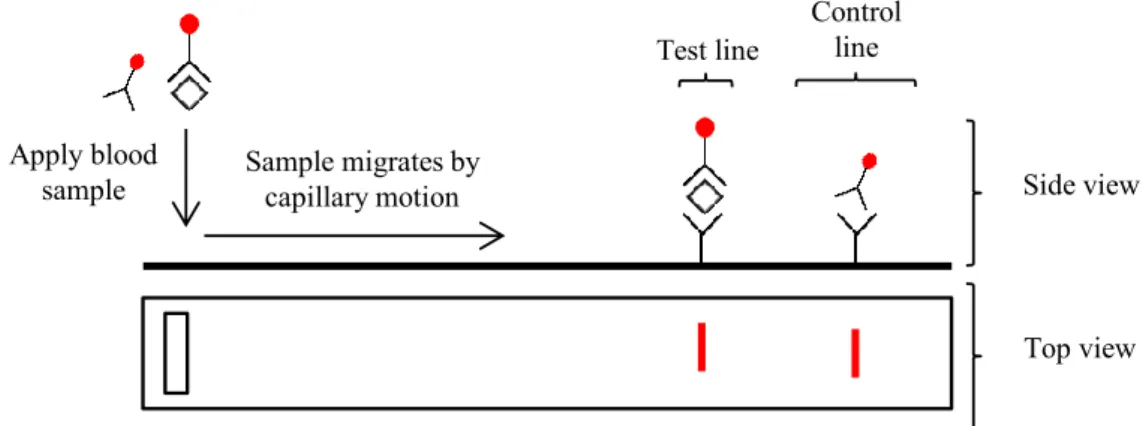
Figure 1.3 Malaria control / eradication statistics and timeline 9 Figure 1.4 Basic outline of a simple rapid diagnostic test (RDT), both top and side view 28
Figure 2.1 Bradford standard curve 32
Figure 2.2 PCR cycle conditions 35
Figure 2.3 pKK223-3 expression plasmid vector map 41
Figure 2.4 pET-15b expression plasmid vector map 42
Figure 2.5 pET-28a expression plasmid vector map 43
Figure 2.6 pHEN1 vector map used in phage display 55
Figure 3.1 NAD+(H) linked glycolytic reactions involving GAPDH and LDH 66 Figure 3.2 Alignment of Plasmodium and mammalian LDH sequences indicating the peptides
chosen for polyclonal chicken antibody and monoclonal scFv produciton, adapted from Hurdayal et al. (2010)
72
Figure 3.3 Predict7TM analyses of three selected Plasmodium LDH peptides (data adapted from
Hurdayal et al. (2010) 74
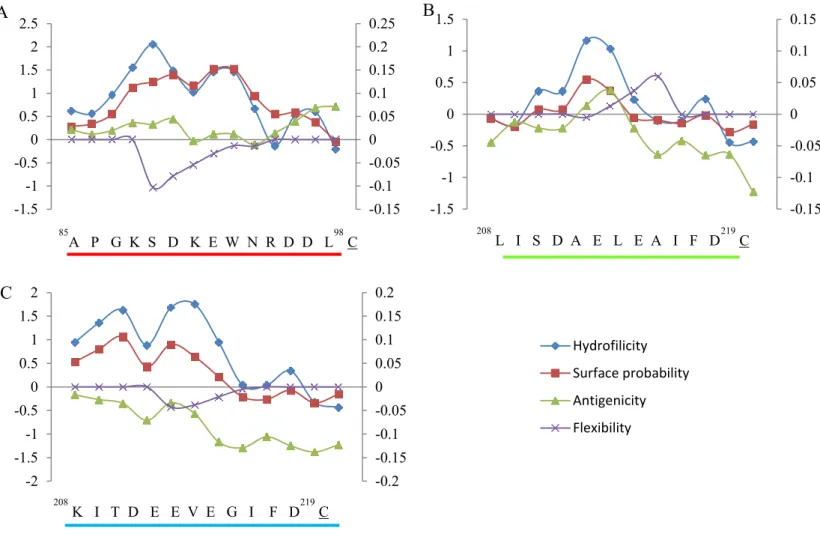
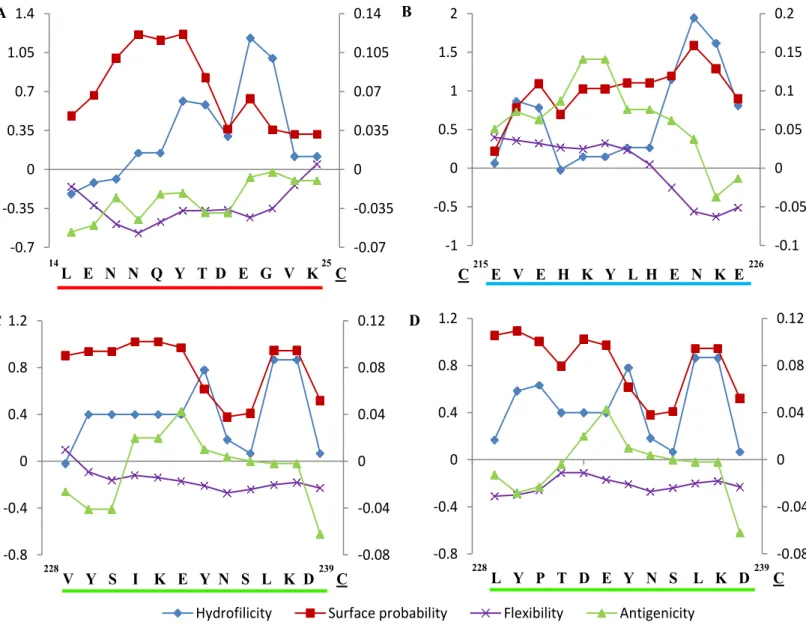
Figure 3.4 Alignment of Plasmodium and mammalian GAPDH sequences showing selected peptide epitopes chosen for polyclonal chicken antibody and monoclonal scFv production 75 Figure 3.5 Predict7TM analyses of three selected Plasmodium GAPDH peptides 76 Figure 3.6 Alignment of Plasmodium PMT sequences showing selected peptide epitopes chosen for
polyclonal chicken antibody and monoclonal scFv production 77 Figure 3.7 Predict7TM analyses of four selected Plasmodium PMT peptides 78 Figure 3.8 Location of the P. falciparum specific and the pan-Plasmodial epitopes on the 3D crystal
structure of Pf/PvLDH (A), PfGAPDH (B) and PfPMT (C) 79
Figure 4.1 Untransformed BL21(DE3) host growth under different conditions and elution profiles off a TALON® (Co2+) resin using a linear Imidazole gradient, analysed by silver staining on SDS-PAGE
92
Figure 4.2 Growth of rPfLDH expressing cultures under varying conditions and elution profiles off a
TALON® (Co2+) resin analysed by SDS-PAGE 94
Figure 4.3 Growth of rPvLDH expressing cultures under varying conditions and elution profiles off a
TALON® (Co2+) resin analysed by SDS-PAGE 95
Figure 4.4 Growth of rPyLDH expressing cultures under varying conditions and elution profiles off a
TALON® (Co2+) resin analysed by SDS-PAGE 96
Figure 4.5 Growth of rPfGAPDH expressing cultures under varying conditions and elution profiles
off a TALON® (Co2+) resin analysed by SDS-PAGE 98
Figure 4.6 Growth of rPyGAPDH expressing cultures under varying conditions and elution profiles
off a TALON® (Co2+) resin analysed by SDS-PAGE 99
Figure 4.7 Growth of rPfPMT expressing cultures under varying conditions and elution profiles off a
TALON® (Co2+) resin analysed by SDS-PAGE 101
Figure 4.8 Growth of rPvPMT expressing cultures under varying conditions and elution profiles off a
TALON® (Co2+) resin analysed by SDS-PAGE 102
Figure 4.9 Recombinant expression and affinity purification of Pf, Pv and PyLDH analysed by SDS-
PAGE and Western blot 105
xvi
Figure 4.10 Recombinant expression and affinity purification of Pf and PyGAPDH analysed by SDS-
PAGE and Western blot 106
Figure 4.11 Recombinant expression and affinity purification of Pf and PvPMT analysed by SDS-
PAGE and Western blot 107
Figure 4.12 Calibration of the Sephacryl S-200 molecular exclusion chromatography column 109 Figure 4.13 rPfLDH elution profile over a Sephacryl S-200 MEC column 110 Figure 4.14 rPvLDH elution profile over a Sephacryl S-200 MEC column 110 Figure 4.15 rPyLDH elution profile over a Sephacryl S-200 MEC column 111 Figure 4.16 Enzyme activity of both recombinant PfLDH and PvLDH assessed by measuring the
increased formation of NADH due to the oxidation of L-lactate 111 Figure 4.17 rPfGAPDH elution profile over a Sephacryl S-200 MEC column 112 Figure 4.18 rPyGAPDH elution profile over a Sephacryl S-200 MEC column 113 Figure 4.19 rPfPMT elution profile over a Sephacryl S-200 MEC column 113 Figure 4.20 rPvPMT elution profile over a Sephacryl S-200 MEC column 114 Figure 5.1 An illustration of potential cross reactivity caused by linear and conformational epitopes
recognised by a hypothetical antibody 119
Figure 5.2 Panel of western blots showing specificity of the respective anti-LDH IgY antibodies 121 Figure 5.3 Panel of western blots showing specificity of the respective anti-GAPDH IgY antibodies 122 Figure 5.4 Raising and affinity purification of IgY against the PfGAPDH specific peptide (CAD) 123 Figure 5.5 Raising and affinity purification of IgY against the whole rPfPMT protein 125 Figure 5.6 Raising and affinity purification of IgY against the whole rPvPMT protein 126 Figure 5.7 Raising and affinity purification of IgY against the common PMT peptide (DEG) 127 Figure 5.8 Raising and affinity purification of IgY against the P. falciparum specific PMT peptide
(CEV) 128
Figure 5.9 Raising and affinity purification of IgY against the P. vivax specific PMT peptide (VYS) 129 Figure 5.10 Raising and affinity purification of IgY against the P. knowlesi specific PMT peptide
(LYP) 130
Figure 5.11 Double antibody-sandwich ELISAs to detect rPfLDH 132
Figure 5.12 Double antibody-sandwich ELISAs to detect rPfGAPDH 132 Figure 5.13 Affinity purified human IgG yields from an anti-malaria hyper immune serum pool
against various recombinant P. falciparum proteins
133
Figure 6.1 Representation of the pHEN1 coding region including the scFv and protein III regions 139 Figure 6.2 Schematic representation of the panning procedure used to select for target antigen
specific scFv-bearing phagemids from the Nkuku® library 140 Figure 6.3 Titres and affinity purification of anti-cmyc antibodies from chicken eggs 142 Figure 6.4 Polyclonal phagemid ELISA results for pans one to four of each of the respective target
peptides and recombinant proteins 144
Figure 6.5 Monoclonal ELISA results for the anti-rPfLDH clones 145 Figure 6.6 Monoclonal ELISA results for the anti-APG (common LDH peptide) clones 146 Figure 6.7 Monoclonal ELISA results for the anti-FDC (P. falciparum LDH peptide) clones 147 Figure 6.8 Monoclonal ELISA results for the anti-KIT (P. vivax LDH peptide) clones 148
xvii
Figure 6.9 Monoclonal ELISA results for the anti-rPfGAPDH clones 150 Figure 6.10 Monoclonal ELISA results for the anti-VMG (common GAPDH peptide) clones 151 Figure 6.11 Monoclonal ELISA results for the anti-WGK (P. falciparum GAPDH peptide) clones 152 Figure 6.12 Monoclonal ELISA results for the anti-ADG (P. falciparum GAPDH peptide) clones 153 Figure 6.13 Monoclonal ELISA results for the anti-DEG (common PMT peptide) clones 155 Figure 6.14 Monoclonal ELISA results for the anti-CEV (P. falciparum PMT peptide) clones 156 Figure 6.15 Monoclonal ELISA results for the anti-VYS (P. vivax PMT peptide) clones 157 Figure 6.16 Monoclonal ELISA results for the anti-LYP (P. knowlesi PMT peptide) clones 158 Figure 6.17 Expression of the top six anti-rPfLDH scFvs analysed by SDS-PAGE and western blot 159 Figure 6.18 Expression and affinity purification of the anti-rPfLDH scFv clone R4H1 analysed by
SDS-PAGE and western blot 160
Figure 6.19 Colony PCR of the selected clones against rPfLDH, rPfGAPDH and the PMT peptides 161 Figure 6.20 Nested PCR of the selected clones against rPfLDH, rPfGAPDH and the common PMT
peptide (VYS) 161
Figure 6.21 Alu1 digest of the selected clones against rPfLDH, rPfGAPDH and the common PMT
peptide (VYS) 162
Figure 6.22 Alignment of the anti-rPfLDH scFv clones’ translated sequences with a chicken germline immunoglobulin and the Chiliza et al., (2008) anti-LDH scFv sequences 163 Figure 6.23 Alignment of the anti-rPfGAPDH scFv clones’ translated sequences with a chicken
germline immunoglobulin sequence 165
Figure 6.24 Alignment of the anti-common PMT peptide (VYS) scFv clones’ translated sequences
with a chicken germline immunoglobulin sequence 166
Figure 7.1 Proposed multi-test line semi-quantitative detection of malaria 180
xviii Abbreviations and symbols
Abbreviation Explaination Abbreviation Explaination Abbreviation Explaination
(H)-NMR (Proton)-Nuclear magnetic
resonance dhps Dihydropteroate synthase HRPO Horse radish peroxidase
18S rRNA Small eukaryotic ribosomal
subunit component DMF Dimethyl formazan Ig Immunoglobulin
ABTS 2,2'-azino-bis(3-
ethylbenzothiazoline sulfonate DMSO Dimethyl sulfoxide IPTG isopropyl-β-D-1- thiogalactopyranoside ACT Artemisinin-based combination
therapy DNA deoxyribonuecleic acid Kan Kanamycin
AMA-1 Apical membrane antigen 1 dNTP deoxyribonucleotide triphosphate kD kilo Daltons
AMP Adenosine monophosphate DTT Dithiothreitol kdr Knock down resistance (pyrethroid)
Amp Ampicillin ECL Enhanced chemiluminescence LAMP Loop mediated isothermal
amplification
ATP adenosine triphosphate EDTA Ethylenediaminetetraacetic acid LB Lysogeny Broth
BLAST Basic local alignment search tool ELISA enzyme linked immunosorbent assay LDH lactate dehydrogenase BSA Bovine serum albumin EMP1 Erythrocyte membrane protein 1 LFD Lateral flow dipstick
cfu Colony forming units EtBr Ethidium bromide LF-RPA Lateral flow recombinase
polymerase amplification COX-III Cytochrome oxidase III gene FAD Flavin adenine dinucleotide LOD Limit of detection crt Chloroquine resistance transporter Fc Fragment crystallizable group MAP Malaria atlas project
CSP Circumsporozoite protein FCA Freund's complete adjuvant MBS Maleimidobenzoyl-N-
hydroxysuccinimide ester
cytb Cytochrome b FIA Freund's incomplete adjuvant mdr1 Multidrug resistance protein 1
DAS ELISA Double antibody sandwich enzyme linked immunosorbent assay
GAPDH glyceraldehyde-3-phosphate
dehydrogenase MEC Molecular exclusion
chromatography
DDT Dichlorodiphenyltrichloroethane HRP2 Histidine rich protein 2 MES 2-(N-Morpholino)ethanesulfonic acid
dhfr Dihydrofolate reductase HRP3 Histidine rich protein 3 mRNA messenger ribonucleic acid
xix
Abbreviation Explaination Abbreviation Explaination Abbreviation Explaination MWCO Molecular weight cut off pLDH Plasmodium lactate dehydrogenase TEMED N',N',N',N',-
tetramethylethylenediamine NA Not applicable / available PMT phosphoethanolamine-N-
methyltransferase USD United States Dollar
NAD nicotinamide adenine
dinucleotide POC Point of care varATS var gene acidic terminal sequence
NALFIA Nucleic acid lateral flow
immunoassay Pvr47 P. vivax species-specific repetitive
sequence VH Variable heavy chain
NASBA Nucleic acid sequence based
amplification qPCR Quantitative real time polymerase
chain reaction VL Variable light chain
NCBI National Center for
Biotechnology Information RA Rabbit albumin WHO World Health Organisation
ND Not done / determined RBC Red blood cell
O.D. optical density (measured at 600
nm) RDT rapid diagnostic test
PBS Phosphate buffered saline RFLP Restriction fragment length polymorphism
PCR Polymerase chain reaction RNA Ribonucleic acid
PEG Polyethylene glycol RT Room temperature
PfATPase6 P-type calcium ATPase gene scFv Single chain fragment variable pfnhe P. falciparum Na+/H+
exchanger SDS Sodium dodecyl sulphate
Pfr364 P. aflciparum species-specific
repetitive sequence SDS-PAGE Soidum dodecyl sulphate
polyacrylamide gel electrophoresis Pfs230p Male gametocyte surface
protein SOC Super optimal broth
Pfs25 Female gametocyte surface
protein TAE Tris, acetic acid, EDTA buffer
pfu Plaque forming units TARE-2 Telomere-associated repetitive element 2
Pfubp-1 Deubiquitinating enzyme TB Terrific broth pgmet unique methionine tRNA gene TBS Tris buffered saline
1 Chapter 1
Introduction and literature review
Epidemiology entails studying the cause, transmission, control and surveillance of disease.
Diagnosis is key to the study of any disease and this review highlights the main diagnostic tools and targets used to study malaria.
1.1. An overview of malaria focused on diagnosis 1.1.1 Importance of diagnosis
Malaria is the leading global cause of human death due to a parasitic disease (Murray et al., 2014). It affects approximately half the human population (3.2 billion people), where an estimated 1.2 billion people live in high-risk malaria endemic countries. Of the 124-283 million reported malaria cases, approximately 584000 deaths resulted, most of which (455000) were children under the age of five (Hay et al., 2004; WHO 2015b world malaria report). This equates to a child dying of malaria and between 240-550 new malaria cases being diagnosed nearly every minute. The malaria cases may vary from mild (fever) to severe disease (prostration, impaired consciousness, difficulty breathing, jaundice, haemoglobinuria and severe anaemia (five-seven grams of haemoglobin per 100 ml of blood)) and cerebral malaria (Miller et al., 1994). To date attempts to develop an effective vaccine have been unsuccessful and despite it being a curable disease malaria continues to claim human lives every day. Most deaths result from failure to diagnose and treat malaria before the onset of severe disease. Even with proper treatment severe malaria mortality rates exceed 20% (Antia et al., 2008; Suh et al., 2004). Until such time as a “silver bullet” is found, diagnosis and timely treatment are vital to curb the mortality due to malaria.
1.1.2 Which species infect humans and differences in treatment?
Malaria treatment varies depending on the species of parasite causing the disease. The eukaryotic protozoan parasites that cause malaria fall within the genus Plasmodium (Bannister et al., 2000; Miller et al., 1994) and include over 100 species infecting avian, reptilian, amphibian and simian hosts (Suh et al., 2004). Of all the Plasmodium species known only five infect humans. These are Plasmodium falciparum, P. vivax, P. knowlesi, P.
malariae and P. ovale (Daneshvar et al., 2009; Sabbatani et al., 2010).
2 Of these five species P. falciparum is the most aggressive pathogen causing cerebral malaria and death (Suh et al., 2004; Welch, 1897). P. knowlesi has only recently been recognised as a human infecting species, although the first natural human infection was recorded in 1965 (Chin et al., 1965; Cox-Singh et al., 2008; Lee et al., 2011; van Hellemond et al., 2009;
Yusof et al., 2014). P. knowlesi has a shorter red blood cell cycle than P. falciparum, rapidly multiplies in the blood and also causes severe disease and death (Chin et al., 1965; Daneshvar et al., 2009; Ng et al., 2008; Sabbatani et al., 2010). P. vivax and P. malariae were first described and differentiated in 1890 by Grassi and Feletti (Collins and Jefferey, 2007; Grassi and Feletti, 1890), where P. malariae can cause severe malaria but is not fatal. P. vivax on the other hand has been reported to cause severe and fatal malaria in humans (Kochar et al., 2005; Shaikh et al., 2012) and its ability to remain dormant in the liver of infected patients even after drug clearance of the initial blood stage infection is shared by P. ovale. These dormant parasites can then cause relapsing blood infections more than two years later (Fujioka and Aikawa et al., 2002; Perkins and Bell, 2008). Specific drugs targeting the liver stages of P. vivax and P. ovale, such as primaquine are required to clear dormant liver infections (Beeching et al., 2007). P. ovale, the fifth of the human pathogens is the only species with humans as its sole host. It was first identified in 1922 and interestingly due to its benign nature; it was used to induce fever episodes as a treatment of neurosyphilis before the advent of penicillin (Collins and Jeffery, 2007). Each of the five species has different infection characteristics due to slight differences in their life cycles and requires species- specific diagnosis and treatment as a result.
1.1.3 Brief life cycle description
A generic malaria life cycle which summarises the number of parasites released at the end of each stage is shown in Figure 1.1. Since malaria is transmitted by a mosquito vector of the Anopheles genus (Ross R., 1897) the life cycle starts here. In order to produce eggs the female mosquitoes require a high protein source, blood, in their diets and they need to feed regularly. This makes them an ideal vector for parasite transmission. Whilst feeding, the female mosquito injects anticoagulants into the host blood. Approximately ten to 100 mature parasites (sporozoites), residing in the salivary glands of the mosquito, are injected at this point allowing them entry into their human host (Baldacci and Menard, 2004; Kappe et al., 2010; Miller et al., 1994).
Once inside the host the sporozoites actively move to the liver using gliding motility (Baldacci and Menard, 2004; Kebaier et al., 2009; Shortt and Garnham, 1948). This process
3 Liver stage
Mosquito vector
Sexual stage Human host
14 to 32 merozoites released (48 hrs)
Ring (0.5 hrs)
Trophozoite (26 hrs)
Schizont (38 hrs) Red blood cell
invasion (0-5 min)
Red blood cell stage
Symptoms appear allowing clinical diagnosis
Morphological differences allow microscopic diagnosis
Molecular diagnosis detects malarial DNA or proteins 10-100
sporozoites released per bite
1 sporozoite results in 10000-30000
merozoites (1 to 2 weeks)
10-1000 gametocytes ingested per blood meal
2000 to 4000 sporozoites mature in 2
weeks
The first gametocytes appear 13 to 34 days
post infection
may take up to an hour, depending on the route taken, either via the blood stream or the lymphatic system. The sporozoites invade the liver via specialised liver macrophages known as Kupffer cells (Cha et al., 2015). Inside a liver hepatocyte the sporozoites divide and change their morphology to blood infective forms known as merozoites. A single sporozoite may divide to form as many as 10000 to 30000 merozoites, which are released into the blood of the host after about one to two weeks once the infected liver cell bursts (Fujioka and Aikawa, 2002; Miller et al., 1994).
Figure 1.1 Generic malaria life cycle diagram including estimated number of parasites released per stage
The times for the red blood cell stages were based on the P. falciparum life cycle. The parasite numbers per stage were taken from Antia et al., 2008; Baldacci and Menard, 2004; Fujioka and Aikawa, 2002; Kappe et al., 2010; Miller et al., 1994 and Smith and Craig, 2005.
The invasion of red blood cells occurs almost instantly (zero to five minutes) and was recorded by live cell imaging in a study by Gilson and Crabb (2009). The red blood cell cycle of the infection can take 24 (P. knowlesi), 48 (P. falciparum, P. vivax), 49 (P. ovale) or 72 (P.
malariae) hours depending on the Plasmodium species causing the infection, where the P.
falciparum blood stage times are shown in Figure 1.1 (Chin et al., 1965; Daneshvar et al., 2009; Fujioka and Aikawa, 2002; Lee et al., 2011; Murray et al., 2009). Once development in the red blood cells is complete, the cells rupture and the newly infective merozoites are released (between eight to 32 daughter merozoites) and infect naïve red blood cells (Antia et al., 2008; Baldacci and Menard, 2004; Collins and Jeffery, 2005).
4 During the later stages of infection (usually after three to ten completed red blood cell cycles) a few of the merozoites mature into male or female gametocytes. Only once a female mosquito feeds on the infected host and ingests both gametocytes, does the sexual stage of the life cycle commence. The gametocytes fuse to form a zygote, which then forms a motile ookinete and migrates through the stomach wall to the midgut of the mosquito where it settles as an oocyst. Parasites divide and mature into sporozoites within the oocyst and are released to migrate to the salivary glands where they remain, until the mosquito seeks her next blood meal (Fujioka and Aikawa, 2002). Each of the Plasmodium species has different numbers of parasites and times for each developmental stage, which affects disease progression (see Figure 1.2).
1.1.4 When do symptoms appear and what is the diagnostic window?
During an infection the host remains asymptomatic until the parasite enters its red blood cell cycle. Due to the different Plasmodium species’ infection characteristics, malaria symptoms present differently (Gwer et al., 2007; Kidane and Morrow, 2000; Perkins and Bell, 2008;
Sirima et al., 2003). At the point where the infected red blood cells lyse, parasites as well as their metabolites are released into the host blood system. This allows the host’s immune system direct contact with these factors and immune reactions follow, resulting in disease symptoms (Golgi, 1886; Miller et al., 1994). At this stage patients may seek medical attention and diagnosis depending on the severity of the disease. The incubation time (period between the initial infective bite and appearance of symptoms) may vary depending on the number of infective sporozoites injected, the state of the host immune system and the effect of any treatment prior to diagnosis. Ideally diagnosis should occur before development of severe disease (Antia et al., 2008; Barnes et al., 2015; Suh et al., 2004). The time taken for naïve and immune patients to develop severe infections can be estimated based on the numbers of parasites and time for each developmental stage from the life cycle (Figure 1.1) and accepting a simplified progression of disease. This is illustrated in Figure 1.2.
These simplified disease progress graphs illustrate the limited time during which diagnosis should ideally occur. It also highlights the window in which “normal” drug doses are effective for treatment of infections and at which point increased dose and duration of treatment are required. Hyperparasitemic infections (parasitemia greater than 100000 per microliter) require such treatment (Barnes et al., 2015; White et al., 2009).
5
100 1000 10000 100000
0 12 24 36 48 60 72 84 96 108 120 132 144
Parasites / µl
Time (hrs)
P. knowlesi P. falciparum P. vivax P. ovale P. malariae
Naive symptoms Hyperparasitemia
Increased drug dose and duration
Normal drug dose and duration Severe malaria
1000 10000 100000
0 12 24 36 48 60 72
Parasites / µl
Time (hrs)
P. knowlesi P. falciparum P. vivax P. ovale P. malariae
Immune symptoms Hyperparasitemia
Increased drug dose and duration
Normal drug dose and duration Severe malaria
A)
B)
2500
Figure 1.2 Dynamics of infection of each of the human infective malarias and the resulting diagnostic window for P. falciparum, P. knowlesi and P. vivax
The diagnostic window for P. falciparum, P. knowlesi and P. vivax is shaded in blue. This is the period within which malaria should ideally be diagnosed to optimally treat the infection with “normal” dose and duration of drugs. As parasitemia increases beyond 10000 parasites / microliter, increased dose and duration of drugs are recommended. The window falls between 36-72 hours for symptomatic naïve (A) and 12-21 hours for symptomatic immune patients (B) (Antia et al., 2008; Baldacci and Menard, 2004; Barnes et al., 2015; Chin et al., 1965; Daneshvar et al., 2009; Fujioka and Aikawa, 2002; Lee et al., 2011; Miller et al., 1994; Murray et al., 2008 and 2009; White et al., 2009).
Only three species of malaria have been reported to reach hyperparasitemic levels. These are P. falciparum (maximum parasitemia of 2500000 per microliter), P. vivax (maximum parasitemia of 100000 per microliter) and P. knowlesi (maximum parasitemia of 800000 per microliter) (Zimmerman and Howes, 2015). Human populations in endemic regions develop some form of non-sterilizing immunity against malaria, meaning that the dynamics of the disease are different between naïve and immune patients. In the case of naïve patients,
6 including children under five years old, malaria symptoms will start to appear once the parasitemia reaches 100 parasites per microliter, which is why the origin of Figure 1.2 (A) was set at this parasitemia (Hänscheid, 1999). In contrast, immune patients may remain asymptomatic with a parasitemia of 2500-10000 per microliter as shown in Figure 1.2 (B) (Hänscheid T., 1999). Severe malaria is usually diagnosed at greater than 10000 to 30000 parasites per microliter and prognoses deteriorate rapidly beyond this level of infection (Barnes et al., 2015; White et al., 2009).
Based on Figure 1.2 (A) malaria may cause severe disease within 36 to 72 hours in naïve hosts for most of the human infecting species. In the case of P. malariae this may take longer, causing severe disease around 120 hours after the first clinical symptoms appear in naïve patients. In immune hosts (Figure 1.2 (B)) symptomatic infections may escalate to hyperparasitemic infections within very short periods of time, between 12 to 36 hours, due to higher initial parasitemia. The WHO recommends treatment within 24 hours of the onset of fever and diagnosis within two hours of patients presenting for treatment (WHO guidelines for treatment of malaria, 3rd edition, 2015a). The window for diagnosis and timely treatment ideally lies between parasitemia causing symptoms and severe disease as shaded in blue in Figure 1.2. Importantly, any complications, such as drug-resistant infections, also need to be diagnosed to allow for timely changes in treatment if required.
The window for diagnosis narrows when considering that patients usually only present themselves to clinicians once they express symptoms and sometimes only after self-treatment has failed, resulting in an increased number of severe as opposed to mild malaria cases. This increases the time pressure on diagnosis and treatment. Diagnostic methods should ideally allow for rapid point of care diagnosis of the patient. Due to the high mortality, treatment may often be administered without confirmed diagnosis.
1.1.5 The importance of diagnosis to prevent spread of resistance
Treatment of malaria used to be based on the clinical diagnosis of disease and subsequent prescription of anti-malarial drugs. This was an effective strategy as little time was taken to treatment and antimalarial drugs such as chloroquine were readily available, cheap and effective. The unfortunate consequence of such “liberal” use of these drugs was that this practice selected for anti-malarial drug resistant parasite populations. The WHO no longer recommends fever as a sole diagnostic marker for malaria in the tropics and microscopic and/or molecular diagnosis as confirmation prior to treatment is now advised. Another factor
7 contributing to the spread of resistance is inadequate dosage and duration of anti-malarial drugs prescribed to patients with hyperparasitemic infections (Barnes et al., 2015; White et al., 2009). At hyperparasitemic levels, “normal” drug treatment regimens may still reduce the parasite load of the patient but are insufficient to clear the infection. This results in exposure of parasites to sub-optimal drug doses and the subsequent selection of resistant phenotypes.
The ability to quantify the parasite load within the patient would allow clinicians to track disease progress and success of treatment. Diagnostic methods should ideally be able to quantify parasite load and be cheap enough to allow for repeat diagnoses to track treatment progress even in resource poor settings (Barnes et al., 2015; White et al., 2009).
1.1.6 Complicated malaria infections
Several additional challenges for diagnosis will be discussed to follow, including cerebral, placental and mixed infections. During a P. falciparum infection, the parasites produce proteins such as Histidine rich protein 2 (HRP2) and Erythrocyte membrane protein 1
(EMP1) which are located to knobs on the surface of the infected red blood cell (Bannister et al., 2000). These proteins cause the infected red blood cells to stick to each other as well as to uninfected red blood cells. The infected cells also stick to endothelial cells of arterioles.
These phenomena are referred to as rosetting and sequestration respectively (Leitgeb et al., 2011). Resulting restricted blood flow causes cerebral malaria and organ failure in severe infections (David et al., 1983; Leitgeb et al., 2011). Malaria diagnosis during pregnancy is also complicated by this phenomenon, referred to as placental malaria. Sequestration and rosetting result in low levels of parasites in the peripheral blood, which makes microscopic detection of parasites difficult.
This makes it important to either complement or replace microscopic diagnosis with detection of soluble targets released by sequestered parasites, such as proteins, nucleic acids and carbohydrates, as detection of parasites in the blood becomes less reliable (Kattenberg et al., 2011). There is also a need to detect liver dormant parasites in a similar way to detect potential relapse infections (Fujioka and Aikawa et al., 2002).
Coinfection with different malaria species is also possible (Chuangchaiya et al., 2010;
Murray et al., 2008). This affects treatment and highlights the need for species-specific diagnosis. Drug resistance to date is most prominent within strains of P. falciparum followed by P. vivax and, in many cases diagnosis of these species requires treatment with combination therapies as opposed to conventional drugs (WHO guidelines for treatment of malaria, 3rd
8 edition, 2015a). This complicates treatment strategies and makes them more expensive which has made diagnosis prior to treatment more “cost effective”. Fortunately the other three Plasmodium species have not yet developed any resistance to anti-malarial drugs, making them simpler and cheaper to treat. P. knowlesi remains susceptible to artemisinin with variable to moderate susceptibility to chloroquine, but should not be treated with mefloquine (Fatih et al., 2012). Tracking the spread of drug resistance is critical in maintaining effective malaria control strategies and methods to diagnose resistance are essential (Carnevale et al., 2007; Duraisingh et al., 1998).
Several tropical diseases, including dengue, not only display similar symptoms to malaria, but also co-infect patients with malaria (Källander et al., 2004; Rao et al., 2015). This complicates clinical diagnosis and highlights the need for confirmed diagnosis using either microscopy or alternate molecular methods (Gwer et al., 2007; Perkins and Bell, 2008).
Regardless of the challenges, malaria control efforts have been successful at reducing the global distribution of malaria and the next section will highlight the successes achieved and the current setting of diagnosis in endemic regions that resulted.
1.2. Malaria control to date and the setting of diagnosis
Malaria used to be distributed globally, but has since been restricted to the tropics (Figure 1.3). Our understanding of malaria has been integral in its control and some of the major discoveries and implementation of control strategies were highlighted in Figure 1.3. Tropical fevers have long been treated using anti-malarial drugs including artemisinin and quinine (China since the 4th and South America since the 17th century respectively).
The cause of malaria, which was thought to be from bad air (“mal-aria” in Latin), was only discovered as late as 1880 by Laveran (Laveran, 1880). The subsequent detection of the Plasmodium parasite with a Giemsa stain for microscopy in 1891 is still used as the gold standard for malaria diagnosis today (Moody, 2002). Although this improved the diagnosis and treatment of malaria, only with the discovery of the mosquito vector by Ross in 1897 (Ross, 1897), was the life cycle of the parasite understood. Between the 1930s and 50s a whole range of anti-malarial drugs were developed and discovered as well as the pesticide DDT. Together these tools allowed the WHO to launch and oversee the first large scale control programme against malaria in 1955. Malaria was since eradicated from Japan, Europe and North America, soon followed by Russia and Australia.