Willingness to participate in clinical trials is a key element in recruiting suitable participants for interventional trials. Measuring willingness to participate helps determine community readiness for clinical trials, such as HIV vaccine trials.
Introduction
Do university students from different racial groups existing in South Africa express differential willingness to participate in HIV prevention research? Do the factors influencing willingness to participate in HIV prevention clinical research differ among university students of different racial groups in South Africa?
Literature Review
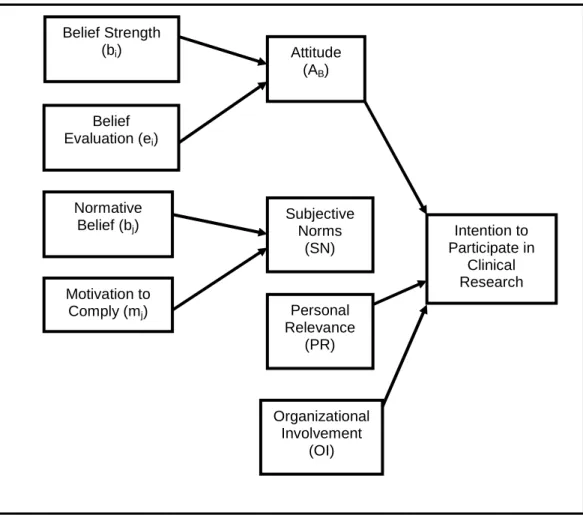
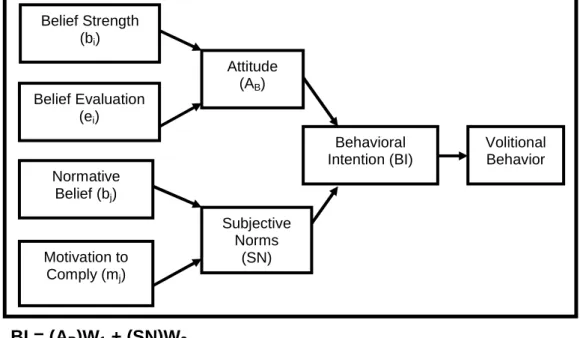
Social identity refers to "the ways in which individuals and collectivities are distinguished in their social relations with other individuals and collectivities" (50). The literature suggests that using the theory of reasoned action can help determine the commons.
Research Methodology
- Introduction
- Type of research
- Study design
- Research population
- Data sources
- Statistical analysis
- Ethics
- Summary
Non-probability sampling was used in the form of a voluntary sample of people willing to do so. The measurement instrument used in the study was a structured questionnaire/scale distributed online (see Appendix 1). To reduce this kind of bias; the request for participation in the study was placed in a central location that all members of the student community could access.
Data were checked for validity in the form of face authentication and checking for inconsistencies and gaps. ANOVA was performed using the IBM SPSS Statistics 21 Program for Windows. (68) The Bonferroni test was chosen as the test for multiple comparisons. Selection of independent variables in the final model was based on a significance level of p<0.05 (backward elimination).
Results
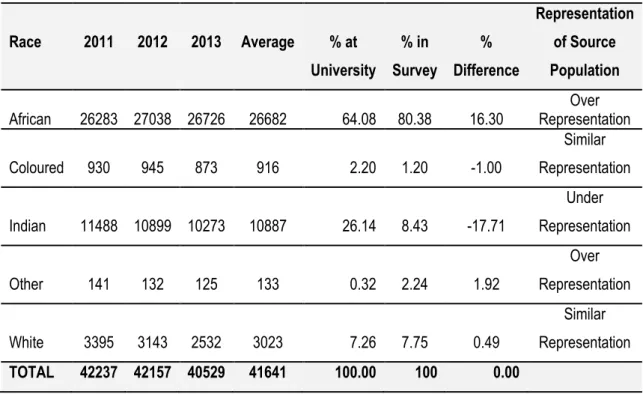
Survey racial demographics
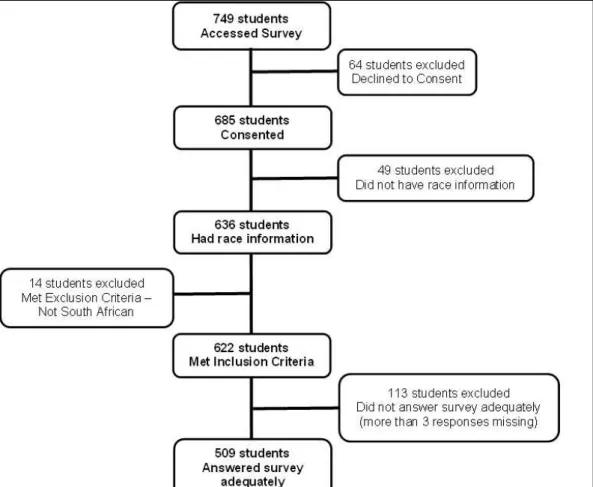
In table 1, the average percentage per racial group at the university based on the average of annual and 2013 estimates compared to the percentage racial distribution in this study. It was found that for both white and colored racial groups, the racial distribution in the study was proportional to that found in the university community. African students were over-represented in the survey at approximately 16.3% and Indian students were under-.
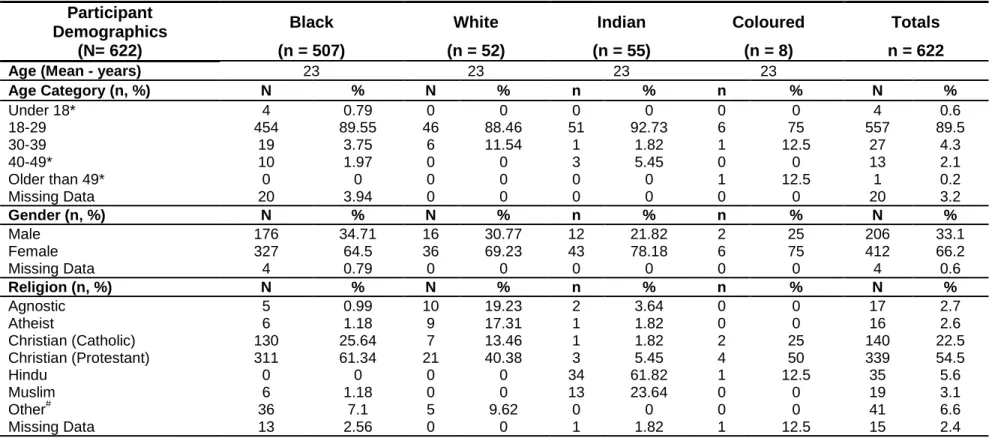
Participant demographics
The mean age across all racial groups was 23 years, allowing for a uniform comparison across all racial groups based on age. Similar proportions of all students across all racial groups reported no partner with 32.54% for black students, 23.08 for white students, 29.09 for Indian students, and 25% for students of color. For students reporting a child, the proportion of black students was 16.57% compared to 5.77% of white students and 3.64% of Indian students.
The majority of students across all racial groups were full-time students who were not employed. Among all racial groups, there was not a clear majority in terms of educational attainment, with a similar distribution of responses per racial group, as expected since the survey was open to all South African students in the university community. The majority of white students (88.46%) and Indian students (83.64%) reported using the private sector for health care, thereby showing a marked difference in the use of health services across racial groups.
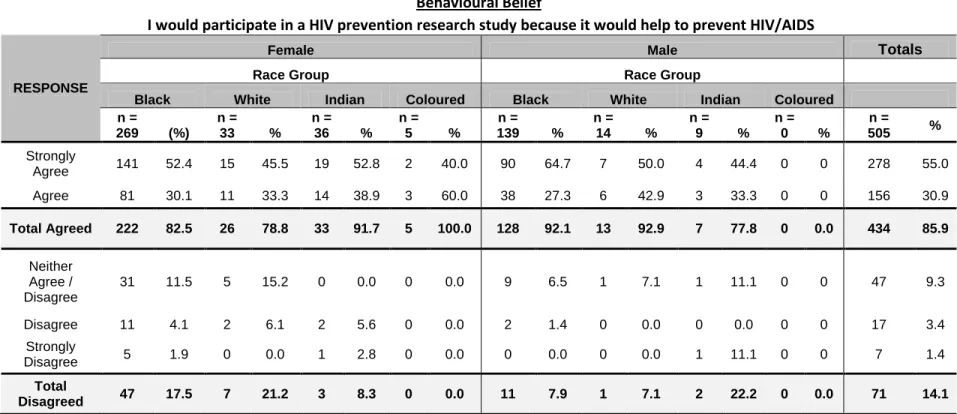
Willingness to participate by gender and race
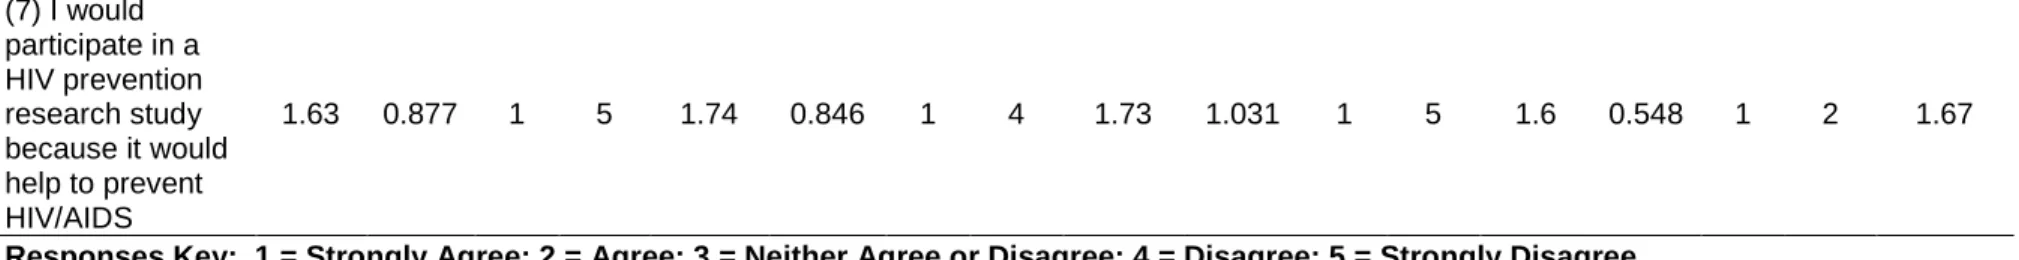
Behavioral beliefs [I will participate in an HIV prevention research study because it will help prevent HIV/AIDS]. Willingness to participate was determined by the behavioral beliefs construct item "I would participate in an HIV prevention research study because it would help prevent HIV/AIDS" The results indicated that the majority of students (85.9%) across all racial groups , regardless of gender, were willing to participate. Willingness to participate appears to be higher among men compared to women, which is statistically significant (p=0.004) as indicated by the results of the independent samples T-test in Table 3.3.
Willingness to participate among Indian men was lower than among Indian women, but the sample size for Indian men (n=9) was small and cannot be seen as a real difference.
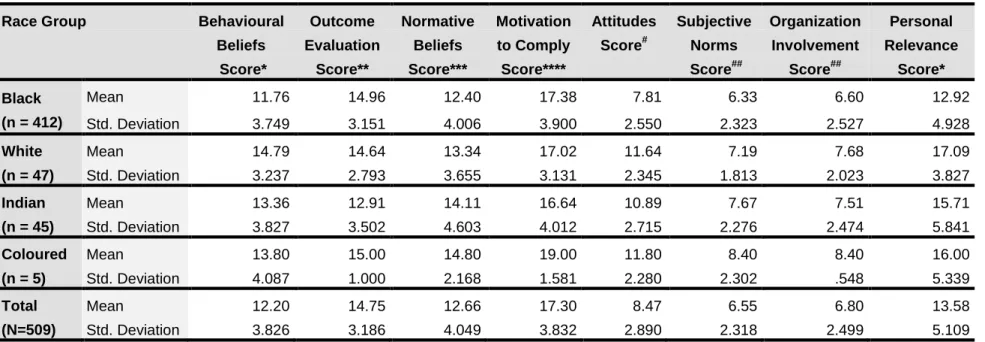
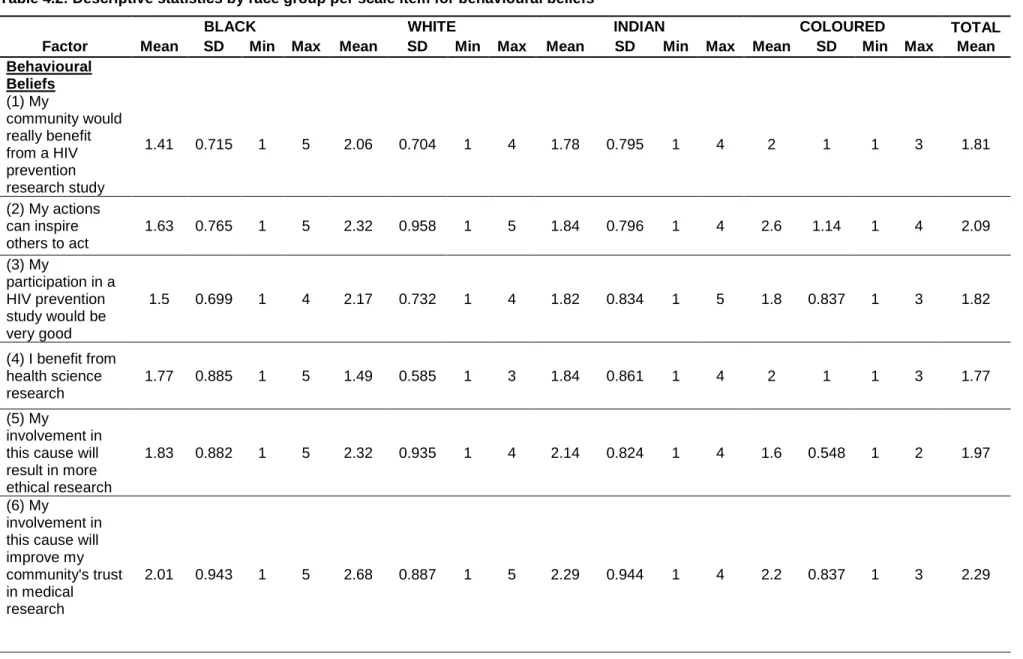
Descriptive statistics for factors and items of the CRIS
Black, white and Indian students agree that they would participate in HIV prevention research because it would help prevent HIV/AIDS. Black students “disagree” that time is a factor preventing participation in HIV prevention research, while white and Indian students provide a more neutral response. Black, white and Indian students all “agreed” that they thought it was a good idea to get involved in HIV prevention research.
Black students "agreed" that they would benefit from medical care related to HIV prevention research, but White and Indian students showed a more neutral response. Black, White, and Indian students "agreed" that most people important to them would approve of their involvement in HIV prevention research and support their interest in HIV prevention research. Both Black and Indian students "agreed" that it was liberating to get involved in an HIV prevention effort.
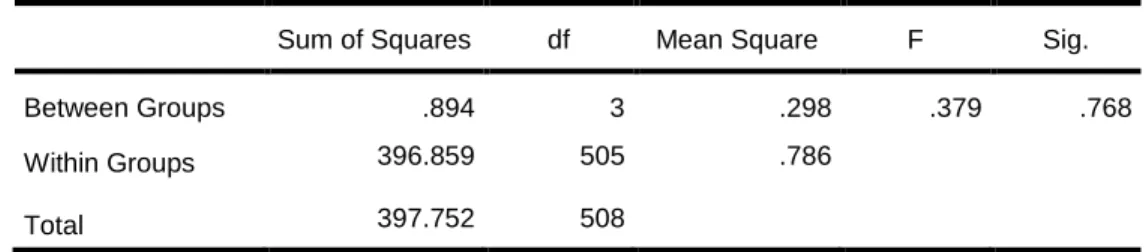
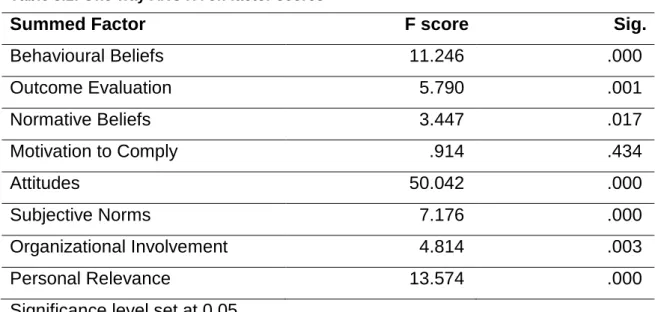
Analysis of variance (ANOVA) for factor scores
The comparison of scores between white and black students (p= . 1.000) and white and Indian students (p= 0.052) was not statistically significant. As illustrated in Table 5.2c, the Bonferroni test for multiple comparisons of normative beliefs scores illustrates that there was a statistically significant difference in scores between Black and Indian students (p = 0.042). As illustrated in Table 5.2e, the Bonferroni test for multiple comparisons of subjective norm scores illustrated that there was a statistically significant difference in scores between black and Indian students (p = 0.001).
As illustrated in Table 5.2f, the Bonferroni test for multiple comparisons for organizational involvement scores illustrated that there was a statistically significant difference in scores between Black and White students (p = 0.029). The comparison of scores between black and Indian students (p = 0.117) and white and Indian students (p = 1.000) was not statistically significant. As illustrated in Table 5.2g, the Bonferroni test for multiple comparisons for personal significance scores illustrated that there was a statistically significant difference in scores between black and white students (p < 0.001) and Indian students (p = 0.002).
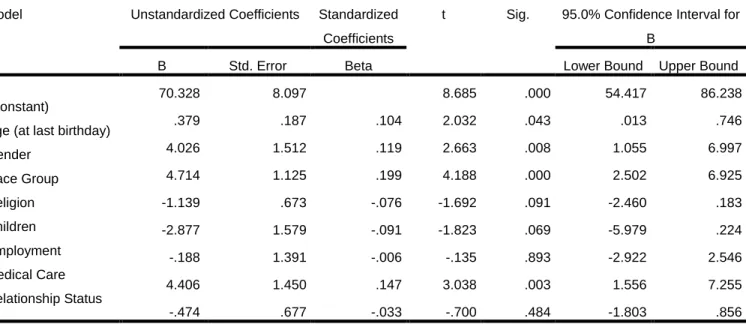
Multiple linear regression of demographic variables
The significance level for the selection of independent variables in this model was set at p<0.10. Therefore, age, gender, racial group, religion, children, and medical care were significant in this model. The significance level of the final model was set at p<0.05, therefore age, gender (male as reference category), race (black as reference category), medical care (private sector as reference category) and children are accepted. as predictors of behavioral intentions to participate in HIV prevention research.
Gender: the male category chosen as the reference category, as males were found to be more willing to participate in the independent sample t-test above. Race: the category black was chosen as the reference category since black students accounted for more than 50% of the study sample - Religion: the categories atheist/agnostic were grouped and chosen. Children: The reference category 0 was chosen to observe the effect of the presence of children on the BI score.
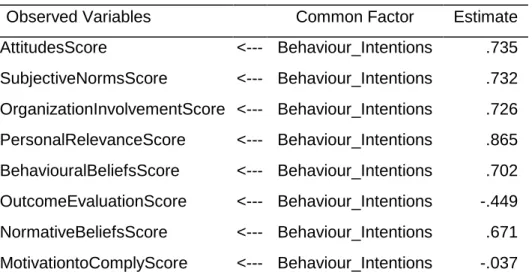
Confirmatory Factor Analysis (CFA)
AttitudesScore <--- Behaviour_Intentions .735 SubjectiveNormsScore <--- Behaviour_Intentions .732 OrganizationInvolvementScore <--- Behaviour_Intentions .726 PersonalRelevanceScore <--- Behaviour_Intentions .865 Behavior Intentions .865 Behavior Intentions--2 comeEvaluationScore <--- Behaviour_Intentions -.449 NormativeBeliefsScore <--- Behaviour_Intentions .671 MotivationtoComplyScore <--- Behaviour_Intentions -.037. The observed variables of attitudes, subjective norms, organizational involvement, personal relevance, behavioral beliefs, and normative beliefs correlated strongly with behavioral intentions. Motivation to comply had a poor relationship with behavioral intentions and is non-significant in the model.
Personal importance appears to be the strongest predictor of behavioral intention, with behavioral intention explaining 74.8% of the variance in personal importance. Behavioral intentions accounted for 54% of the variance in attitudes, 53.5% of the variance in subjective norms, 52.6% of the variance in organizational involvement, 49.2% of the variance in behavioral beliefs, 45.1% of the variance in normative beliefs, and 20.1% of the variance in evaluation of the result. The chi-square statistic estimates the magnitude of the discrepancy between the sample and the fitted model.
Summary
In terms of willingness to participate, the majority of students, regardless of race, were willing to participate in HIV prevention research and demonstrated positive behavioral beliefs about participation. In addition to assessing willingness to participate, the study examined factors that influenced behavioral intentions to participate in HIV prevention research using eight factors that comprise the CRIS. Students from all racial groups experienced approval and support from referent others regarding their involvement and participation in HIV prevention research.
To determine the influence of demographic variables on behavioral intentions to participate in HIV prevention research (defined by the 8 factors assessed in the CRIS), a multiple linear regression was performed. The multiple linear regression revealed that only age, gender, race, number of children, and where students accessed medical care influenced behavioral intentions to participate in HIV prevention research. However, these variables explained only a minor portion of the variation in behavioral intentions to participate in HIV prevention research.
Discussion
The CRIS was used to determine whether there were racial differences in factors influencing willingness to participate in HIV prevention research. Regarding subjective norms about participation in HIV prevention research, Black students differed significantly from Indian students (p=0.01). Both black and white students “disagree” that participating in HIV prevention research seemed risky, with Indian students showing a neutral response (“disagree/disagree”).
The personal importance of volunteering may influence behavioral intentions to participate in HIV prevention research. The higher the BI score, the less intent there was to participate in HIV prevention research (8). In addition to age, gender played an important role in willingness to participate in HIV prevention research.
Conclusions and Recommendations
Masculinities and patterns of condom use among rural young men in South Africa: a cross-sectional study. Safety and Efficacy Assessment of the HVTN 503/Phambili Study: A Double-Blind Randomized Placebo-Controlled Test-of-Concept Study of a Clade B-Based HIV-1 Vaccine in South Africa. Efficacy of Carraguard in preventing HIV infection in women in South Africa: a randomized, double-blind, placebo-controlled trial.
South Africa's health and health system: historical roots of today's public health challenges. Job satisfaction of professional nurses in South Africa: a comparative analysis of the public and private sectors. Risk perception and condom use among married or cohabiting couples in KwaZulu-Natal, South Africa.
Measurement Instrument
Online informed consent
Biomedical Research Ethics Committee (BREC) approval
UKZN Registrar Approval
Scientific approval from UKZN Postgraduate Education