UNIVERSITY OF KWAZULU-NATAL
A system dynamics model to explore the impact of S&OP processes within an FMCG organisation
By
Kenneth Moodley 213572725
A thesis submitted in fulfillment of the requirements for the Degree of Doctor of Business Administration (Leadership Studies)
Graduate School of Business & Leadership College of Law & Management Studies
Supervisor: Dr. Shamim Bodhanya 2015
i
SUPERVISOR’S PERMISSION TO SUBMIT FOR EXAMINATION
Date: 04 May 2015
Student Name: Kenneth Moodley
Student no: 213572725
Thesis Title: A system dynamics model to explore the impact of S&OP processes within an FMCG organisation
As the candidate’s supervisor, I agree to the submission of this thesis for examination.
The above candidate has satisfied the requirements of English language competency.
Name of Supervisor: Dr. Shamim Bodhanya
Signature:
ii
DECLARATION
I, Kenneth Moodley, declare that:
i. The research reported in this thesis, except where otherwise indicated, is my original research.
ii. This thesis has not been submitted for any degree or examination at any other university.
iii. This thesis does not contain other persons’ data, pictures, graphs or other
information, unless specifically acknowledged as being sourced from other persons.
iv. This thesis does not contain other persons’ writing, unless specifically acknowledged as being sourced from other researchers. Where other written sources have been quoted, then:
a) their words have been re-written but the general information attributed to them has been referenced:
b) where their exact words have been used, their writing has been placed inside quotation marks, and referenced.
v. This thesis does not contain text, graphics or tables copied and pasted from
the Internet, unless specifically acknowledged, and the source being detailed in the thesis and in the References sections.
Signature: _______________________
iii
ACKNOWLEDGEMENTS
First and foremost, I would like to thank GOD for giving me the strength, both mental and physical to undertake and complete this study.
I would sincerely like to thank Dr Shamim Bodhanya for his excellent mentorship, guidance and support during the course of this study. His pragmatic approach towards this study made it that much more valuable as I travelled this learning path, though I must admit the pressures I endured had me at my wits end.
My mom (Logambal Moodley) for raising me as a single parent for the majority of my life and giving me the proper grounding and values to realize my full potential. She has always been a source of encouragement in all endeavours that I have undertaken and for this, I am eternally grateful.
I would like to thank my wife Kreeshni for her patience and sacrifice during the study. For listening to my ideas and thoughts with great interest, nodding wisely and asking questions even though at times she probably wondered what I was going on about. For tolerating my grumpiness with inhuman patience and being my friend, confidante and soul mate.
My two precious daughters, Nikayla and Shenae who whilst did not fully understand what I was doing other than thinking it was pretty cool, that I am writing a book, were always very understanding of why I am studying and gave me the space to do so. Your hugs and kisses are what makes each day precious. I hope that this piece of work motivates both of you to achieve whatever your heart desires.
To my brother, Kevan Moodley for continuously being available to lend an ear during the course of this study. You have been a pillar of support for me throughout this journey and your support is immeasurable. To my sister in law, Farida Moodley, your love and support to both our family and myself is priceless. How can I also not mention my lovely niece, Natara the latest addition to our family whose smile is enough to encourage anyone.
iv To my close friends, Ramoshka Padayachee and Elen Naidoo, whose friendship spans almost four decades and who are always willing to give me unbiased feedback and ensure I stay grounded. To Terence Naidoo, my soccer buddy who listened to my rants virtually every week and gave encouragement.
Thanks to my fellow doctoral students (Bode & Nikita) for providing a sounding board whenever I hit a snag in the road on this journey towards completing the thesis as well as providing a forum in which we learnt, cried and complained together.
It is a pleasure for me to acknowledge the continuous encouragement and support shown by a host of family, friends and colleagues who, have not been mentioned specifically but played a role in supporting me.
To all of you, I say THANK YOU & GOD BLESS.
v
DEDICATION
I would like to dedicate this work to the memory of:
My late father, Krishna Moodley, for his calming influence in troubled times. He has been my North Star, ever constant, un-wavering and guiding me from above.
My late grandfather and grandmother who have instilled in me a humility and work ethic that forms the basis of my character.
My late cousin, Stanley Govender who has been more like a brother to me, who throughout his terminal illness still maintained a positive outlook and in all conversations would always, encourage me to persevere.
vi
ABSTRACT
The process of understanding how an organisation can continue its drive towards becoming more competitive was initiated by recognising that S&OP is one of the methodologies that underpinned the success of an organisation. It covered the operational, tactical and strategic aspects of the organisation and affected various functional teams. The impact S&OP has on the business is deemed significant for these reasons and hence ensuring that it functions as intended is vitally important to ensuring the business is making headway in the correct direction. The organisation spends large amounts of time and resources towards ensuring that the S&OP cycle is performed at the required level. It is therefore necessary to understand how effectively and efficiently the S&OP process is functioning and its impact on the organisation.
Given the complex nature of the problem and the volatile and uncertain environment, it was recognized that a suitable methodology is required to ensure these complexities are captured and understood in an adequate manner. The system dynamics methodology was identified as being suitable to this application due to its propensity to model complex problems, causal inter- relationships and feedback loops. This methodology was guided by the use of a case study approach with the empirical work being conducted within a large multinational FMCG (Fast Moving Consumer Goods) that is based within a developing country. The FMCG organisation on which this research study was conducted is known. However, due to there being a necessity to protect the confidentiality and anonymity of the organisation this approach was taken. The challenges that are faced in most developing countries are similar hence; the applicability and benefits of the study are still maintained.
The model building process involved the use of data collected primarily from the mental database of individuals via interviews and questionnaires, supported by data acquired from the numerical and written databases. This highlighted the various aspects of the S&OP process, which in turn was used to determine the sectors that would form the basis of the system dynamics model, namely: (1) organisational focus (2) demand (3) supply planning (4) factory (5) procurement (6) customer ordering (7) distribution (8) management information. The management information sector contained the business metrics that were identified as being important and hence any model developed or scenario analysis conducted would be evaluated based on these metrics.
vii Once the model was validated and ascertained to be fit-for-purpose, a number of policy interventions were identified and simulated. Analysis of the outputs led to the identification of two further interventions, which simulated the impact of implementing two policy changes versus one.
The outputs showed that optimizing the demand and customer ordering profiles would lead to the largest reduction in variability and have a positive impact on the business metrics that were selected.
It was further identified that to implement these policy interventions there would need to be a paradigm shift in the thinking of individuals and the organisation. This view was reached due to a few themes that emerged during the study, namely: (1) behavioural issues (2) conflicting Key Performance Indicators (KPI) (3) individuals having own views of which variables are endogenous versus exogenous (4) leadership behaviour leading to conflicting messages (5) misalignment between individuals and functional teams (6) thinking in silos.
viii
Table of Contents
SUPERVISOR’S PERMISSION TO SUBMIT FOR EXAMINATION ... i
DECLARATION ... ii
ACKNOWLEDGEMENTS ...iii
DEDICATION ... v
ABSTRACT ... vi
LIST OF FIGURES ... xiii
LIST OF TABLES ... xvi
ABBREVIATIONS AND ACRONYMS ... xviii
Chapter one: Introduction ... 1
1.1 Introduction ... 1
1.2 Motivation for this research ... 1
1.3 Setting of the study: A case study approach ... 3
1.4 Research design ... 4
1.5 Research tools ... 5
1.5.1 Mental database: ... 5
1.5.2 Written database: ... 5
1.5.3 Numerical database: ... 6
1.6 Problem Statement and Research questions ... 6
1.6.1 Research Questions ... 8
1.7 Outline of the thesis ... 8
1.8 Contribution ... 10
Chapter two: Literature Review ... 11
2.1 Introduction ... 11
2.1.1 Global & Supply Chain challenges ... 11
2.1.2 Demand variability challenges ... 12
2.2 Sales & Operations Planning (S&OP) ... 15
2.2.1 Sales & Operations Planning defined (S&OP) ... 16
2.2.2 THE Bullwhip Effect (BWE) ... 18
2.2.2.1 Principle 1: Time compression ... 20
ix
2.2.2.2 Principle 2: Information transparency ... 20
2.2.2.3 Principle 3: Control systems ... 20
2.2.2.4 Principle 4: Echelon elimination ... 20
2.2.3 Relevance of S&OP ... 20
2.2.4 S&OP shortcomings reviewed ... 22
2.3 System Dynamics ... 27
2.3.1 System Dynamics defined ... 29
2.3.2 Relevance of System dynamics ... 34
2.3.3 Further applications of System Dynamics ... 38
2.3.3 System dynamics shortcomings reviewed ... 39
2.3.3 Applicability of Research topic ... 41
2.1 Concluding remarks ... 42
Chapter three: Research Methodology ... 43
3.1 Introduction ... 43
3.2 System Dynamics ... 43
3.3 Case Study ... 47
3.4 System Dynamics Methodology ... 48
3.4.1 Step 1: Problem articulation or boundary selection ... 49
3.4.2 Step 2: Dynamic hypothesis ... 49
3.4.2.1 Data Collection ... 50
3.4.2.2 Process followed during field work ... 52
3.4.3 Step 3: Formulation ... 54
3.4.4 Step 4: Testing ... 56
3.4.5 Step 5: Policy formulation and evaluation ... 57
3.4 Concluding remarks ... 58
Chapter four: Building a working model ... 59
4.1 Introduction ... 59
4.2 Nomenclature and symbols used in the process of building SD models. ... 60
4.2.1 Stocks ... 60
4.2.2 Flows ... 60
x
4.2.3 Convertors ... 61
4.2.4 Connectors ... 61
4.2.5 Ghosting of stocks and convertors ... 62
4.3 S&OP within the business context ... 62
4.4 Formulating the system dynamics model ... 67
4.4.1 Area 1: Organisational focus ... 69
4.4.2 Area 2: Demand ... 74
4.4.3 Area 3: Supply ... 77
4.4.4 Area 4: Customer ... 93
4.4.5 Area 5: Management information system ... 101
4.4.5.1 Supply and Customer: ... 103
4.4.5.2 Demand: ... 104
4.4.5.3 Profitability: ... 106
4.5 Testing ... 110
4.6 Overview of the S&OP model – Base model ... 120
4.7 Concluding remarks ... 121
Chapter five: Results and Findings ... 122
5.1 Introduction ... 122
5.2 Model sector overview ... 123
5.3 Process followed in the use of the model to evaluate scenarios ... 124
5.3.1 Seven step scenario generation and evaluation process ... 124
5.4 Base model and scenario selection ... 125
5.4.1 Base model ... 126
5.4.2 Scenario evaluation process... 128
5.4.3 Scenario 1: The crystal ball ... 129
5.4.4 Scenario 2: Extra cash for investment ... 131
5.4.5 Scenario 3: If ever there is no working capital pressure ... 132
5.4.6 Scenario 4: Burden the supplier ... 134
5.4.7 Scenario 5: Customers and sales teams that listen... 135
5.4.8 Scenario 6: Gaining ultimate control ... 137
xi
5.4.9 Scenario 7: Increasing capacity and inventory ... 139
5.5 Holistic summary of outputs ... 141
5.6 Scenario 8: Infinite everything ... 146
5.7 Concluding remarks ... 148
Chapter six: Discussion of literature versus the case study ... 149
6.1 Introduction ... 149
6.2 Problem statement and research questions ... 149
6.3 Extracts from the literature review with discussions based on the outputs and learnings from the research study ... 150
6.3.5 System Dynamics ... 161
6.4 Concluding remarks ... 172
Chapter seven: Conclusions and Recommendations ... 173
7.1 Introduction ... 173
7.2 Revisiting the research questions ... 174
7.2.1 What are the casual relationships between S&OP policies and profitability of an organization?... 174
7.2.2 What are the organizational variables that have an impact on the effectiveness of S&OP within an organization? ... 177
7.2.3 How do current behavioural patterns affect the organisation when compared to an S&OP process that is implemented and followed rigorously? ... 179
7.2.4 What are the key factors that if leveraged can be used to ensure alignment between current practices and organisational policies and strategies? ... 180
7.2.5 Is system dynamics modelling a suitable tool that can be used to simulate this particular supply chain problem? ... 183
7.3 Contributions of this study ... 184
7.4 Limitations of this study ... 185
7.5 Recommendations to the organisation ... 186
7.5.1 Leadership ... 186
7.5.2 S&OP structure ... 187
7.5.3 Demand and customer profiles ... 188
7.6 Recommendations for future study ... 189
7.7 Considerations in the application of the system dynamics methodology ... 190
xii
7.7 Concluding remarks ... 191
REFERENCE LIST ... 193
APPENDIX 1: INFORMED CONSENT LETTER ... 202
APPENDIX 2: INTERVIEW SCHEDULE ... 205
APPENDIX 3: Helicopter view (5000 metre) showing further inputs ... 206
APPENDIX 4: Helicopter view (10 000 metre) showing core sectors ... 207
APPENDIX 5: Base model – Behaviour over time graphs ... 208
APPENDIX 6: Scenario 1 – Behaviour over time graphs ... 211
APPENDIX 7: Scenario 2 – Behaviour over time graphs ... 216
APPENDIX 8: Scenario 3 – Behaviour over time graphs ... 221
APPENDIX 9: Scenario 4 – Behaviour over time graphs ... 226
APPENDIX 10: Scenario 5 – Behaviour over time graphs ... 231
APPENDIX 11: Scenario 6 – Behaviour over time graphs ... 236
APPENDIX 12: Scenario 7 – Behaviour over time graphs ... 241
APPENDIX 13: Scenario 8 – Behaviour over time graphs ... 246
APPENDIX 14: System dynamics model ... 251
APPENDIX 15: System dynamics model equations ... 252
APPENDIX 16: Behaviour over time graphs drafted by individuals ... 257
xiii
LIST OF FIGURES
Description Page
Figure 1.1: Illustration of supply and demand ... 2
Figure 1.2: Typical end to end supply chain ... 2
Figure 2.1: Decreasing information content in moving from mental to written to numerical databases. ... 30
Figure 3.1: System Dynamics modeling process ... 45
Figure 3.2: Sources of information and relative quantity of information acquired per source... 47
Figure 3.3: Opportunities for building confidence in models ... 56
Figure 4.1: Strategic and operational customer, demand and supply relationships ... 63
Figure 4.2: Helicopter view (5000 metre) showing further inputs ... 64
Figure 4.3: Helicopter view (10 000 metre) showing core sectors ... 65
Figure 4.4: System Dynamics modeling process ... 66
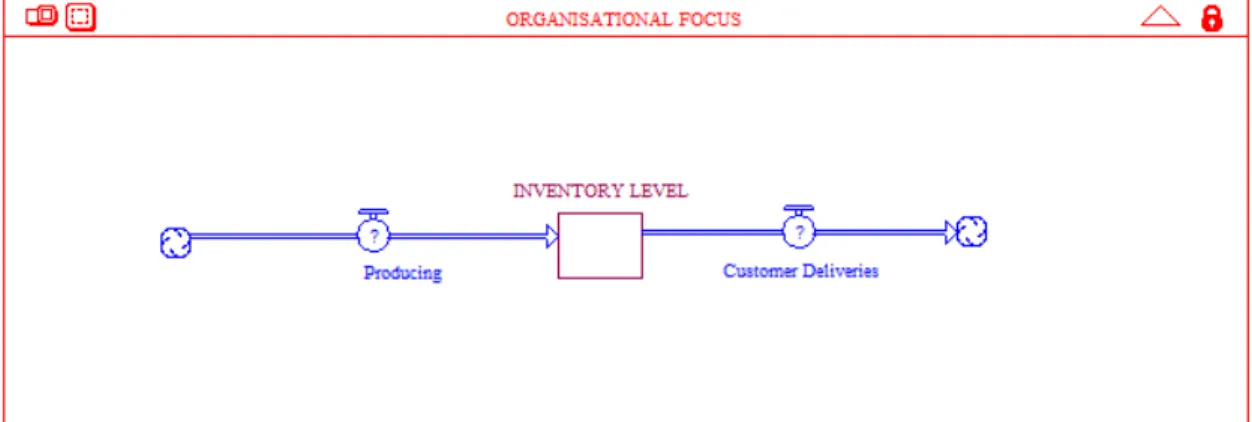
Figure 4.5: Organisational focus and core business activity ... 67
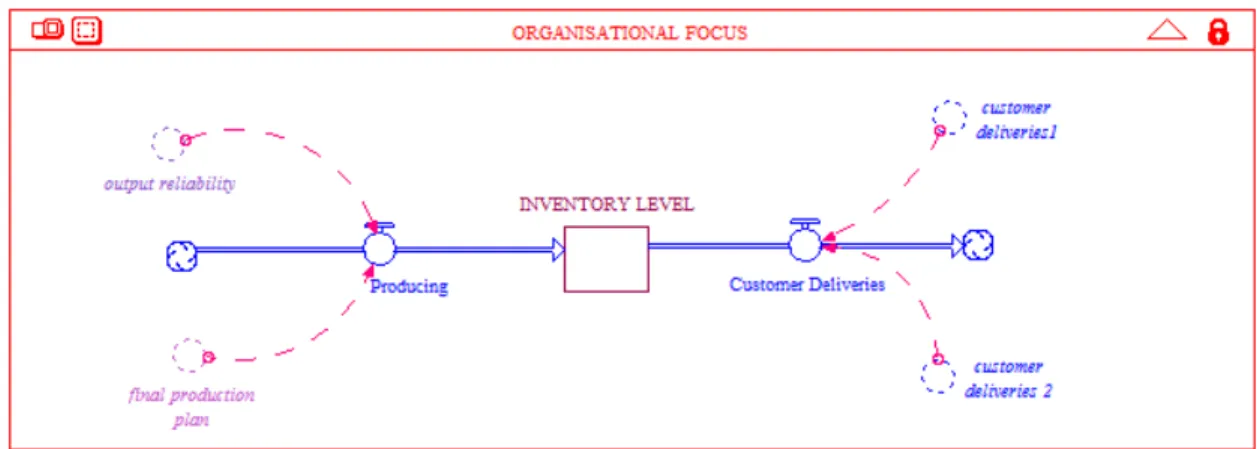
Figure 4.6: Organisation focus overview with inputs ... 69
Figure 4.7: Producing to stock inflow ... 70
Figure 4.8: Inventory levels and customer deliveries ... 72
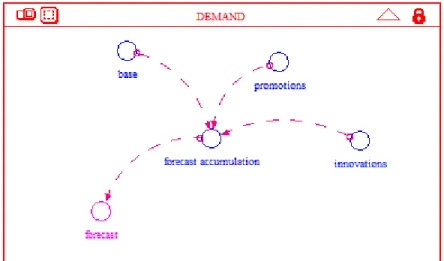
Figure 4.9: Demand sector ... 74
Figure 4.10: Inputs into the forecast accumulation ... 75
Figure 4.11: Simple formulation for forecast accumulation and forecast ... 76
Figure 4.12: Factory sector... 77
Figure 4.13: Capacity calculation explained ... 77
xiv
Figure 4.14: Factory output reliability ... 79
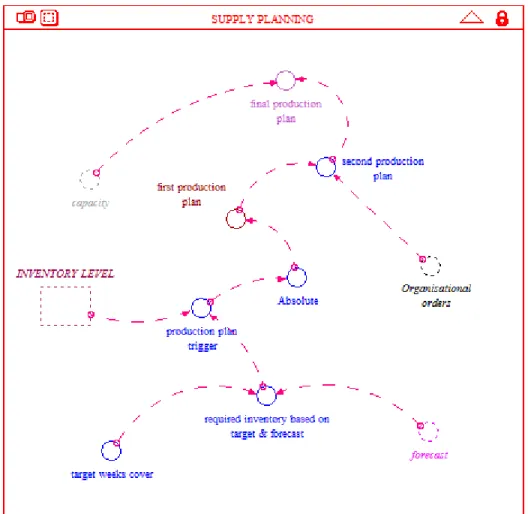
Figure 4.15: Supply Planning made simple ... 80
Figure 4.16: Basis of supply planning – target weeks cover and forecast ... 81
Figure 4.17: When is a production plan triggered? ... 82
Figure 4.18: Evolution of the production plan ... 83
Figure 4.19: The final production plan ... 84
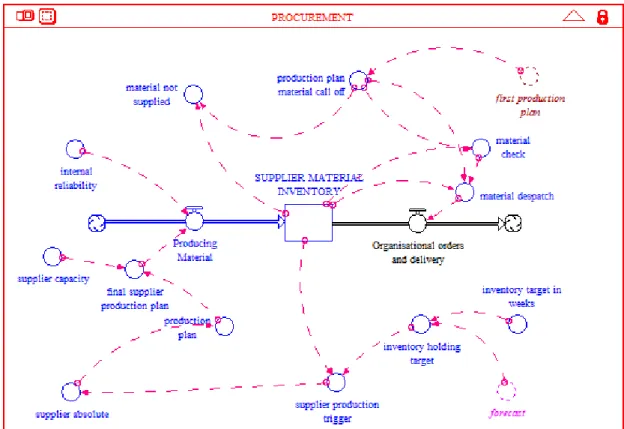
Figure 4.20: Procurement sector ... 85
Figure 4.21: Supplier inventory holding target ... 86
Figure 4.22: Supplier production plan trigger ... 87
Figure 4.23: Reaching the final production plan ... 88
Figure 4.24: Understanding the producing inflow ... 89
Figure 4.25: Material check before dispatch ... 90
Figure 4.26: Material dispatch ... 91
Figure 4.27: Organisational orders and delivery outflow ... 92
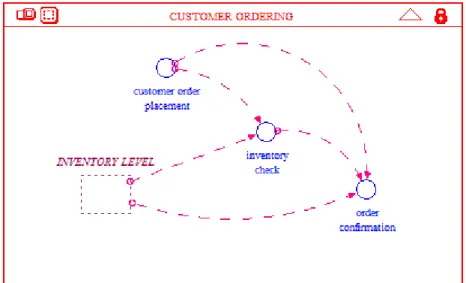
Figure 4.28: Customer ordering ... 93
Figure 4.29: Initial Customer orders and inventory checks ... 94
Figure 4.30: Order confirmation ... 95
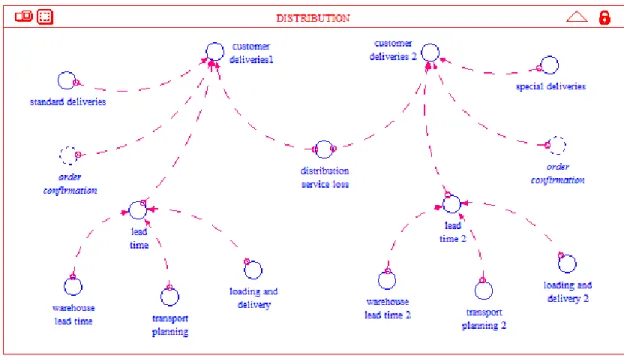
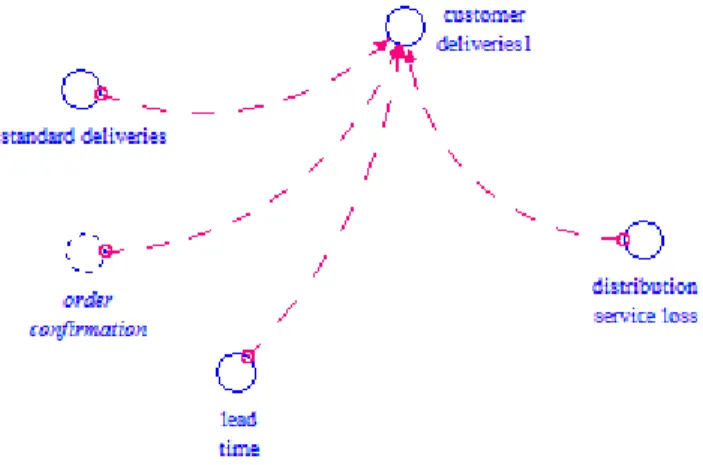
Figure 4.31: Inside the distribution sector ... 96
Figure 4.32: Understanding the lead time in a standard situation ... 97
Figure 4.33: Customer deliveries under standard conditions ... 98
Figure 4.34: Understanding the lead time in a special situation ... 99
Figure 4.35: Customer deliveries under special conditions ... 100
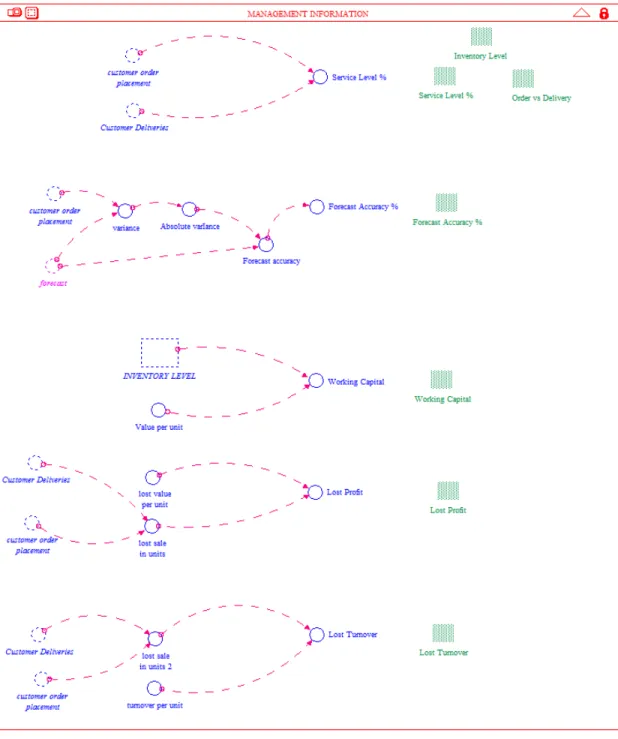
Figure 4.36: Organisational management information system ... 102
Figure 4.37: Customer service levels ... 103
Figure 4.38: Forecast variance ... 104
xv
Figure 4.39: Understanding the forecast accuracy metric ... 105
Figure 4.40: Working capital explained ... 106
Figure 4.41: Lost sales calculation ... 107
Figure 4.42: Lost profit calculation ... 108
Figure 4.43: Lost sales ... 108
Figure 4.44: Lost turnover calculation ... 109
Figure 4.45: Forecast accuracy comparison: Historical data vs model data ... 111
Figure 4.46: Historical service level % versus model generated service level % ... 112
Figure 4.47: Mental model generated service level profile ... 113
Figure 4.48: Comparison of actual Inventory levels to required inventory levels ... 114
Figure 4.49: Forecast accuracy – 10 year view ... 118
Figure 4.50: Overview of the S&OP model showing sectors, causal relationships and feedback loops ... 120
Figure 5.1: S&OP framework within the organisation ... 123
Figure 5.2: Illustration of base model vs scenario comparison ... 129
Figure 5.3: Inventory level versus customer orders received ... 133
xvi
LIST OF TABLES
Description Page
Table 4.1: Source of behaviour over time graphs ... 112
Table 4.2: Source of behaviour over time graphs ... 113
Table 5.1: Inputs into base system dynamics model ... 126
Table 5.2: Outputs of the base model ... 127
Table 5.3: Metric categorisation ... 128
Table 5.4: Outputs of scenario 1: The crystal ball ... 130
Table 5.5: Comparison of outputs – base model versus scenario 1 ... 130
Table 5.6: Outputs of scenario 2: extra cash for investment ... 131
Table 5.7: Comparison of outputs – base model versus scenario 2 ... 131
Table 5.8: Outputs of scenario 3: if ever there is no working capital pressure ... 132
Table 5.9: Comparison of outputs – base model versus scenario 3 ... 133
Table 5.10: Outputs of scenario 4: Burden the supplier ... 134
Table 5.11: Comparison of outputs – base model versus scenario 4 ... 134
Table 5.12: Outputs of scenario 5: Customers and sales teams that listen ... 136
Table 5.13: Comparison of outputs – base model versus scenario 5 ... 136
Table 5.14: Outputs of scenario 6: gaining ultimate control ... 138
Table 5.15: Comparison of outputs – base model versus scenario 6 ... 138
Table 5.16: Outputs of scenario 7: increasing capacity and inventory ... 139
Table 5.17: Comparison of outputs – base model versus scenario 7 ... 139
Table 5.18: Summary of Outputs ... 141
Table 5.19: Explanation of colour coding used in Table 5.18 ... 142
xvii
Table 5.20: Ranking of interventions ... 143
Table 5.21: Inputs into “infinite everything” model ... 146
Table 5.22: Outputs of scenario 8: infinite everything ... 147
Table 5.23: Comparison of outputs – base model versus scenario 8 ... 147
xviii
ABBREVIATIONS AND ACRONYMS
VUCA Volatile, Uncertain, Complex and Ambiguous APICS American Production & Inventory Control Society BWE Bullwhip Effect
CLD Causal Loop Diagram SCM Supply Chain Management S&OP Sales and Operations Planning FMCG Fast Moving Consumer Goods SKU’s Stock Keeping Units
COM Cores Operating Margin A&P Advertising & Promotions KPI’s Key Performance Indicators FA Forecast Accuracy
FB Forecast Bias SL Service Level CU Currency Unit
1
CHAPTER ONE: INTRODUCTION
1.1 INTRODUCTION
The pressures facing the modern day corporate organisation are ever increasing and if any business intends on thriving, then it must continue to improve its competitiveness and to stay relevant. In order to achieve this the needs of the customer must be satisfied in an effective and efficient manner. For any FMCG (Fast Moving Consumer Goods) organisation to meet the challenge it is necessary for it to have robust processes that is able to predict what the customer demand would be and to ensure the organisation is able to supply or satisfy these needs. The S&OP (Sales &
Operations Planning) process is one of the techniques used to ensure that demand and supply is understood and planned for. An effective S&OP process underpins the organisational strategy and therefore has an impact on the business, which needs to be understood.
1.2 MOTIVATION FOR THIS RESEARCH
In order to survive in the global business environment it is critical for organisations and individuals to be able to reinvent themselves to ensure they remain competitive. Being competitive in the business world means, the ability to give the customer what they want, when they want it, at the right price and quality. Organisations must do all this whilst being socially responsible in terms of doing what is right for individuals, communities and the environment. Naturally, this is easier said then done given the modern day challenges that businesses face. Global economic changes have led to a volatile economic environment in which demand changes results in instability in the Supply Chain (Rabeli, Sarmiento, & Jones, 2011). This complex environment in which leaders have to consider all factors impacting on business means that there is a need to also consider social systems if leaders indeed believe that people and their unique dynamics contribute to an organisation attaining the competitive edge.
2 A key focus in achieving competitiveness is that of Sales and Operations Planning (S&OP) in which the business focuses on balancing supply and demand of its products. Effective Supply Chains are typically those that are able to supply the correct product to the correct customer at the correct price and quality (Huang et al, 2007). Figure 1.1 illustrates that supply and demand is a bi- directional process and are overseen by the organisation’s key stakeholders or board of directors who are responsible for setting overall strategic direction.
STAKEHOLDERS/ORGANISATION BOARD
SUPPLY DEMAND
Figure 1.1: Illustration of supply and demand
The output of the S&OP process is used to guide the total supply chain, seen in Figure 1.2, to ensure customer demand is met.
SUPPLIERS PRODUCTION DISTRIBUTION CUSTOMERS
Figure 1.2: Typical end-to-end supply chain
However, when there is oscillation in demand, the supply chain suffers from a phenomenon called the Bullwhip Effect. The Bullwhip Effect is defined as the amplification in the fluctuation of orders, as we move upwards in a supply chain from retailer to the manufacturer to the supplier (Bhattacharya & Bandyopadhyay, 2011). Nevertheless, it is important to note that oscillation is driven by both endogenous and exogenous factors. Policies and decisions made by the organisational board (Figure 1.1) also contribute to demand fluctuations.
There therefore exists a need for organisational leaders and managers to understand the impact of policies and decisions to ensure that decisions are made for the benefit of the organisation as a whole.
3
1.3 SETTING OF THE STUDY: A CASE STUDY APPROACH
The study was guided by the use of a case study approach by using an existing problem within an FMCG organisation. The large multinational FMCG organisation is based in a developing country and has multiple product categories that it produces and sells to customers both locally as well as the export market. Whilst S&OP is in use across a number of different FMCG organisations, the empirical work was conducted in one specific organisation within a specific product range.
However, the organization in question has a large number of product categories and SKU’s (Stock Keeping Units) which would make building the model onerous. It is therefore more practical to apply system dynamics modeling to the problem within a specific product category and thereby ensuring that the boundaries, within which the problem resides, can be more readily identified.
This also ensured that qualitative data collection from various individuals could be carried out with a smaller cross functional group versus individuals across multiple categories. It must be noted that the organisation in question wanted to protect its anonymity and hence no mention is made of the country. What has been mentioned is that it is based within a developing country.
The organisation within which this study was completed had specific requirements around protecting its anonymity and ensuring that none of the information contained in this thesis would reveal its identity.
The researcher chose to conduct this study within an organisation, which had a need to understand the impact of S&OP within the business. The intent was therefore to use system dynamics as a methodology to understand the impact that S&OP had on the overall business performance. It is worth pointing out that system dynamics is a methodology that is used to model specific problems within specific environments and hence the study is not comparative in nature. It was rather focused on using the system dynamics approach to understand the current scenario, followed by the identification and evaluation of alternatives that could improve the current scenario.
4
1.4 RESEARCH DESIGN
Given the complex nature of the problem that was identified and the limited work done in the use of qualitative modelling techniques, a systems thinking approach was selected as being pertinent for application. The methodology chosen is known as system dynamics and was used to guide the research design approach used. Systems thinking is a relatively new philosophy that is able to view problems in a more holistic manner versus the sometimes narrow approach that is seen (Sterman, 2000). Decision makers typically use conventional modelling approaches to divide a problem into its basic components and to then analyse and understand these parts. The number of practical applications of system dynamics to supply chain related problems is limited (Cagliano, DeMarco, Rafele, & Volpe, 2010).
System dynamics recognizes that there are many causal relationships and feedback loops that play a vital role in the outputs of the system and hence needs to be understood. In the context of the current study it is often found within the organisation that improvements are implemented but the results are not as expected. One of the possible reasons for this is that in dealing with complex problems it is not easy to identify the root cause, which once fixed will result in the entire problem dissipating. This type of problem will benefit more from a systems thinking approach that embraces a holistic view and recognizes that all elements and individuals of a system are interconnected (Sterman, 2001). With this in mind the Sterman five step methodology was utilised.
System dynamics considers the impact that individual behaviour has on the system. Akkermans
& Dellaert (2005) state that one needs to question how human decision making is included in the modelling of problems.
The system dynamics approach that was employed placed emphasis on the qualitative aspects of the methodology and hence had a high reliance on the mental database of stakeholders to gather information. This was done by ensuring intensive engagement was conducted with relevant individuals by making use of questionnaires and multiple interview sessions. This was additionally supported by the analysis of data gathered from both the numerical and written databases. These sources of data were used to firstly gain an understanding of the problem within its environment and then aided in the construction of stock and flow diagrams.
5 These diagrams were then used to build a computer simulation model using the iThink software.
Once the model underwent the testing process and was deemed fit-for-use, various policy interventions were evaluated and recommendations made.
1.5 RESEARCH TOOLS
The approach employed revolved around data collection from the three databases, namely: (1) Mental (2) Written (3) Numerical, though the mental database was the primary source of information.
1.5.1 Mental database:
Interviews were conducted with identified individuals who represented the various functions that played a role within the S&OP cycle. These interviews were guided by the use of a questionnaire, which contained open-ended questions. This was purposefully done to elicit discussion and insights that would otherwise not be obtained. This resulted in the many opinions and perspectives of stakeholders being captured to ensure an understanding of the problem, the inherent relationships and complexities were understood.
1.5.2 Written database:
The various policies that played a role within the S&OP process were examined and led to:
• An understanding of the manner in which the S&OP process was meant to work.
• The ability to ask follow-up questions during the interview process which led to further insights and understanding. This was generally done if an interviewee mentioned a difference in reality versus the policies.
• The identification and quantification of certain variables, which was included within the model.
6 1.5.3 Numerical database:
The underlying inputs into the S&OP process were obtained from the numerical database of the organisation and it hence seemed reasonable to use this data as well. The data gathered led to the behaviour over time graphs that were used throughout the study and was further utilised in comparing the data and behaviour over time graphs obtained during the interview process.
These sources of information were examined and led to the development of both the stock and flow diagrams, as well as the system dynamics model on the iThink software. The above was supported by the existing literature that was studied during the course of this study and informed some of the decisions made.
1.6 PROBLEM STATEMENT AND RESEARCH QUESTIONS
Competition in the current business environment is more rife then ever before. In the past twenty years or so developing countries has seen a proliferation of multinational FMCG organisations enter the market. These organisations have to compete to influence the consumer to choose their product over their rivals. Whilst it is acknowledged that in order to do this, organisations have to ensure that they are able to beat their rivals on cost and quality, the reality is that consumers have become more demanding and expect to be able to purchase what they want, when they want. They further want convenience and hence do not want to be told, “Sorry we are out of stock but if you come back in a few days we will have what you want back on shelf”. Should a retailer not have the stock on the shelf when required, there is a high probability that the consumer will go to another store or purchase a substitute product. Bijvank & Vis (2011) state that if a consumer does not receive the product required the sale is lost. In fact, approximately 15% of consumers only will wait for the item required (Gruen et al, 2002). This means a loss of revenue for both the retailer and product supplier. The increased competition has further led to an increase of products and hence choice for the consumer.
The actuality is that having strong brands is not enough to guarantee a sale or consumer loyalty.
The tendency is therefore for organisations to become more customer and consumer centric and to put the consumer at the heart of the organisation to ensure success. The intent of this is to ensure that On Shelf Availability (OSA) is higher than that of the competition, which usually means that
7 the OSA should be consistently above 95%. A major contributor to lower OSA and hence sales is demand oscillation and the bullwhip effect (Yang, Proudlove, & Spring, 2004).
The starting point to ensuring that the correct products are on shelf is the organisations S&OP processes and policies. A common dynamic, as expressed earlier that can be commonly witnessed within organisations is demand oscillation, which leads to inefficiencies, and ultimately out of stocks and lost sales revenue. This further complicates the organisations ability to balance supply and demand using the S&OP process. The ability of an organization to accurately predict customer demand is a key success factor to ensuring that the organization is able to consistently have its products or services readily available (Godsel, Diefenbach, Clemmow, Towil, & Christopher, 2011). Whilst the external environment does contribute to demand fluctuations, internal policies, decisions and behaviour also contribute towards creating this imbalance between supply and demand. System dynamics states that the boundary of the model needs to be determined in a manner in which exogenous factors are included within the model boundaries. This therefore transforms exogenous factors into endogenous factors, thus ensuring a feedback loop (Morecroft, 2010).
Very often, when there are inaccuracies in demand, and oscillations are common place, individuals throughout the organisation make short term decisions to try and satisfy customers as well as to pursue internal business targets. This is known as the bullwhip effect and is caused by both operational and behavioral actions within an organization (Bhattacharya & Bandyopadhyay, 2011). Forrester (1986) states that System Dynamics modeling is a decision making tool to enable managers to understand the impact of their decisions in the short and long term. Not understanding the dynamics and relationships between the various factors normally results in the organisation getting it wrong. Some of the symptoms of this would typically be higher working capital, implementation of overtime and additional shifts, incorrect product mix, additional warehousing and transportation costs, additional production costs, etc (Kim, Jun, Baek, Smith, & Kim, 2005). This behaviour is further perpetuated by individuals being focussed on driving local functional improvement vs overall business improvements (Repenning & Sterman, 2001).
Essentially then, the aim of this research was to explore the impact of S&OP processes within an FMCG organisation by using the system dynamics modelling approach.
8 1.6.1 Research Questions
The aim of the study was to seek to address the problems and gaps highlighted above by answering and identifying solutions to the following questions and statements using a system dynamics simulation modelling approach. Hence, the research questions guiding this study was:
1. What are the casual relationships between S&OP policies and profitability of an organization?
2. What are the organizational variables that have an impact on the effectiveness of S&OP within an organization?
3. How do current behavioural patterns affect the organisation when compared to an S&OP process that is implemented and followed rigorously?
4. What are the key factors that if leveraged could be used to ensure alignment between current practices and organisational policies and strategies?
5. Is system dynamics modelling a suitable tool that can be used to simulate this particular supply chain problem?
1.7 OUTLINE OF THE THESIS
Chapter One comprises of this introduction to this study and starts of by providing a brief overview of the rationale for the research and the research context. It then goes on to describe the case study that this study revolves around followed by the manner in which the study was designed and the research tools utilised. Lastly, the problem statement, research questions guiding the overall study and overview of the contributions are described.
Chapter Two contains the literature review that is relevant and contributed to this study. It starts off by explaining the current global and supply chain challenges, with specific details on the demand variability challenges being faced by organisations being discussed. The Chapter then leads into defining S&OP, the bullwhip effect, why S&OP is relevant and the current shortcomings of S&OP. Once this is understood, the Chapter delves into defining system dynamics and explores the applications and relevance of system dynamics. Chapter Two concludes by discussing the shortcomings of system dynamics and the applicability of system dynamics to this study.
9 Chapter Three starts of by giving an overview of the approach adopted by the researcher to investigate the impact that S&OP has on the organisation selected, using the system dynamics methodology. An overview of the case study to which system dynamics has been applied is included. The Chapter then goes into the detail of explaining what was done within each of the steps of the Sterman five step process. It covers the sources of data together with the strengths and limitations of the data sources, with an explanation of how the three data sources (mental, written
& numerical database) was used and the interlinks between them. It also delves into an explanation of the reliability and testing techniques used to prove if the model developed is plausible and fit- for-use as well as touch on the ethical considerations of the study.
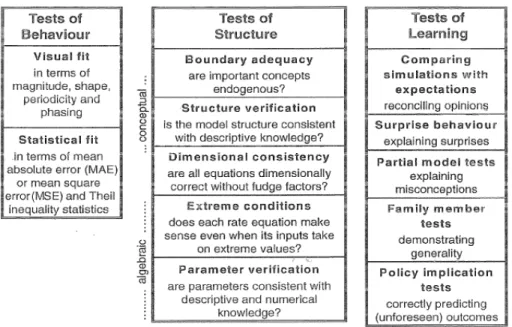
Chapter Four explains the actions taken in building the model using the iThink software, followed by the testing that was conducted of the base model. The Chapter starts of by explaining the system dynamics symbols utilised. It then goes on to give an explanation of the S&OP process within the context of the organisation. This was the start of the process as it translated into the 5 000metre and 10 000metre views which led to the identification of the eight sectors, namely (1) organisational focus (2) demand (3) factory (4) supply planning (5) procurement (6) distribution (7) customer ordering (8) management information. The sectors were then captured within the simulation model with the variable inputs originating from the three sources of data mentioned previously. The testing techniques employed and the outputs achieved are discussed with this Chapter as well, with the testing techniques falling into three categories, namely (1) tests of behaviour (2) tests of structure (3) tests of learning. The Chapter then culminates in an overview of the base model.
Chapter Five contains the details behind the actual use of the model developed in Chapter Four.
The model sector overview is given followed by the process followed in making use of the model to select and evaluate the alternative policy interventions identified. The scenario evaluation process was explained together with an overview of the outputs and ranking of the scenarios evaluated. The Chapter closes with the evaluation of a scenario which whilst not necessarily practical evaluates the outcome if all resources and variables were increased.
Chapter Six seeks to discuss the linkages between the literature covered in Chapter Two with the case study used. The intent is to show the connections between the literature reviewed and the results achieved using the system dynamics approach. Extracts from the literature review
10 conducted in Chapter Two was discussed in conjunction with the outputs and learnings from the case study approach used.
Chapter Seven brings the study to a close by discussing the conclusions and recommendations that emanated from the study. The Chapter starts of by revisiting the research questions, considering the contributions and limitations of the study. It then goes on to providing recommendations to the organisation as well as recommendations for future study. Attention is then given to the considerations that must be considered in the application of system dynamics.
1.8 CONTRIBUTION
The contributions of this study can be summarised by the following bullet points:
• It was noted earlier in this proposal as well as literature studied that mention is mostly made of quantitative modelling and considerations within the supply chain environment (Kristianto, Ajmal & Helo, 2011). This study has further demonstrated that system dynamics can be applied within a supply chain environment and is able to adequately model the problem.
• The use of system dynamics as a methodology led to an in-depth understanding of the problem within the context of its environment and the impact that decisions and policies have on the business.
• Further demonstrating that system dynamics can be used as a business tool to drive improvements and ensuring alignment between policies, procedures and decisions to ensure organisational profitability
• Use of the model as a platform to improve and change individual behaviour to ensure that decisions made result in sustainable medium to long term benefits as well.
11
CHAPTER TWO: LITERATURE REVIEW
2.1 INTRODUCTION
2.1.1 Global & Supply Chain challenges
Global economic changes as led to a volatile business environment in which demand changes results in instability of the supply chain, which ultimately results in the supply chain being inefficient and ineffective (Rabeli, Sarmiento & Jones, 2011). There is a general feeling of uncertainty as to what will happen next amongst SC people with the current global economy and difficulties being a source of concern (Daugherty, Gawe & Caltagirone, 2010). These factors have led to organisations looking for quick fixes instead of really fixing the root cause. A successful supply chain is one that is managed in a manner, which breaks down barriers between internal and external stakeholders (Shukla, Garg & Agarwal, 2011). Huang et al (2007) further stated that effective supply chains are those that are able to supply the right product, to the right customer, at the right price and at the right quality. Given the current climate changes that we face the challenge to reduce an organisations carbon footprint is also a key business driver. Due to today’s consumer being more discerning with regards to which brands and organisations they support, organisations have to ensure they understand and satisfy all consumer needs. Social networking also results in customer/consumer behaviour, which results in the supply chain having to be more reactive.
Effective and efficient supply chain management reduces lead times, costs, improves customer service and improves overall competitiveness (Shukla, Garg & Agarwal, 2011). The trend is to integrate the total supply chain resulting in one global platform as well as technological tools to increase organisational effectiveness. Organisations need to be agile to meet the customers changing needs and is a critical requirement in complex global supply chains. The balancing act however is to still be cost effective, agile, adaptable and aligned to the customer.
12 Martinez-Olvera (2008) discussed that current manufacturing competition goes beyond single companies and becomes a challenge for supply chains to become more efficient and effective than their competitors. The service provided to the end customer is determined by the effectiveness and efficiency of the cooperation of all of the companies in the supply chain. Fixson (2005) states that this requires each partner within the supply chain to simultaneously take into account the product and process dimensions and to properly realign their structural elements. This will ensure for a seamless operation both with internal functions and with external partners.
These challenges have resulted in supply chain management receiving ever growing interest (Stadtler, 2005). The reason for this might be that it has so many facets and that the tasks of accomplishing the aims of supply chain management are so demanding that it is more an ongoing endeavour then a single short term project. The ultimate aim of the supply chain and hence the organisation is to improve competitiveness of the organisation as a whole. This is achieved by directing the company into a sustainable, strategic position compared to its competitors (Stadtler, 2005). This can only be done if the entire structure or system is understood properly. Factors that were thought to not be interrelated are often connected and a single cause can be the reason for a large number of varied effects (Goldratt, 2004). The need for understanding of the system is further driven by decision making and policies contributing to instability and fluctuations (Rabeli, Sarmiento & Jones, 2011). Given the need for any organization to meet customer requirements they face a task that cannot be taken lightly, as failure to do would be detrimental to the long term profitability and competitiveness of the organization.
2.1.2 Demand variability challenges
It is often assumed that excess or unsatisfied demand is backordered. This is however far from reality as studies show that unfulfilled demand is lost or an alternative item or product is purchased (Bijvank & Vis, 2011). Gruen et al (2002) stated that only 15% of customers who experience a stock out would wait for the item to be on shelves again. The balance will either buy an alternate product, visit another store or do not make any purchase at all. In a changing world with customers becoming more discerning, the organisation that is able to get their product on shelf in full and on time will inevitably be more competitive, resulting in a higher market share and profitability. In
13 order to accomplish this organisations have to have the ability to accurately forecast customer demand and ensure the supply side of the business is adequately equipped to meet demand requirements. This however is easier said then done, as forecasts are invariably wrong and leads to the organisation experiencing what is known commonly as the bullwhip effect.
Lee et al (1997) established five possible sources that may lead to the bullwhip effect:
1. The use of demand forecasting
Organisations and their leaders have to ensure that they focus its resources towards satisfying customers within a VUCA (Volatile, Uncertain, Complex and Ambiguous) environment with limited resources. To accomplish this the organisation must be able to predict or forecast what the customer wants. Various demand forecasting techniques exist with each having a varying degree of complexity and application. Variability in any process is common place, with an organisation experiencing variability within the demand forecast as well. The amount of variability experienced is largely dependent on the forecasting technique utilised as well as the nature of the customer demand and ordering process that an organisation follows (Chen, 2000).
2. Non-zero lead time
Across the business, there exists a multitude of activities and processes that need to be completed to ensure a product reaches the consumer. Each of these results in a certain amount of time being taken to complete and contributes towards the overall lead time. The lead times that exist has a direct correlation towards the variability experienced, with the longer the lead times the larger the variability observed (Sun & Ren, 2005).
3. Batched orders
Batched orders describes the process of consolidating multiple orders into a single batch for production. This would lead to the lead time for the first order placed being longer then the last order placed from order placement to manufacture. The organisation in which this study has been conducted produces to stock versus following a batched order process and maintains an inventory level that is in line with its inventory holding policy.
14 4. Rationing game under shortage
This general occurs when the customer demand exceeds the supply, which could be constrained for a variety of reasons such as over ordering versus forecast or capacity constraints. In this situation, the organisation attempts to apply some sort of fair share principle in which the available inventory is shared amongst the various customers, resulting in a rationing process. Note however, that the organisations can decide to give a higher weighting to a customer that is deemed more important.
5. Price fluctuations and promotions
It has been found that unforeseen price fluctuations and promotions contributes towards increasing the bullwhip effect. Recent studies has shown that price fluctuations are one of the primary reasons for the bullwhip effect and the inefficiencies that arise as a result (Gavirneni, 2006). The context of this study is set within an FMCG organisation in which there exists a stock holding policy that is dependent on the forecast. Based on this dependency any fluctuations versus the original forecast will result in the incorrect inventory levels being available.
The Sales and Operations Planning (S&OP) process seeks to ensure that an organisation has sufficient capacity and capability to meet the demand requirements of the customer. Given that the demand forecast signal is the starting point, the importance of accuracy cannot be underestimated. Sun & Ren (2005) states that different forecasting methods play a role in supply chain management. The smoother the forecast, the smaller the increase in variability will be.
Uncertain and changing demands further leads to either lost sales or increasing inventory holding to buffer against uncertainty (Kim, et al 2005).
15
2.2 SALES & OPERATIONS PLANNING (S&OP)
In the complex and highly competitive environment, that organisations operate within the strategy is to still be cost effective, agile, adaptable and aligned to the customer. In order for supply chains within any organisation to be resourceful, one of the basics that need to be in place is an efficient S&OP process. It provides for a highly structured approach to ensure alignment across all functions and for the business to have a single view of the targets and goals. S&OP typically looks at the zero to 24 month horizon and seeks to ensure that if this view is understood then the business and supply chain can dedicate the correct resources towards meeting the targets (Ross, 2003).
Supply chains will face a multitude of challenges whilst attempting to ensure the correct resources are dedicated towards the goals. These resources will need to be ably supported by the organisation and as such, the correct policies and procedures need to be entrenched within the organisation.
Strategic and sustainable sourcing of materials is a key competitive advantage to any organisation.
In order to gain this advantage it is imperative that organisations seek to develop long term strategic relationships with key suppliers in order to secure a sustainable supply of material (Daugherty, Gawe & Caltagirone 2010). In order to achieve this, a robust S&OP process with the correct policies is required to ensure long term planning effectiveness.
Obsolete inventory is a reality within the supply chain and decision makers often tend to be of the opinion that it is a necessary evil. Focus is therefore given on how to get rid of the obsolete stock but the time and energy would be better spent on determining how to prevent obsolete stock (Pay, 2010). Obsolescence is in effect the symptom of a supply chain that needs to carry high inventory to cater for business volatility in demand (Daugherty, Gawe, & Caltagirone, 2010). S&OP is one of the primary ways that this uncertainty can be understood, controlled and reduced. S&OP seeks to integrate the supply and demand aspects of the business to ensure that the supply side of the organisation has the capacity and capability to satisfy demand. Research has shown that S&OP can improve profitability by as much as 40% (Pay, 2010). Different forecasting methods play a role in supply chain management with it being acknowledged that the smoother the forecast the smaller the increase in variability (Sun & Ren, 2005). This is quantified using a forecast accuracy calculation, which is a measure of how well the organisation was able to forecast demand and is a comparison of the actual demand versus the forecasted demand for a particular period.
16 There is no doubt that S&OP is a necessary tool inside any organisation if the said organisation intends on competing within the market. However, as will be discussed later in this Chapter whilst the process may be well understood and described in the literature many an organisation face continuous challenges in making S&OP work effectively for them.
2.2.1 Sales & Operations Planning defined (S&OP)
S&OP is the long term planning of production levels relative to the long term changes in demand and hence sales levels. S&OP gives an indication of the approximate capacity levels required to support the production plan with the capacity normally being treated at an aggregate level (Olhager, Rudberg & Wilner, 2001).
The APICS (American Production & Inventory Control Society) dictionary defines S&OP as:
“...a process to develop tactical plans that provide management the ability to strategically direct its businesses to achieve competitive advantage on a continuous basis by integrating customer- focussed marketing plans for new and existing products with the management of the supply chain.
The process brings together all the plans for the business (sales, marketing development, manufacturing, sourcing, and financial) into one integrated set of plans. It is performed at least once a month and is reviewed by management at an aggregate (product family) level. The process must reconcile all supply, demand, and new product plans at both the detail and aggregate levels and tie to the business plans. It is the definitive statement of the company’s plans for the near to intermediate term covering a horizon sufficient to plan for resources and suppose the annual business planning process. Executed properly, the sales and operations planning process link the strategic plans for the business with its execution and reviews performance measures for continuous improvement.” (COX & Blackstone, 2002). APICS Dictionary, Tenth ed. APICS, Alexandria, va, USA.)
17 The main features that one can extract from within the definition are:
• It is cross functional
This essentially translates into all inputs being derived from individuals that sit within different functions in the organisation and spans across the teams that are responsible for the demand and supply aspects of the business. The intent is to ensure that there is robustness in the numbers and views generated and that there is alignment.
• Integrated tactical planning process
The S&OP process stipulates the individuals that are required in certain meetings and decision making forums to ensure that the plans that are developed are done so with input from all relevant functions and therefore drives an integrated approach.
• Integrates plans in a unified manner
As discussed above the approach involved various individuals within the same meetings, which drives the development of integrated plans in a unified manner.
• Planning horizon from zero to over 18 months
The process ensures that a suitable timeframe is considered to ensure that the organisation is able to have a view of the future and to be able to plan and react in a proactive manner.
The S&OP process within the organisation in which this study was conducted covered a planning horizon from zero to 24 months (104 weeks) in weekly time buckets.
• Bridges strategy and operations and creates value
Given the period S&OP covers, attention is given to the very operational short term as well as the more tactical periods. Inherent in the S&OP process is the continuous discussion that should be occurring to ensure that if the operational and tactical views are achieved it would contribute towards the overall organisational strategy.
• Linked with the performance of the firm
The S&OP process mandates that business critical KPI’s are reviewed and discussions held with regards to determining how the KPI’s are tracking and hence overall business
18 performance as well as to use the demand forecast to estimate what future performance can be achieved. This would be across KPI’s such as working capital, turnover and gross margin.
S&OP has two primary purposes. The first is to balance supply and demand and the second is to build a bridge between the strategic plan and the operational plan of an organisation. It attempts to ensure that both vertical and horizontal alignment across the business is achieved (Thome, Scavarda, Fernandez & Scavarda, 2012). However ensuring the S&OP process functions as designed is fraught with challenges.
2.2.2 THE Bullwhip Effect (BWE)
When there is oscillation in demand, the supply chain suffers from a phenomenon called the bullwhip effect. The bullwhip effect is a common problem which many organizations ponder over and dedicate a large proportion of energy towards resolving. It is an extensive and expensive problem faced by supply chains and has far reaching consequences.
The bullwhip effect refers to the amplification of end customer order signals whereby upstream replenishment demand and physical shipments exceed the original order quantity (McCullen &
Towill, 2002). The bullwhip effect causes instability in the supply chain since any small change in customer orders received by a retailer can result in larger changes in the resulting demand placed on the factory. It costs money, wastes resources and results in a loss of market share (Wright &
Yuan, 2007). The bullwhip effect results in both successive overstocking and under stocking or requiring additional capacity followed by under-utilisation (McCullen & Towill, 2002).
The bullwhip effect is often referred to as the Forrester effect. Sterman (1989) used the beer distribution game to explain the bullwhip effect as "irrational" behaviour by managers or decision makers. Individuals within supply chains frequently find themselves in stressful situations, where product shortages will lead either to lost sales or to back orders which needs to be fulfilled. Due to the environment and pressure placed on the individual, they will naturally use their opinions of what the higher priority is and make a decision based on it.
19 The bullwhip effect results in oscillation and a lag effect between the various parts of the total supply chain which, to place in context, extends from the material supplier to the end consumer.
A phase lag effect is best described as the oscillation transferring from one part of the supply chain to the next with the lead time between the different parts of the supply chain creating a lag (Alizadeh, 2012). Forrester showed that the feedback logic employed in typical production- distribution systems actually contributes to system instability, to induce both amplification and rogue seasonality (McCullen & Towill, 2002). This essentially means that the feedback logic may trigger a decision to produce stock, but given the lead times, this would be produced and placed in inventory well after the trigger is no more. By way of an example, lets us assume that a customer places an order in Week 1 and the business cannot satisfy the total order, a production plan is triggered for the factory to manufacture, which given the leads is only completed in week 5. By the time the stock is ready the customer may have decided to get a substitute product, which results in the organisation have stock levels that are above the stock holding policy. The organisation is now overstocked. In a perfect world instantaneous production and replenishment would negate this but the realities of the business world are very different. This results in an amplification of the demand signal. The spikes in the demand signal further gives an indication that there is seasonality with the demand horizon, which is actually false. There are numerous contributing factors to the bullwhip effect with Disney & Towill (2003) showing that Vendor managed inventory (VMI) seeks to condense the timelines and reduce lead times between the various echelons within the supply chain which in turn reduces rogue seasonality. Bhattacharya &
Bandyopadhyay (2011) cite at least 19 causes of bullwhip effect.
There are, however, proven solutions to the bullwhip effect for organisations to consider which will contribute towards reducing costs and improving customer service levels (McCullen &
Towill, 2002). Yet the phenomenon is still widespread amongst industries across the globe.
Holland & Sodhi (2004), states that an incremental decrease in batch size and order deviations can lead to substantial benefits to the organisation in the form of reductions in order variances and the bullwhip effect. These possible solutions can aid managers to prioritise work that can lead to improvements provided they are able to see the big picture and make decisions that are for the benefit the whole and not just a small part of the organisation.The cost of the bullwhip effect on organisations would be the sum of bullwhip related inventory costs and the profit margin lost due to poor stock availability. McCullen & Towill (2002) highlighted the following four principles that could aid in reducing the bullwhip effect:
20 2.2.2.1 Principle 1: Time compression
This involves reducing material and Information processing lead times which results in there being smaller lags between the various phases of the total supply chain
2.2.2.2 Principle 2: Information transparency
Refers to the sharing of information amongst role players, within the supply chain, which can facilitate better decision making. Information integrity and honesty between role players is a critical contributor to success.
2.2.2.3 Principle 3: Control systems
Reference is made to the systems, procedures and policies that are in place to ensure individuals operate with a predetermined framework.
2.2.2.4 Principle 4: Echelon elimination
This involves reducing the number of interfaces that exist within the supply chain to shorten lead times. The underlying premise is that the shorter the chain the smaller the oscillation across the entire chain.
2.2.3 Relevance of S&OP
Daugherty (2011) points out that most research and many of the marketing strategies treat buyer- seller exchanges as discrete events, and not as ongoing relationships. Baumann & Andraski (2010) highlight that collaboration towards improving the total supply chain is a key element towards gaining business benefits. They further highlight that CPFR (Collaborative Planning, Forecasting
& Replenishment) and S&OP can be implemented in a joint manner to give added benefits, with CPRF being external collaboration and S&OP being internal collaboration. Spen & Bask (2002) reiterated that in managing the supply chain researchers have emphasised integration, the flow of
21 information to achieve efficiency improvement and managerial and structural issues as being important to improving the efficiency and effectiveness within the supply chain. The sharing of information between organisations leads to a reduction in the effects of the bullwhip effect, which in turn results in supply chain being more agile, adaptable and aligned (Ganesh, Raghunathan &
Rajendran 2008).
Demand management is commonly viewed as being a key supply chain management inter-firm process. Demand forecasting was identified as one of the significant variables for bullwhip control (Wright & Yuan, 2007). One of the key aims of the S&OP process is to ensure a robust and accurate demand forecast, which will hence contribute towards reducing the bullwhip effect on an organisation. One of the primary benefits of S&OP is that it focuses on both strategy and partially on tactical issues (Olhager, Rudberg & Wilner, 2001). One can argue, however, that given that the S&OP process typically considers the zero to 24 month horizon it is not truly focused on the full strategic horizon period.
Wright & Yuan (2007) showed that an improvement in the areas of demand forecasting and ordering policies contributes towards alleviating the bullwhip effect. It was demonstrated that a relatively slow adjustment of inventory levels combined with a slightly more rapid adjustment of supply line levels provides the most improvements. These improvements results in smaller demand oscillations, which brings greater stability to the supply chain.
Metters (1997) states that the importance and impact of the bullwhip effect to an organisation greatly varies depending on the specific business environment that they operate within. Given appropriate conditions, however, eliminating or drastically reducing the bullwhip effect can increase product profitability by 10%-30%. There is a potential link between demand profiling and S&OP. Regularly updating the demand signal as part of the S&OP process can contribute towards ensuring that products are channelled through the most appropriate supply chain route (Godsell, et al, 2010).
22 2.2.4 S&OP shortcomings reviewed
Very often within organizations, individuals assume that if there is a process and a formula written in a very formal looking document then everyone within that organization will follow it. However, as discussed, it is very evident that individuals are all driven by different factors and hence behave and lead differently. This difference in behavior and worldview leads to conflicting priorities within an organization. Granted that the difference in behavior has advantages and disadvantages which will not be delved into at this stage.
Chakravorty (2012) stated that identifying the correct priorities for improvement programs is required because incorrect priorities increase the probability of failure. Instead of reducing strategy to a formula with detailed planning, it was noted that the human elements of leadership, morale and almost instinctive practical understanding characterize the best leaders (Chakravorty, 2012).
The attributes that drives the planning process are identified as information, procedural and alignment quality (Oliva & Watson, 2011). In addition, social elements were also identified though substantial work in this area has not been done. The quality of decision making and the resulting plans is impacted by inconsistent decision making procedures or procedures subject to the cognitive and social limitations, influences and idiosyncrasies of individuals and groups (Oliva &
Watson, 2011).
Kristianto, Ajmal & Helo (2011) mention that it is common place to find the sales function not fully integrated into the planning and scheduling processes within the S&OP process. It can be seen that collaboration amongst internal and external stakeholders is therefore a key success factor.
Godsell, et al (2010) states that there has long been tension between marketing and supply chain functions and it is this conflict and misalignment that is reflected in the difficulty of reconciling market segments and product characteristics when developing supply chain strategy. This leads to a sub-optimum situation in which the demand profile is inaccurate leading to a myriad of symptomatic problems within the organisation.
It is common to find that many organisations complain about forecast accuracy and the difficulties experienced with matching supply and demand. It is, however, clear that many of these organisations have the systems, tools, processes and knowledgeable people to match demand and supply yet these very same organisations still complain (Zylstra, 2005). Why? Many organisations
23 follow different frameworks when implementing S&OP, which could contribute to the inconsistent approaches seen. One of the beliefs in most organisations is that S&OP is intended for the tactical as opposed to the strategic level (Chen- Ritzo et al, 2010a). This translates to the organisation seeking to satisfy customer demand primarily within the short term, potentially between the zero to 12 month period. This also results in there not being the relevant checks to ensure that the outputs of the S&OP process are aligned and contribute towards the overall business strategy. As di