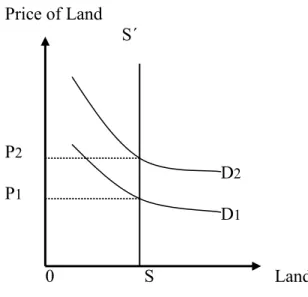
Since farmland prices are demand-driven, changes in demand for farmland (as affected by land reform issues) can result in changes in farmland prices. The logit model is used to estimate the impact of land reform on the demand for agricultural land, hence agricultural land prices.
Background of the Study
The importance of the agricultural sector in bringing about sustainable economic development and social welfare is an essential fact in South Africa. High food prices and land reform issues are some of the current debated topics in South Africa.
Problem Statement
Land values are high in South Africa and this makes it difficult for most of South Africa's poor to access land once owned by locals. Second, the rate of population growth, although limited by the HIV/AIDS pandemic, is increasing in South Africa.
Objectives and Significance of the problem
South Africa
Rainfall is unevenly distributed across the country; this signals the importance of irrigation in the production of most crops. The country is self-sufficient in all major agricultural products and is also a net exporter of food in good years (National Department of Agriculture, 2006).
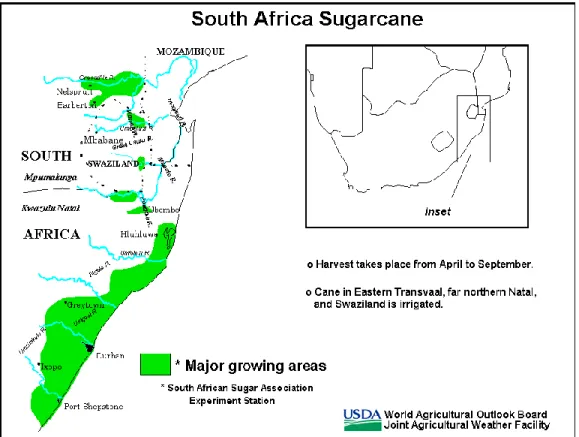
Sugar Cane Producing Area
Sugar Cane Production and Consumption
Maize Production and Consumption
Maize Futures Markets
A forward contract is a legally binding agreement between two parties calling for the sale of an asset or product in the future at a price agreed upon today (Ross et al, 2001:613). With these features, the South African Futures Exchange (SAFEX) is the largest white maize futures exchange in the world.
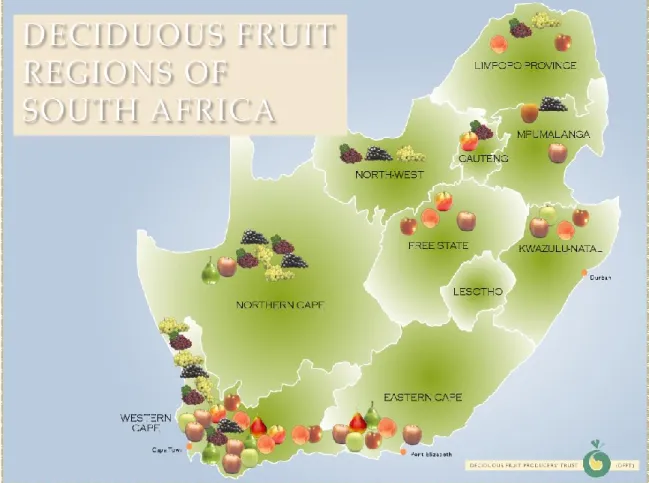
Deciduous Fruits
Deciduous Fruit Production and Consumption
The fruit industry was started by the Dutch East India Company in the 17th century (Deciduous Fruit Growers Association (DFPT), 2009). In 1892, Cecil John Rhodes started Rhodes Fruit Farms in the Franschhoek Valley using expertise imported from California, and these Rhodes Fruit Farms specialized in exporting fruit to England (Christopher, 1982).
Introduction
International Studies
Cross-sectional Studies
The variables included in the study were number of acres, productivity, distance from Tulsa and distance to paved road, road type, and mineral rights transferred. The proportion of total sample variation in cotton farmland prices due to sample variation in all independent variables was 95 percent (R² = 0.95) for the study.
Time Series Studies
The model was run on all land areas greater than or equal to 12 hectares (approximately 5 hectares). The average size of the farms on which the study was conducted suggests that the agriculture practiced on these farms was very intensive in nature.
South African Farmland Price Studies
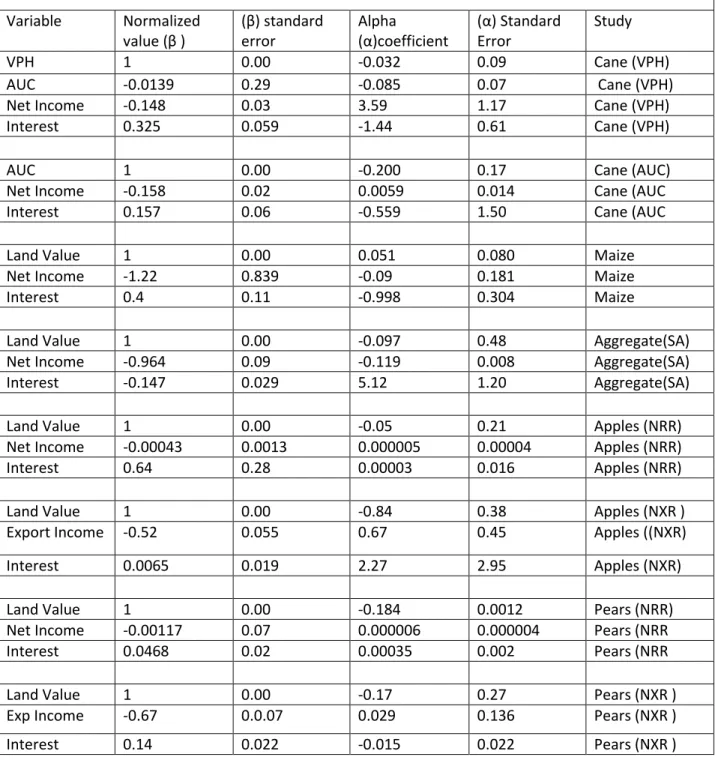
Adam Smith commented in the 19th century that "the landowner, like all other men, loves to reap where they never sowed". In the long run, the results are shown in Table 7.4 (after normalization with respect to agricultural land values); the sign of the coefficient for real return to agricultural land is positive as expected a priori;.
Interaction of Price Determinant Factors
Factors Affecting Agricultural Commodity prices in SA
Population
Population growth rate in most SADC countries exceeds both production rate and grain availability (Nichola, 1998:95). The SADC, including South Africa, is faced with volatile cereal production growth rate and rapid rise in prices.
Technology
Exchange rate
Overvaluation, on the other hand, reduces the demand for exported goods as they become expensive due to overvaluation.
Input Costs
Commodity Prices and Farmland Price Trends in USA
The weakening of the US dollar made American food products highly competitive in world food markets. Global food demand fell between 1996 and 1998 and US agricultural exports fell by 14 percent (Henderson, 2008).
Farmland Price Trends in South Africa
The control or independent variable (z) measures the total contribution of all the control variables (if there are many) used in the model. Agricultural Land Redistribution in South Africa: Towards Accelerated Implementation, in Ntsebenza, L and R. The Land Question in South Africa, Human Sciences Research Council Press, Cape Town.
World and SA Agricultural Commodity Prices Review
Government Payments and Farmland Values
The political and economic consequences of withdrawing agricultural support seemed too heavy a burden for the government. The government revised its policy in the 1990s; farmers' privileges were reduced and this led to a dramatic change in the agricultural sector in terms of income and land values (van Schalkwyk, 1995).
Land Reform Issues
Experiences from Other Developing Countries
The following section looks at the history of South African agriculture and the land reform programs currently underway.
South African Agricultural History and land Reforms
Protecting South African farmers from foreign competition raised the prices of agricultural commodities and fueled South African inflation. One of the proposals of the Tomlinson Commission was that changes were needed in the tribal rights system.
Land Reform
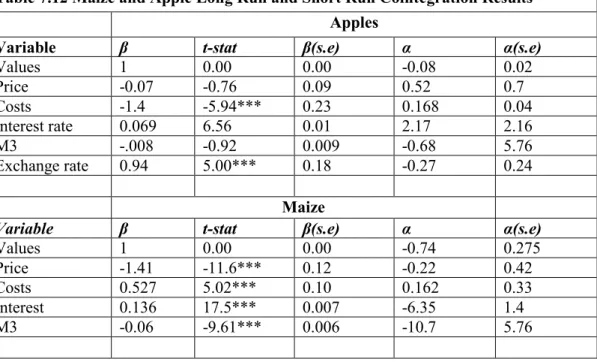
A percentage increase in interest rate can cause a 0.069 percent decrease in apple land values in the long run. Money supply and interest rate shocks are not significant in the long run and in the short run.
Modes of Land Redistribution in South Africa
The Settlement/Land Acquisition Grant
The beneficiaries chose to pool their meager subsidies to purchase a farm from a willing seller. The number of beneficiaries who can pool their subsidies to purchase a farm typically became too large to be supported by an affordable farm.
The Land Redistribution for Agricultural Development
The biggest obstacle for this program was that the R15 000 grant was too little to buy a meaningful agricultural land in the market. Proposals from the Department of Land Affairs encouraged farmers to use their grants for loan financing acquisitions to buy land.
The Bargaining Process and the “Willing buyer-Willing seller”
Restrictions have been set for pooling grants because group projects are problematic and discouraged. Other pitfalls and limitations of the market-led approach to land reform are discussed below.
Large Farm Lobby against Reforms
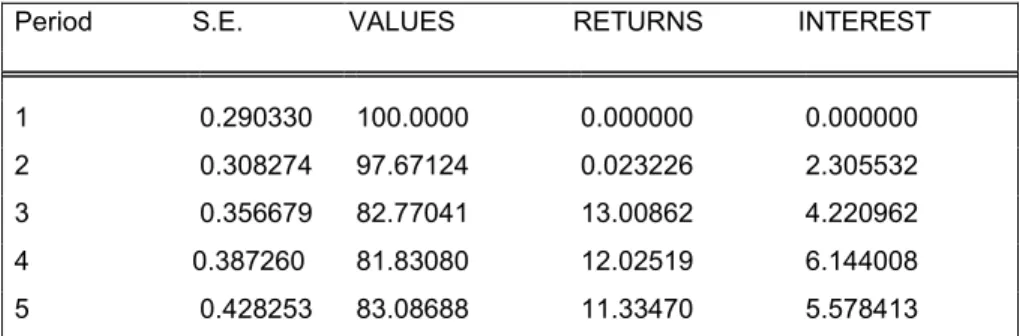
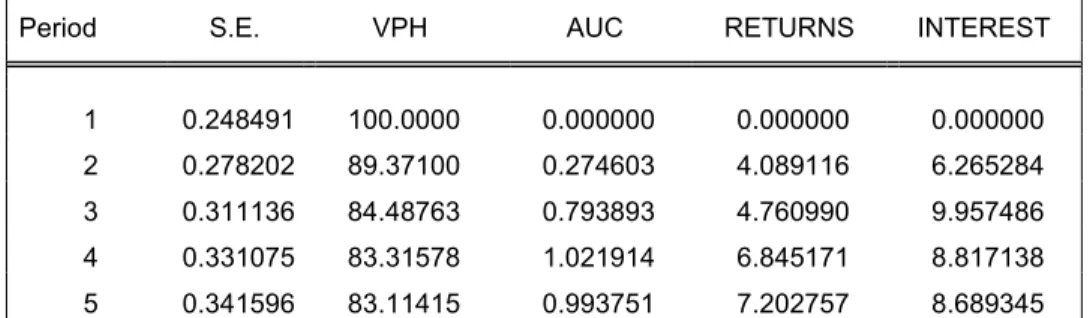
A percentage change in the interest rate can lead to a negative change of 0.158 percent in agricultural land values in the long run. In the long term (5th year) about 7.2 percent of the variance in the value of agricultural land per hectare is explained by variations in net per hectare.
Experiences of Market Led Land Reforms in South Africa
Overall Performance of Land Reform Programmes
The average price per hectare of land offered to the land restitution program was approximately R1500 in the year 2000. By July 2005, more than 500,000 hectares of land had been redistributed in the Northern Cape.
Introduction
A 10 percent increase in the exchange rate could lead to a 9.4 percent decline in the value of apple farmland in the long run. The money supply has a positive impact on the value of apple farmland, but the impact is not significant in the long run.
Capitalization Theory
Methods of Farm Valuations
Valuation of Orchards
Plantations are characterized by high initial establishment costs; trees require several years to reach maturity with little or no income in the early years (White, 1995). The value consists of total establishment costs, and the value of land is added to these establishment costs.
Valuation of Sugar cane Farms
The Long run Equilibrium
Comparative Static Analysis
A 10 percent increase in input costs can cause a 14.1 percent increase in farmland values in the long run. A 10 percent increase in average price can cause a 0.7 percent increase in apple farmland values in the long run.
Dynamic Equilibriu Models
Introduction
Hypothesis and Objectives
Agricultural commodity prices via net farm income are expected to positively impact farmland values while interest rates are expected to have a negative impact on farmland values. Money supply is also expected to positively affect farmland values while the exchange rate's influence on farmland values is expected to be negative.
Data Sources
Sugar Cane Data Sources
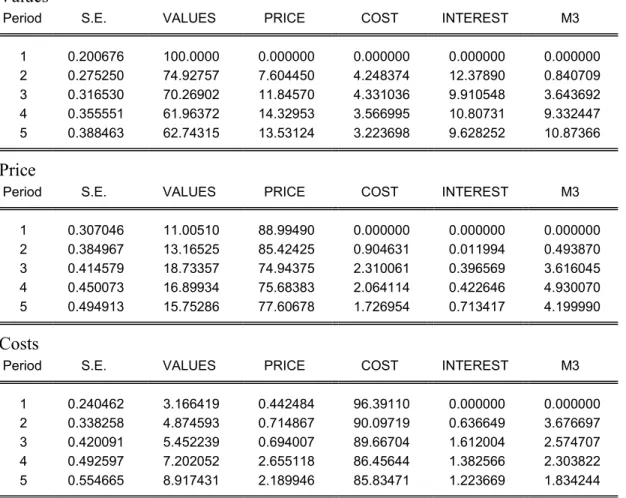
Export revenues are responsible for 5.15 percent of the variations in the value of apples per hectare of agricultural land in the short term (second year) and this contribution increases to 8.3 percent in the long term. A 10 percent increase in costs could lead to a 5.27 percent decline in corn farmland prices in the long run.
Maize, Deciduous Fruit, and
Cash Flow Estimation
Money supply contributes about 3.64 percent of variations in corn farmland prices in the short run. Input cost shocks contribute 4.71 percent of variations in apple farmland values in the short run and the long run's contributions account for 7.76 percent.
The Present Value Model
Stationarity and Unit Root
The ADF-Fisher test is the extended version of the Dickey-Fuller test, and its t-statistic is also normally distributed under the null hypothesis of unit root. The KPSS test specification follows the general unit root test specification presented in equations (6.4) and (6.5).
The Vector Autoregressive Model (VAR)
Structural and Reduced Form VAR
Another important determinant of the variations in the value of pears per hectare of agricultural land is the net agricultural income per hectare, which is 6.68 percent in the fourth year. Input cost shocks contribute 2.31 percent to corn price fluctuations in the short run and 1.73 percent in the long run.
Stability and Stationarity in VAR
The Vector Error-Correction Model
Appropriate trace test and maximum eigenvalue test are then undertaken to determine the number of cointegrating vectors in the model. In models that have full rank Π=0, we normally do not reject the null hypothesis of no cointegrating vectors, because Xt in this connection has no unit root and is stationary.
The Model to be Estimated and Variables
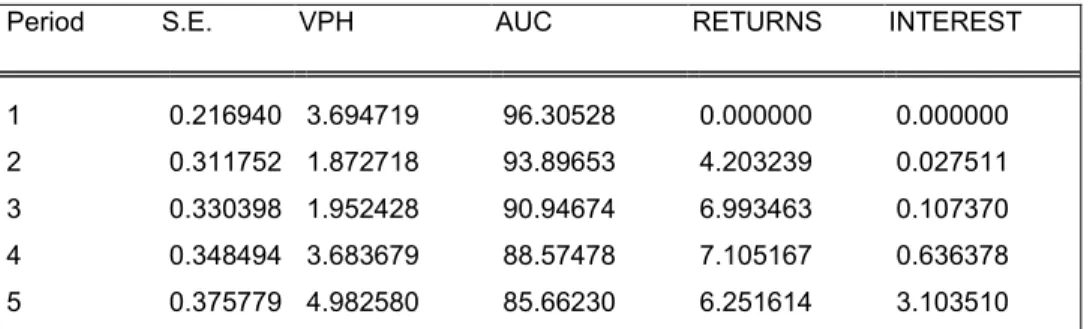
The dependent variables in the sugarcane agricultural land value model are real land value per hectare and real per hectare area under cane (AUC). Where AUC is the area under sugarcane per hectare farmland value, NRR is real yield per hectare, RI is interest rate and εt is the error term.
The Macroeconomic-Agricultural Sector Model
According to Ortman (1987) quota land values were approximately 60 percent higher than land values per hectare during 1986-1987. Where VPH is the value per hectare, NRR is the real net return and the real interest rate RI; εt is the error term.
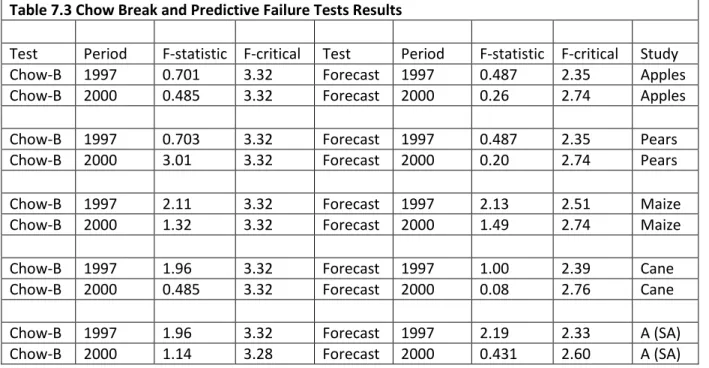
Structural Changes Tests
Where is the log of per hectare agricultural land price, is the log of lagged product prices, , is the log of lagged input costs, , is the log of lagged exchange rate (Rand/US$), and , is lagged money supply and lagged interest rate, respectively; is the error term. Where are the observations that the model tries to predict, is the sum of squared residuals for large sampled subperiod, and is the sum of squared residuals for the entire period.
Land Reform Model
The Logit Model
An increase in the probability of the outcome is explained by a positive coefficient ( , ) while a negative coefficient implies that the probability of the outcome is reduced by the control variable whose coefficient is negative. The logit model informs us that the log of odds ratio is a linear function of explanatory variable D/E in the present case.
Special Features of the Logit Model
The natural log of this odds ratio is called the logit and the model is called the logit model (Gujarati. For example, in this model, the slope coefficient β2 estimates the change in the log of odds ratio per unit change in the amount of credit obtained by subsidy holders.
Introduction
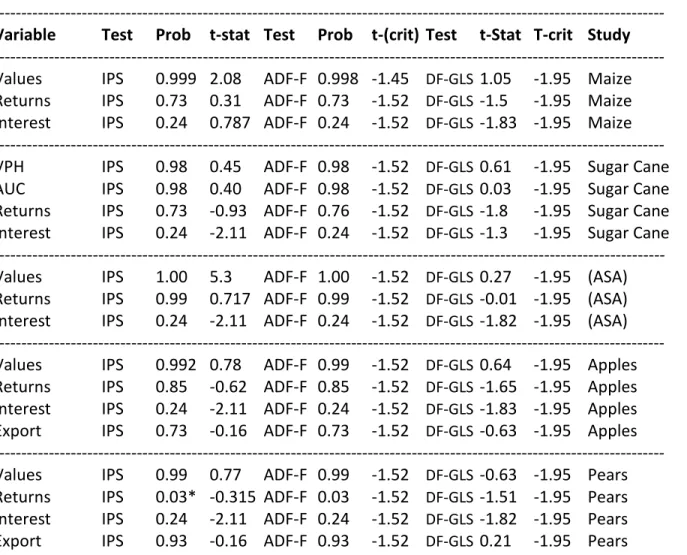
Two other tests were used to aid in the assessment of the presence of unit roots. The results of Johansen's cointegration tests (tracking and maximum eigenvalue tests) do not reject the null hypothesis of the existence of cointegrating equations at the 5% and 10% levels.
Sugar Cane Results
A 10 percent increase in money supply can cause a 0.61 percent increase in corn farmland prices in the long run. On average, the variable represents about eight to nine percent of variations in soft fruit farmland values over the long term.
Maize Results
Aggregate South African Farmland Value Results
A negative relationship was expected between the real value of agricultural land per hectare and the real delayed interest rate. The rates of adjustment coefficients for real values of agricultural land per hectare and net farm income have expected negative signs.
Deciduous Fruit Results
Apples
This suggests that apple farmland values respond slowly to shocks and deviations from the long-term path under net farm income compared to export income.
Pears
Money supply shocks account for 3.62 percent of corn farm variations in the short run and 4.93 percent in the long run. The contributions of money supply shocks to input cost shocks are not significant in the short and long run.
Contemporaneous Relationship among Variables
The Macroeconomic-Agricultural Sector Model Results
Unit Root and Cointegration Tests Results
Three unit root tests were used to test the stationarity or non-stationarity of variables in the models. The results of the two-unit root test showed that all variables used in the two models are nonstationary and first-order integrated.
Maize and Apple Long Run and Short Run Results
A 10 percent increase in corn prices can induce a 14.1 percent proportional increase in corn farmland prices in the long run. A one percent increase in interest rates can induce a 0.136 percent decrease in corn land prices in the long term.
Forecasting Error Variance Decomposition (Maize and Apple)
Interest rate shocks contributed only 0.64 percent to the total fluctuation of corn prices in the short term, and 1.22 percent in the long term. In the long run, interest rate shocks dominate the contributions of other variables to average price shocks.
The Logit Model
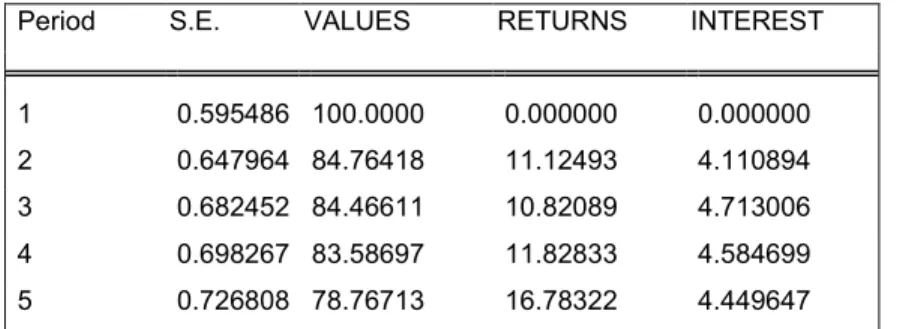
In all estimated models, agricultural land values were the first in the order of variables. The forecast error variance decomposition results demonstrated that maize price shocks contribute significantly to the short- and long-term variability of farmland maize prices.
Recommendations
Technological Adoption
On the Principles of Finance and Taxation, in the Works and Correspondence of David Ricardo. We outlined details of the Cointegration Regression Durbin Watson (CRDW) test as they appear in the DF-GLS results.

Tenure Improving
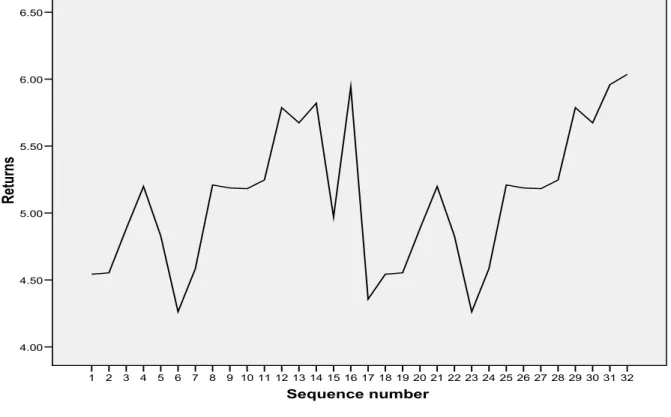
Maize Graphs
The value of corn farmland is less variable than the net income of a corn farm; agricultural land values follow an increasing trend and are not stationary in levels. The variable is volatile (mainly because it does not transform into a natural log) and has an increasing tendency.
Sugar Cane Graphs
Deciduous Fruit Graphs
The results in Table 7.4 in the text are presented in the form of normalized results regarding the dependent variable (farmland values) in all sub-studies. There is no presumption in cointegration analysis that says one variable has a different status than other variables, any variable in the equation can be normalized (Patterson, 2000).