EPIDEMIOLOGY OF CHRONIC KIDNEY DISEASE IN KWAZULU-NATAL:
IN
EVALUATION OF RISK FACTORS,
COMPLICATIONS AND DIAGNOSTIC METHODS
NOMANDLA DAPHNE MADALA
MBChB, MMed (Natal); MSc Epidemiology (London); FCP (SA)
EPIDEMIOLOGY OF CHRONIC KIDNEY DISEASE IN KWAZULU-NATAL:
EVALUATION OF RISK FACTORS,
COMPLICATIONS AND DIAGNOSTIC METHODS
NOMANDLA DAPHNE MADALA
MBChB, MMed (Natal); MSc Epidemiology (London); FCP (SA)
Submitted in fulfilment of the requirements for the degree of Doctor of Philosophy
Discipline of Nephrology Department of Internal Medicine
Nelson R Mandela School of Clinical Medicine University of KwaZulu-Natal
2017
DEDICATION
To my dear parents
Mrs Patricia Alice Ndileka ‘Nondie’ Madala
MaNkala, just as you committed during my early school years, Your shoulders indeed became the springboard for me to launch into space.
and
late Judge Tholakele ‘Tholie’ Hope Madala
Pop, you were taken from us much too soon and are dearly missed.
Your unfailing confidence in me under all circumstances continues to inspire me daily.
Rest in eternal peace, Tshabalala, Mtshengu, Sobhuza!
ACKNOWLEDGEMENTS I wish to express my sincerest gratitude to:
1. Professor Alain Assounga and Professor Sarala Naicker, my supervisors, for their tremendous patience and their confidence in me. I am grateful for the guidance and encouragement during this project as well as in my career.
2. Sister ‘Nomthi’ Zungu, for her exceptional work ethic as a research nurse, her outstanding personal attributes and dedication was pivotal in the completion of this project.
3. Professor Jules Tapamo and Ms Monica Oluyede for their ‘mathematical minds’.
4. Sister B.G. Mazibuko and the renal team at Ngwelezana Hospital for their assistance with recruitment and data collection during their selfless pursuit of the cause of serving patients.
5. Sister Linda Mpungose, Sister G.T. Mthembu and their teams at King Edward VIII Hospital follow- up and specialist clinics for their assistance with participant recruitment and data collection as well as their commitment to patient care.
6. Miss Yolisa Mncundza for her support and administrative assistance during this project as well as throughout the time she worked as the Nephrology administrative officer.
7. Mrs Shemica Bahadur for her efficiency as the data clerk and Mr Thirumalai ‘Sonny’ Govender for providing the laboratory technical work.
8. Mr B. Khoza of Nuclear Medicine for the radioisotope studies and X-ray staff who did the DEXA scans.
9. Drs Jay Narainsamy, Thozama Dubula, Leann Guruvadu and Akira Singh for assisting with N5A unit clinical duties while I undertook this work as well as all the registrars,
medical officers and interns who contributed towards patient recruitment and care.
10.All the patients who willingly participated in this project.
11.The International Society of Nephrology, University of KwaZulu-Natal and the National Research Foundation for funding received.
12.Fogarty International for funding my epidemiology and biostatistics training at the London School of Hygiene and Tropical Medicine, which formed the foundation for this work.
13.Professor Wendy Hoy and her team at Queensland University, Brisbane, who nurtured my interest in the epidemiology of chronic kidney disease while still in its infancy.
14.Bulie Magula, Ncoza Dlova, Fundeka Mahlawe, Mpho Kgomo, Xolie Poswa, Doreen Senoge, Pretty Mbeje and Pumla Mahuma for all the times you spurred me on to charge through those quitting points.
15.Mac and the rest of the Tlale family as well as the Madala family; I thank you all for who I have grown up to become.
16.Most of all, the Lord Almighty, for His Amazing Grace that makes all things possible.
TABLE OF CONTENTS
Content Page
Declaration i
Dedication ii
Acknowledgements iii
Table of contents iv
List of figures vi
List of tables vii
List of acronyms ix
Abstract x
Chapter 1 Introduction 1
1.1. Background and context of the work 2
1.1.1. Definition and classification of chronic kidney disease 2 1.1.2. Global public health impact of chronic kidney disease 6 1.1.3. The rising burden of chronic kidney diseasein South Africa 7
1.2. Literature review 8
1.2.1. Risk factors for development of chronic kidney disease 8
1.2.1.1. Diabetic and hypertensive nephropathies 8
1.2.1.2 Human immunodeficiency virus and other infection-related glomerulopathies 8
1.2.1.3 Tubulointerstitial diseases 9
1.2.1.4 Demographic variables 9
1.2.1.5 Genetic and other risk factors 9
1.2.2. Complications associated with chronic kidney disease 10 1.2.2.1. Metabolic and endocrine complications of chronic kidney disease 10 1.2.2.2. Cardiovascular disease in chronic kidney disease 10
1.2.2.3. Protein energy wasting 11
1.2.3. Prediction of glomerular filtration rate 13
1.2.3.1. Methods to determine glomerular filtration rate 13
1.2.3.2. Performance of estimated glomerular filtration rate in different populations 13
1.3. Rationale 14
1.4. Hypothesis 14
1.5. Aim 15
1.6. Objectives 15
1.7. General methodology 15
Chapter 2 Characteristics of South African patients presenting with kidney disease in rural KwaZulu-Natal: a cross sectional study
16 Chapter 3 Association of kidney function and waist circumference with uric acid levels in
South Africans
26 Chapter 4 Prevalence and earlier occurrence of chronic kidney disease-related metabolic
abnormalities in South Africans
34 Chapter 5 Relationship between body composition and glomerular filtration rate in South
Africans with non-dialysis chronic kidney disease
56 Chapter 6 Predictive performance of eGFR equations in South Africans of African and
Indian ancestry compared with 99mTc-DTPA imaging
75 Chapter 7 A glomerular filtration rate prediction equation developed in African patients in
Durban, South Africa
85
Chapter 8 Discussion and Conclusion 105
8.1. Synthesis of key findings 106
8.1.1 Risk factors associated with chronic kidney disease and cardiovascular disease 106 8.1.2. Risk factors for progression of chronic kidney disease 108 8.1.3. Complications associated with chronic kidney disease 108 8.1.4. Estimation of glomerular filtration rate for detection of chronic kidney disease 109
8.2. Study limitations 110
8.3. Conclusions and recommendations 111
References 113
Appendix 121
University of KwaZulu-Natal Biomedical Research Ethics Committee Approval 122 KwaZulu-Natal Provincial Department of Health Approval 124
Data collection sheets 125
Permission to change title 130
LIST OF FIGURES Chapter 1
Figure 1. Prevalence and numbers of patients on RRT by province
Figure 2. A conceptual model for aetiology of PEW and its direct clinical implications Chapter 2
Figure 1 Prevalence of CKD risk factors in the 302 study patients Figure 2 Distribution of hypertension, diabetes and HIV by age group
Figure 3 Distribution and overlap of major CKD risk factors in patients with one or more co- morbidities
Figure 4 Distribution of patients grouped according to presenting eGFR level and age Chapter 3
Figure 1. Prevalence of hyperuricaemia, gout and comorbid diseases according to estimated glomerular filtration rate category
Chapter 4
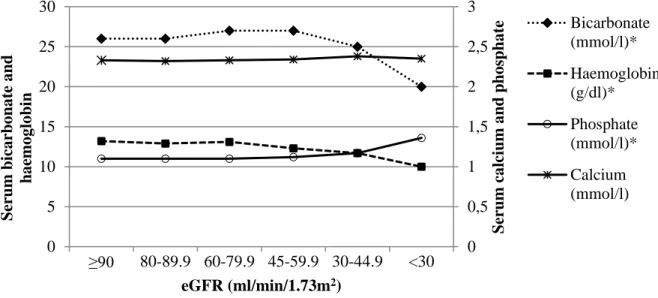
Figure 1. Median values for bicarbonate, haemoglobin, calcium and phosphate according to estimated GFR
Figure 2. Prevalence of metabolic abnormalities and distribution by age group Figure 3. Prevalence of metabolic abnormalities by estimated GFR
Chapter 5
Figure 1. Relationship between limb lean mass and measured GFR by gender Figure 2. Relationship between limb fat mass and measured GFR by gender Chapter 6
Figure 1. Bland–Altman plots illustrating concordance between 99mTc-DTPA measured GFR and estimated GFR
Chapter 7
Figure 1. Correlation between estimated and measured GFR
Figure 2. Agreement between measured and estimated GFR by CG, CKD-EPI, MDRD as well as African modified MDRD equations
LIST OF TABLES Chapter 1
Table 1.1. Definition of CKD
Table 1.2. Staging of CKD by categories of glomerular filtration rate Table 1.3. Staging of CKD by categories of albuminuria
Table 1.4. Predicting prognosis of CKD
Table 1.5. Cost of haemodialysis versus peritoneal dialysis in some African countries Table 1.6. Diagnostic criteria for protein energy wasting
Chapter 2
Table 1. Distribution of demographic, clinical and laboratory data of study patients by gender Table 2. Multivariable logistic regression analysis results showing factors associated with presenting eGFR <60 and <30 ml/min/1.73 m2
Chapter 3
Table 1. Demographic, clinical and laboratory characteristics of patients studied Table 2. Demographic, clinical and laboratory characteristics by GFR category Table 3. Differences between hyperuricemic and normouricemic patients
Table 4. Univariate and multivariable logistic regression analysis of factors associated with hyperuricaemia
Chapter 4
Table 1. Patient characteristics and distribution by estimated glomerular filtration rate Table 2. Multivariable logistic regression models showing adjusted odds ratios (95%
confidence intervals) for each metabolic abnormality Chapter 5
Table 1. Overall patient characteristics with distribution by gender and measured glomerular filtration level.
Table 2. Correlation coefficients between body composition parameters and other study variables
Table 3. Univariate and multivariate regression analysis of factors associated with whole body lean mass
Table 4. Univariate and multivariate regression analysis of factors associated with whole body fat mass
Chapter 6
Table 1 The demographic, clinical, and laboratory characteristics of the 148 patients studied Table 2 Performance of GFR prediction equations in 91 black South African CKD patients compared to 99mTc-DTPA measured GFR
Table 3 Performance of GFR prediction equations in 57 Indian South African CKD patients compared to 99mTc-DTPA measured GFR
Chapter 7
Table 1. Prediction equations used to estimate glomerular filtration rate in adults Table 2. Prediction equations obtained during the 3-phase development stages Table 3. Clinical and laboratory characteristics
Table 4. Agreement between estimated and measured glomerular filtration rate
Table 5. Agreement between estimated and measured glomerular filtration rate in patients with different glomerular filtration rate categories
LIST OF ACRONYMS Abbreviation Description
99mTc-DTPA Technicium-99m-diethylenetriaminepentaacetic acid
ACE Angiotensin converting enzyme
ADPKD Autosomal dominant polycystic kidney disease ARB Angiotensin-II receptor blocker
BMI Body mass index
BSA Body surface area
CAPD Continuous ambulatory peritoneal dialysis
CG Cockcroft-Gault
CKD Chronic Kidney Disease
CKD-EPI Chronic Kidney Disease Epidemiology Collaboration
CRP C-reactive protein
CVD Cardiovascular disease
DEXA Dual X-ray absorptiometry
eGFR Estimated glomerular filtration rate
ESRD End stage renal disease
GFR Glomerular filtration rate
HBV Hepatitis B virus
HCV Hepatitis C virus
HD Haemodialysis
HIV Human immunodeficiency virus
HIVAN HIV-associated nephropathy IDMS Isotope dilution mass spectrometry
IHD Ischaemic heart disease
KDIGO Kidney Disease: Improving Global Outcomes K-DOQI Kidney Dialysis Outcomes Quality Initiative
LV Left ventricle
MDRD Modification of Diet in Renal Disease mGFR Measured glomerular filtration rate NHLS National Health Laboratory Services
P30 Percentage of estimates within 30% of measured GFR
PEW Protein energy wasting
RMSE Root mean square error
RRT Renal replacement therapy
SADTR South African Dialysis and Transplant Registry SARR South African Renal Registry
WHO World Health Organization
WHtR Waist-to-height ratio
ABSTRACT Background
Chronic kidney disease (CKD) is associated with increased morbidity and mortality as well as costly renal replacement therapy.The aim was to determine risk factors and complications that contribute to morbidity as well as a suitable diagnostic detection method for CKD.
Methods
Observational studies were done at 2 hospitals. To assess risk factors, 283 patients were included at the Durban site, and sub-studies undertaken within this sample for CKD complications, while 302 patients were studied at the Empangeni outreach site. To evaluate predictive performance of estimated glomerular filtration rate (eGFR), data from 148 patients were analysed. A further 76 patients were recruited, to develop an African equation. Cockcroft- Gault, Modified Diet in Renal Disease and CKD Epidemiology Collaboration eGFR equations were compared with technicium-99-mdiethylenetriaminepentaacetic acid (99mTc-DTPA)-GFR as the gold standard. Body composition was assessed by anthropometry and dual energy X-ray absorptiometry. Data were analysed with STATA.
Results
The commonest CKD risk factors were hypertension (75%), diabetes (29%) and human immunodeficiency virus (HIV) infection (24%), with HIV commoner at the outreach site (28.5% vs 19.8%). Over 80% of females and ∼60% males were overweight/obese overall;
however, clinical cardiovascular disease was commoner in Durban (28% vs 5%).
Complications were observed in early CKD; prevalence increased as eGFR declined from ≥90 ml/min/1.73m2 to <30 ml/min/1.73m2: hyperuricaemia increased from 17% to 74%, metabolic acidosis (11.6% to 72.7%), anaemia (2.9% to 69.7%), hyperphosphataemia (10.1% to 48.5%), all p<0.001, respectively, and hypocalcaemia from 1.5% to 18.2% (p=0.003). Lower GFR levels were also associated with lower serum albumin levels, and lower whole body as well as regional lean mass and fat mass in males. A further observation at GFR <30 ml/min/1.73m2 was that eGFR underestimated 99mTc-DTPA-GFR in African patients. Prediction of 99mTc- DTPA-GFR was also poor at GFR levels ≥60 ml/min/1.73m2, with eGFR overestimating
99mTc-DTPA-GFR. An eGFR equation developed in African patients resulted in significantly better GFR prediction and showed the lowest bias, highest precision as well as accuracy.
Conclusion
Efforts are needed to enable non-nephrologists to manage CKD risk factors and complications.
Prediction of GFR may be substantially improved by using an equation developed in Africans.
1
CHAPTER 1 INTRODUCTION
Page 1 of 130
2 1.1. BACKGROUND AND CONTEXT OF THE RESEARCH WORK
The worldwide incidence of end stage renal disease (ESRD) grew exponentially over the last two decades due to the growing burden of diabetes mellitus, which has become the commonest cause of ESRD in developed countries. In contrast data from South Africa and sub-Saharan Africa have shown hypertension as the commonest cause in the region. However, these data are inaccurate due to the lack of renal registries in most sub-Saharan African countries. The diabetes burden in the region is increasing due to urbanization while HIV, another cause of ESRD, is at pandemic proportions. Epidemiological data on these emerging ESRD causes in South Africa are needed to inform health service planning because the availability of ESRD treatment is severely limited due to resource constraints. Chronic kidney disease (CKD) early detection programs aimed at retarding progression thus reducing incidence of ESRD are urgently needed. These require that CKD diagnosis can be made easily and cost-effectively in routine clinical practice but currently used methods developed elsewhere may be inaccurate in Africans.
1.1.1. DEFINITION AND CLASSIFICATION OF CHRONIC KIDNEY DISEASE
The 2002 Kidney Dialysis Outcomes Quality Initiative (K-DOQI) Clinical Practice Guidelines provided a clear definition for CKD that included classification according to level of glomerular filtration rate (GFR) (1). The K-DOQI guidelines have since been reviewed and replaced with the 2012 Kidney Disease: Improving Global Outcomes (KDIGO) Clinical Practice Guidelines to improve CKD outcomes (2). Staging of CKD now considers GFR (Table 1.2) as well as albuminuria (Table 1.3) while both markers are also used in risk stratification, to predict complications and future outcomes (Table 1.4).
Page 2 of 130
3 Table 1.1. Definition of CKD (2)
Criteria for CKD (either of the following present for ≥3 months) Markers of kidney damage
(one or more)
Albuminuria
Albumin excretion rate ≥30 mg/24 hours;
Albumin: creatinine ratio ≥30 mg/g (≥3 mg/mmol) Urine sediment abnormalities
Electrolyte and other abnormalities due to tubular disorders Abnormalities detected by histology
Structural abnormalities detected by imaging History of kidney transplantation
Decreased GFR GFR <60 ml/min/1.73 m2 (GFR categories G3a–G5)
CKD, chronic kidney disease; GFR, glomerular filtration rate. Reprinted from Kidney Int Suppl., vol 3, Kidney Disease: Improving Global Outcomes (KDIGO) CKD Work Group (2). KDIGO 2012 Clinical Practice Guideline for the Evaluation and Management of Chronic Kidney Disease, pages 1-150, 2013, with permission from Elsevier; accessed at
http://dx.doi.org/10.1038/kisup.2012.64
Page 3 of 130
4 Table 1.2. Staging of CKD by categories of glomerular filtration rate (2)
GFR categories in CKD GFR category GFR (ml/min/1.73m2) Terms
G1 ≥90 Normal or high
G2 60-89 Mildly decreased
G3a 45-59 Mildly to moderately decreased
G3b 30-44 Moderately to severely decreased
G4 15-29 Severely decreased
G5 <15 Kidney failure
CKD, chronic kidney disease; GFR, glomerular filtration rate. Reprinted from Kidney Int Suppl., vol 3, Kidney Disease: Improving Global Outcomes (KDIGO) CKD Work Group.(2) KDIGO 2012 Clinical Practice Guideline for the Evaluation and Management of Chronic Kidney Disease, pages 1-150, 2013, with permission from Elsevier; accessed at
http://dx.doi.org/10.1038/kisup.2012.64
Table 1.3. Staging of CKD by categories of albuminuria (2) Albuminuria categories in CKD
Category
Albumin excretion rate (mg/24 hours)
Albumin: creatinine ratio
(approximate equivalent) Terms (mg/mmol) (mg/g)
A1 <30 <3 <30 Normal to mildly
increased
A2 30-300 3-30 30-300 Moderately
increased
A3 >300 >30 >300 Severely increased
CKD, chronic kidney disease. Reprinted from Kidney Int Suppl., vol 3, Kidney Disease:
Improving Global Outcomes (KDIGO) CKD Work Group.(2) KDIGO 2012 Clinical Practice Guideline for the Evaluation and Management of Chronic Kidney Disease, pages 1-150, 2013, with permission from Elsevier; accessed at http://dx.doi.org/10.1038/kisup.2012.64
Page 4 of 130
6 1.1.2. GLOBAL PUBLIC HEALTH IMPACT OF CHRONIC KIDNEY DISEASE
Efforts aimed at CKD prevention and early detection grew significantly over the past decade, following alarmingly high ESRD growth rates of ~8% annually, exceeding the 1.3% population growth rate (3). Socioeconomic implications of ESRD are huge as the cost of treatment with renal replacement therapy (RRT) is prohibitive for many developing countries while unsustainable in developed countries. The burden on national resources is further compounded by the high cardiovascular disease (CVD) burden observed in CKD patients (3, 4). In response to the socioeconomic challenges, there has been a worldwide shift towards CKD screening and early diagnosis, particularly in individuals deemed at high risk, following the 2004 call by the International Society of Nephrology for concerted global efforts to reduce the impact of ESRD (5). The need is even more dire in sub-Saharan Africa, where RRT is either absent or only available on a small scale; where available, RRT facilities are in urban centres and the cost varies widely as shown in Table 1.5 (6, 7).
Table 1.5. Cost of haemodialysis versus peritoneal dialysis in some African countriesa (7)
Country Annual cost per patient (US$)
Peritoneal dialysis Haemodialysis
South Africa 12 000 7 000
Sudan 11 500 10 500
Kenya 12 000 16 000
Senegal 19 500 27 000
Nigeria 25 000–55 000 20 000–49 000
Namibia 24 500 24 500
aFigures presented in this table are estimates provided by Sarala Naicker (South Africa), Ahmed Twahir (Kenya), Abdou Niang (Senegal), Felicia Eke (Nigeria), Ebun Bamgboye (Nigeria), and Sr. A. Prins (Namibia) in response to an e-mail-based survey conducted by the authors.
Published in Peritoneal Dialysis International. Reprinted with permission from Abu-Aisha H and Elamin S. (7) Peritoneal dialysis in Africa. Perit Dial Int 2010; 30:23–28.
Page 6 of 130
7 1.1.3. THE RISING BURDEN OF CHRONIC KIDNEY DISEASE IN SOUTH AFRICA The exponential increase in the ESRD burden has also been reported in South Africa. The 1994 South African Dialysis and Transplant Registry Report (SADTR), had 3399 ESRD patients on RRT, which was equivalent to 99 patients per million population (pmp) (6). Twenty years later in 2014, that figure stood at 178 pmp and the latest annual report from the South African Renal Registry (SARR), which has replaced the SADTR, shows that the number of ESRD patients on RRT further increased to 10 360 in 2015, a prevalence of 189 pmp (8). The report further highlights the socioeconomic disparities in accessing RRT in South Africa as this huge rise in the RRT prevalence is largely due to increased numbers of patients accessing RRT in the private healthcare sector, which only serves 16% of the population, and is observed across all the 9 provinces of the country (Figure 1). The RRT prevalence in the public sector, which is responsible for healthcare for the majority of the South African population (84%), has remained unchanged at 71.9 pmp (8). These data underscore the need for research into CKD to elucidate potential areas of intervention that can reduce the impact of CKD in our population.
Figure 1. Prevalence and numbers of patients on RRT by province (8).
Reprinted from Davids MR, Marais N, Jacobs JC. (8) South African Renal Registry Annual Report 2015. African Journal of Nephrology 2017; 20 (1):201-213. Accessed at
http://dx.doi.org/10.21807/20-1-2583 under a Creative Commons licence - http://creativecommons.org/licenses/by-nc-nd/4.0/
Page 7 of 130
8 1.2. LITERATURE REVIEW
1.2.1. RISK FACTORS FOR DEVELOPMENT OF CHRONIC KIDNEY DISEASE 1.2.1.1. Diabetic and hypertensive nephropathies
Diabetic nephropathy is the cause of ESRD in up to 40% of patients starting RRT globally (9) while hypertension is the leading cause in sub-Saharan Africa, accounting for 25–50% of patients starting RRT (10). In the 2015 SARR Annual Report, 33.7% patients had hypertensive renal disease listed as the cause of ESRD while diabetic nephropathy was reported in 14.4% (8).
These data, based on treated ESRD, probably underestimate the ESRD burden in South Africa because >50% of patients assessed for RRT in public healthcare facilities were unlikely to be accepted due to stringent selection criteria and rationing of RRT (11) hence the need for data in untreated ESRD and pre-ESRD.
1.2.1.2. Human immunodeficiency virus and other infection-related glomerulopathies
Glomerulonephritis was reported in 16–52% of ESRD in sub-Saharan Africa, with infections such as human immunodeficiency virus (HIV), hepatitis B virus (HBV) and malaria endemic in the region (12, 13). However, HBV- and malaria-associated glomerulopathies have become uncommon in some parts owing to interventions, like hepatitis B vaccination, improved living standards as well as access to healthcare (14, 15). Prevalence of glomerulonephritis (9.5%) was much lower in the 2015 South African Renal Registry Report, than in previous reports; HBV and HIV seroprevalence was 1.3% and 9.4%, respectively (8). HIV inclusion reflects changing practice in South Africa since HIV was not represented in previous ESRD data, because HIV patients were not offered RRT until recently (16). HIV-associated nephropathy (HIVAN) was shown to be the main cause of CKD in HIV in a renal biopsy study done at our institution, where it was found in 83% of HIV patients who underwent renal biopsy for proteinuria and 86% of patients with persistent microalbuminuria (17). Hepatitis C virus (HCV) infection is another known cause of glomerulonephritis, however it has not featured significantly in South Africa and was not shown to cause glomerulonephritis in a study of patients presenting to our hospital in the late 1990s although HIV patients were excluded in that study population (18).
Page 8 of 130
9 1.2.1.3. Tubulointerstitial diseases
Tubulointerstitial diseases are less common in South Africa and the rest of sub-Saharan Africa.
Cystic kidney diseases including autosomal dominant polycystic kidney disease (ADPKD) accounted for 3.3% of ESRD in the 2012 South African Renal Registry data (19). Obstructive uropathy was reported in 5% of ESRD patients in a study from Nigeria and 12% in Sudan (12).
Rarer tubulointerstitial diseases may result from renal stones, urinary tract infections, nephrotoxic drugs, systemic infections, autoimmune diseases and malignancies (2).
1.2.1.4. Demographic variables
African and Asian ethnicity are strongly associated with increased susceptibility to CKD in population-based studies (20). The earliest evidence showed a 3.8 times higher risk of ESRD in African Americans than Caucasians (21). Subsequent studies consistently showed higher age- and sex-adjusted ESRD incidence rates in African Americans compared to Caucasian Americans (22). Similarly, non-Caucasian populations in other countries showed significant excess risk of incident ESRD relative to their Caucasian counterparts (23). Age is another well-recognized risk factor, with CKD prevalence shown to rise sharply with age to 23.4–35.8% in persons ≥65 years (population prevalence: 7.2%), as well as female gender (20).
1.2.1.5. Genetic and other risk factors
Ethnic disparities in the ESRD risk lead to research into genetic susceptibility factors. In earlier studies, the myosin-9 gene (MHY9) appeared to explain the excess CKD risk with African ancestry, however, subsequent studies identified the neighbouring APOL1 gene as the main explanation for the associations previously attributed to MHY9 (24). The APOL1 gene was recently shown to be strongly associated with HIVAN in black South Africans [OR 89 (18; 912), p<0.001, for homozygotes] (25). Other factors associated with increased susceptibility to CKD include low birth weight as well as obesity, which are both also risk factors for hypertension and diabetes, further compounding CKD risk (26).
Page 9 of 130
10 1.2.2. COMPLICATIONS ASSOCIATED WITH CHRONIC KIDNEY DISEASE
1.2.2.1. Metabolic and endocrine complications of chronic kidney disease
Several disorders occur as a direct consequence of loss of endocrine or exocrine kidney function, notably anaemia, mineral metabolism disorders and metabolic acidosis. These disorders, which have been collectively referred to here as metabolic, are associated with poor renal outcomes in non-dialysis CKD with increased risk of CKD progression observed with anaemia (27, 28), mineral metabolism disorders, particularly higher serum phosphate, calcium-phosphate product, parathyroid hormone (PTH) and fibroblast growth factor-23 (29-31) as well as metabolic acidosis (32-35). Hyperuricaemia is another disorder observed with progressive CKD (36-39) and increasingly, has been associated with development of incident CKD and CKD progression (36, 40, 41).
1.2.2.2. Cardiovascular disease in chronic kidney disease
The high CVD prevalence in CKD has been well-documented since initial reports that 30–40%
of patients presenting to nephrologists had a history of ischaemic heart disease (IHD) (42, 43).
Early studies reported that CVD incidence was 2–3 times higher in predialysis CKD patients than in the general population (44). Later studies showed a 10–30 times increased CVD mortality in CKD than in the general population (4). A comprehensive review of that early evidence was published in the 2003 American Heart Association Scientific Statement, which recommended inclusion of CKD in the highest risk group for CVD risk factor prevention, detection and treatment (4). Although initial data were from dialysis and predialysis patients, recent population studies have reported the association of increased CVD events with worsening eGFR and higher albuminuria, independent of traditional CVD risk factors (45-48). These data provided evidence for including both markers in CKD risk evaluation, definition and staging (2).
The CVD burden in CKD in sub-Saharan Africa is unknown but is probably high as elsewhere.
Clinical CVD was observed in >30% of Nigerian patients with diabetic nephropathy, with PVD in 27% and stroke in 4% while none had IHD (49). Studies using left ventricular (LV) hypertrophy as a surrogate for CVD reported a high prevalence of LV hypertrophy and significant association with CKD (49-54). A study of South African haemodialysis (HD) patients reported LV systolic dysfunction in 20.2% and diastolic dysfunction in 65.1% (50). In Ethiopia, CVD was the commonest comorbid disease in a study of HD patients, present in 29.7% (55).
Page 10 of 130
11 1.2.2.3. Protein energy wasting
Abnormal protein metabolism was first recognized as a CKD complication >40 years ago when studies reported loss of body fat and lean body mass in patients with severe renal failure (56, 57).
Subsequent studies consistently reported a high prevalence of protein catabolism, muscle wasting and malnutrition in CKD but wide variation in terminology prompted development of the current definition of protein energy wasting (PEW) (58). While PEW is common in dialysis patients, prevalence in early CKD is also estimated to be higher compared to the general population, increasing as GFR declines (59-61). PEW is associated with increased morbidity and mortality in dialysis as well as predialysis CKD patients, which was mainly related to atherosclerotic CVD (59, 62). A conceptual model of the multiple mechanisms involved in PEW is illustrated in Figure 2. Improved survival has been reported with nutritional interventions, treatment of comorbidities, inflammation, metabolic and hormonal disorders as well as adequate dialysis but randomized controlled trials are lacking (63).
Figure 2. A conceptual model for aetiology of PEW and its direct clinical implications (63)
IGF-1, insulin-like growth factor-1: CKD-MBD, chronic kidney disease- mineral bone disorder;
Reprinted from Carrero JJ, Stenvinkel P, Cuppari L. et al. (63) Aetiology of the protein-energy wasting syndrome in chronic kidney disease: a consensus statement from the International Society of Renal Nutrition and Metabolism (ISRNM). J Ren Nutr 2013; 23(2): 77-90. Accessed at http://dx.doi.org/10.1053/j.jrn.2013.01.001 under a Creative Commons licence -
http://creativecommons.org/licenses/by-nc-nd/4.0/
Page 11 of 130
12 Diagnostic criteria for PEW (Table 1.6) comprise changes in serum biochemical markers, body mass, muscle mass and dietary intake. Diagnosis requires presence of at least 3 of the 4 categories, with at least 1 test fulfilled in each category.
Table 1.6. Diagnostic criteria for protein energy wasting (58, 59) Serum chemistry
Serum albumin <38 g/l
Serum prealbumin (transthyretin) <30 g/l (for maintenance dialysis patients only) Serum cholesterol <100 mg/dl
Body mass
Body mass index <23 kg/m2 (age ≥65years) or
<22 kg/m2 (age <65 years) Unintentional weight loss over time ≥5% over 3 months or
≥10% over 6 months Total body fat percentage <10%
Muscle mass
Muscle wasting: reduced muscle mass
≥5% over 3 months or
≥10% over 6 months Reduced mid-arm muscle
circumference area
>10% reduction in relation to 50th percentile of reference population
Creatinine appearance Dietary intake
Unintentional low dietary protein intake
<0.80 g/kg/day for at least 2 months for dialysis patients or <0.6 g/kg/day for patients with stages 2–5 CKD Unintentional low energy intake <25 kcal/kg/day for at least 2 months
Reprinted from Kidney Int, vol 73, Fouque D, Kalantar-Zadeh K, Kopple J et al.(58) A proposed nomenclature and diagnostic criteria for protein-energy wasting in acute and chronic kidney disease, pages 391–398, 2008, with permission from Elsevier; accessed at
http://dx.doi.org/10.1038/sj.ki.5002585; adaptation from Semin Nephrol, vol 29, Dukkipati R, Kopple J.(59) Causes and prevention of protein-energy wasting in chronic kidney failure, pages 39-49, 2009, with permission from Elsevier; accessed at
http://dx.doi.org/10.1016/j.semnephrol.2008.10.006
Page 12 of 130
13 1.2.3. PREDICTION OF GLOMERULAR FILTRATION RATE
1.2.3.1. Methods to determine glomerular filtration rate
Early detection of CKD requires that GFR can be determined easily and fairly accurately. A number of GFR prediction equations are readily available in clinical practice (64-67), providing a practical alternative to the costly gold standard methods for GFR measurement. The Cockcroft- Gault (CG) equation (64) is difficult to implement in routine laboratories because body weight and height are not usually recorded on laboratory requisitions whereas the Modification of Diet in Renal Disease (MDRD) equation (66) does not require these. Studies consistently showed that CG and MDRD equations were imprecise at high GFR levels (68). This prompted development of the Chronic Kidney Disease in Epidemiology (CKD-EPI) equation, which was shown to be as accurate as the MDRD equation at GFR <60 ml/min/1.73m2 and more accurate at GFR ≥60 ml/min/1.73m2 (67).
1.2.3.2. Performance of estimated glomerular filtration rate in different populations Discrepancies have been observed in the accuracy of eGFR equations in some populations.
Studies in Asian populations showed that predictive performance of MDRD-eGFR was poor and improved when a modified coefficient derived in the Chinese and Japanese was included (69, 70). Poor performance of eGFR equations was also found in South Asians (71). Validation studies in sub-Saharan Africa reported poor GFR prediction with CG and with MDRD as well as CKD-EPI equations, which improved when the black ethnicity correction factors were omitted in the latter two (72, 73). These studies highlighted the need for developing a coefficient or equation in a specific population that would be more suitable for that population to improve GFR prediction.
Page 13 of 130
14 1.3. RATIONALE
There is a paucity of CKD epidemiological data in South Africa. Hypertension, diabetes, obesity and HIV, collectively, pose a significant threat to the national budget as diseases of affluence increase alongside diseases of poverty. Furthermore, CKD is a recognized complication of these disorders and, with the added CVD burden, its socioeconomic implications have the potential to reach catastrophic proportions. Identification of CKD, associated risk factors and complications presents opportunities for implementing primary, secondary and tertiary prevention strategies to reduce the impact of CKD thus improving patient outcomes across the spectrum of CKD.
Therefore, an understanding of CKD epidemiology in the local population will provide substantial information necessary in healthcare planning and utilization of limited resources. An important part of the study of the CKD epidemiology is the evaluation of cost-effective diagnostic methods that can be implemented in routine clinical practice hence this formed an important component of the work presented in this thesis.
1.4. HYPOTHESIS
Several hypotheses tested in this research work were that:
1.4.1. Diabetes mellitus as well as HIV had become the commonest contributors to the burden of CKD in the local patient population, exceeding hypertension, in keeping with the emergence of diabetes as the leading cause globally and with the epicentre of the HIV pandemic being in KwaZulu-Natal.
1.4.2. The proportions of patients with advanced CKD (stage ≥3b) and related complications were likely to be high as a consequence of poor control of factors associated with disease progression as well as lack of access to specialized predialysis care by a nephrologist due to a severe shortage of nephrologists.
1.4.3. We also hypothesized that an equation developed in patients of African ancestry would predict GFR more accurately in this population compared to currently used equations that were developed in other populations and that would enable early CKD diagnosis, thus reducing the socioeconomic impact of CKD.
Page 14 of 130
15 1.5. AIM
To reduce the socioeconomic impact of CKD through determining associated risk factors and complications well as establish a suitable CKD detection method in adults
1.6. OBJECTIVES
The specific objectives have been outlined in each of the manuscripts published or submitted as part of this thesis as listed below:
1.6.1. To describe the spectrum of CKD and CVD risk factors in patients attending a rural outreach CKD clinic (Chapter 2)
1.6.2. To describe the spectrum of CKD and CVD risk factors in an urban hospital setting and prevalence of elevated serum urate as a potential therapeutic target for CKD (Chapter 3) 1.6.3. To describe the prevalence, severity and predictive factors of CKD-related metabolic
complications across the spectrum of CKD (Chapter 4)
1.6.4. To determine body composition and other components of the PEW syndrome in patients with non-dialysis dependent CKD as well as assess the relationship with GFR (Chapter 5) 1.6.5. To evaluate the predictive performance of various GFR prediction equations against
technicium-99m-diethylenetriaminepentaacetic acid (99mTc-DTPA) imaging (Chapter 6) 1.6.6. To develop a simple cost-effective method for estimating GFR that is suitable for black
South Africans (Chapter 7)
1.7. GENERAL METHODOLOGY
The work comprises a combination of observational studies undertaken at 2 major hospitals located in 2 of 3 regions in the province of KwaZulu-Natal; Area 1 is composed of the Ethekwini metro as well as districts of Ugu and Ilembe while area 3 comprises Uthungulu, Zululand and Umkhanyakude districts. Details of study participants, setting and methods are fully stated in each study included in the chapters of the thesis.
Page 15 of 130
CHAPTER 2
CHARACTERISTICS OF SOUTH AFRICAN PATIENTS PRESENTING WITH KIDNEY DISEASE IN RURAL KWAZULU-NATAL:
A CROSS SECTIONAL STUDY
Madala, N. D., Thusi, G. P., Assounga, A. G., & Naicker, S. (2014).
Characteristics of South African patients presenting with kidney disease in rural KwaZulu-Natal: a cross sectional study. BMC Nephrol. 15(1), 61.
Page 16 of 130
are only recently being offered RRT. [6] The socioeco- nomic and health consequences of CKD are well- documented globally [7,8]. Apart from the high costs of RRT, the pressure on national resources is further compounded by the high cardiovascular disease (CVD) burden observed in CKD patients. Consequently, con- certed global efforts aimed at CKD screening and early diagnosis have been called for [9]. Screening of the general population for CKD has not been considered cost-effective hence many CKD screening programs often target individuals and groups characterized by a high CKD prevalence [10]. Variable success rates have been reported from countries worldwide, including South Africa, with the best prospects for sustainability observed in programs that could be incorporated into national health policy [11,12]. Therefore, epidemiological data are needed in South Africa to provide the necessary framework for incorporating CKD early detection and management into primary level healthcare with other chronic non-communicable diseases. Our aim was to describe the prevalence of CKD and CVD risk factors and determine factors associated with CKD severity in patients presenting at a CKD clinic in the predominantly rural northern KwaZulu-Natal region, South Africa.
Methods
Study design and setting
This was a cross-sectional analysis of records kept at the clinic of consecutive outpatients seen at the dedi- cated CKD clinic at Ngwelezana hospital situated in the Uthungulu district, 5 km from the town of Empangeni and approximately 200 km north of Durban, in KwaZulu-Natal province, South Africa. The hospital provides district (primary) level and regional (secondary) level healthcare services to 20 district hospitals that pro- vide primary healthcare services to the approximately 2 million people living in the northern KwaZulu-Natal dis- tricts of Uthungulu, Zululand as well as Umkhanyakude.
The majority live in rural areas with the proportion of the population living in urban areas estimated at 14.5%, 13.4% and 3.8%, for Uthungulu, Zululand and Umkha- nyakude, respectively [13]. The region is largely poorly- resourced with the latter 2 ranked among the 10 most deprived districts in South Africa in 2007 [14]. Only acute peritoneal dialysis through a rigid catheter was offered at Ngwelezana hospital and only a minority of patients could access RRT in the academic tertiary level nephrology unit in Durban. The clinic, established by a specialist physician in 2008 to improve early CKD identification, had junior doctors, nurses, a social worker, dietician and visiting nephrologist weekly ini- tially, with less frequent visits later. The University of KwaZulu-Natal Biomedical Research Ethics Committee approved the study.
Patients
We reviewed records, kept at the CKD clinic, of all pa- tients seen from 31stJanuary 2008 to 31stJanuary 2011.
All patients presenting to the clinic were referred by pri- mary healthcare doctors from any of the 20 district hos- pitals in the geographic area served by the hospital.
Referral was at the discretion of the primary healthcare doctor and each patient presented with a referral letter from the referring doctor providing details of the clinical diagnosis made, results of investigations performed at the referring hospital as well as their current medication.
All referrals to our clinic were for kidney disease based on clinical as well as structural evidence of kidney disease noted at the referring hospital, including protein- uria and elevated serum creatinine levels. At first presen- tation to our clinic, all patients underwent clinical assessment (history and examination) and laboratory investigations were done as part of standard care. Renal disease aetiology was largely determined clinically as renal histology was unavailable except where glomerulo- nephritis unrelated to HIV was suspected and those pa- tients were referred to the tertiary center in Durban for a renal biopsy. Renal ultrasound services were available intermittently and were accessed when that was feasible.
Inclusion criteria were: Patients with a diagnosis of CKD
Exclusion criteria were: Diagnosis of acute renal failure
Data collection
The following data were recorded for each patient.
a. Demographic characteristics: Age, gender, ethnicity, source of referral, area of residence and smoking status, where ethnicity was used according to Census population classification data: African (black), white, Indian and coloured [13]. Referral source was categorized according to location of the referring hospital into: (i) Uthungulu district, in which the CKD clinic was located, (ii) Umkhanyakude and (iii) Zululand. Patients were classified as urban or rural based on Census definitions of their place of residence [13]. Smoking was recorded as (i) never smoked/ex-smoker and (ii) current smoker.
b. History: Medical history, such as hypertension, diabetes, HIV, dyslipidaemia and medication. Patient records, referral documents, current medication and pharmacy entries were used in conjunction with self-reported history to establish the diagnosis.
c. Physical examination: Anthropometric measures [weight (kg), height (cm), waist circumference (cm) and body mass index = weight/height2(kg/m2)], blood pressure (mmHg) and dipstick analysis for proteinuria. Overweight/obese was defined as
Madalaet al. BMC Nephrology2014,15:61 Page 2 of 9
http://www.biomedcentral.com/1471 2369/15/61
Page 18 of 130
presence of BMI≥25 kg/m2and/or waist
circumference≥80 cm in females and≥92 cm in males.
d. Laboratory tests: Results of blood tests recorded were - serum creatinine, total cholesterol, serum albumin and haemoglobin. Total cholesterol
>5.0 mmol/l was included in dyslipidaemia definition.
Serum creatinine results were obtained prior to the implementation of the IDMS-traceable assay and values were not recalibrated to be IDMS-traceable.
The abbreviated Modification of Diet in Renal Disease (MDRD) and Schwartz equations were used to calculate eGFR in patients aged≥18 years and
<18 years, respectively:
1. MDRD‐eGFR mLð =min=1:73 m2Þ ¼ 186 ðSerum creatinine=88:4Þ‐1:154ðAgeÞ‐0:203 ð0:742 if femaleÞ ð1:212 if African AmericanÞ [15]
2. Schwartz‐eGFR (mL/min/1.73 m2) = k x (height in cm) ÷ Serum creatinine [16]
The African-American coefficient was omitted follow- ing evidence that this improved MDRD-eGFR equation accuracy in Africans [17-19].
Definitions
CKD was defined by eGFR <60 ml/min/1.73 m2 and/or proteinuria and/or abnormal renal ultrasound, persistent for≥3 months.
Acute renal failure was defined by complete recovery of kidney function on subsequent visits after initial presentation.
Statistical analysis
Intercooled Stata version 11 (Texas, USA) was used for data analysis. Categorical data were described as propor- tions and males compared with females using the chi-square test. Continuous data were summarized as mean ± standard deviation (SD) with the t-test used to assess differences be- tween males and females. Non-normal data were expressed as median (interquartile range) and differences between the two groups were evaluated using the Mann–Whitney test.
Odds ratios (95% CI) were calculated using logistic regres- sion analysis to evaluate the factors associated with pre- senting with a low eGFR (<60- and <30 ml/min/1.73 m2).
Results
A total of 313 CKD patients, 174 (55.6%) females and 139 (44.4%) males, were seen on their first visit during the study period (mean age 47.1 ± 17.0 years). Data were available for 302/313 (96.5%) patients that were included in the analysis and 11 patients were excluded due to un- availability of clinical and/or laboratory data. The ethnic distribution of study patients was: 290/302 (96%) African (black), 4 (1.3%) Indian and 8 (2.7%) white. This closely
resembled the population distribution in the 3 districts comprising northern KwaZulu-Natal [13]. Almost two- thirds, 191 (63.3%) were referred from Uthungulu dis- trict while 85 (28.2%) and 26 (8.6%) were from various hospitals across Umkhanyakude and Zululand districts, respectively. Over half, 165 (54.6%) were classified as urban and 137 (45.4%) as rural. Table 1 shows clinical and laboratory characteristics at presentation by gender.
Significantly more males than females reported current smoking while females were more likely than males to have the CVD risk markers of being overweight/obese and having dyslipidaemia. Over 70% presented with stage 3 CKD or worse with the presenting median eGFR (IQR) being 28.9 (49.8) ml/min/1.73 m2.
Aetiology of CKD and co-morbid risk factors
Figure 1 shows that the 3 commonest diagnoses encoun- tered were: hypertension in 227 (75.2%), diabetes in 90 (29.8%) and HIV in 86 (28.5%) with similar gender distribution. Self-reported history was verified in all patients using medical records. Renal diagnoses in 21 patients referred for renal biopsy were: primary glomer- ulonephritis (16), hepatitis B virus-associated (4) and lupus nephritis (1). Tubulointerstitial diseases were ob- served in 17 (5.6%) with autosomal dominant polycystic kidney disease (11), obstructive uropathy (5) and pre- sumed analgesic nephropathy (1). Hypertension and dia- betes increased with age while HIV was prevalent in young patients (Figure 2). Multiple concomitant CKD risk factors were common (51.1%); dual co-morbidities in 136 (47.9%) patients and triple co-morbidities in 9 (3.2%). CKD was attributed to a single cause in 139 (48.9%) patients; 87/302 (28.8%) had hypertension alone, 32/302 (10.6%) had HIV alone while glomerulonephritis alone and tubulointerstitial disease were uncommon; 9/
302 (3.0%) and 5/302 (1.7%), respectively (Figure 3).
Only 6/90 (6.7%) diabetic patients had diabetes alone with concurrent hypertension in 76 (84.4%) and concur- rent HIV in 8 (8.9%). Hypertension was a co-morbid diagnosis in >50% of patients with HIV, glomeruloneph- ritis and tubulointerstitial disease as well (Figure 3).
Other cardiovascular disease risk factors
Dyslipidaemia was found in 118 (39.1%) patients overall and there was no difference in the various CKD stages (P = 0.637). In 226 patients with available data to deter- mine overweight/obese status, prevalence of dyslipidae- mia was 44.2% in overweight/obese patients and 28.6%
in those who were not, P = 0.032. Fifteen patients (6 males and 9 females) had CVD complications; stroke (8), congestive cardiac failure (6) and atherosclerotic re- novascular disease (1).
Madalaet al. BMC Nephrology2014,15:61 Page 3 of 9
http://www.biomedcentral.com/1471 2369/15/61
Page 19 of 130
Factors associated with presenting with advanced CKD Figure 4 shows that eGFR was highest in younger pa- tients and decreased with increasing age [OR = 0.48 (0.37-0.62) per 10-year, P <0.001] but there was no sig- nificant age difference in those presenting with eGFR
<15 ml/min/1.73 m2 (P = 0.099). Using logistic regres- sion analysis, independent factors associated with eGFR
<60 ml/min/1.73 m2at presentation were: age≥60 years [OR = 4.5 (2.0-10.5)], HIV infection [OR = 3.0 (1.5-5.9], hypertension [OR = 2.7 (1.4-5.0] and rural residence [OR = 1.9 (1.1-3.4)] while a lower presenting eGFR
<30 ml/min/1.73 m2 was strongly associated with HIV as well as hypertension but not with age or residence (Table 2). Disease severity at presentation was not sig- nificantly associated with gender, diabetes or referral source.
Discussion
This is the first study in South Africa to report high prevalence estimates for diabetes and HIV, 29.8% and 28.5%, respectively in a single patient cohort at a sec- ondary level healthcare-based dedicated CKD clinic. Our observations add important data on CKD epidemiology outside of a tertiary level nephrology environment,
particularly because diabetes and HIV have mostly been under-represented in previous studies. In two recent studies, diabetes was observed in 10.8% of patients in the Free State province and <5% of renal biopsies in the Western Cape province while HIV-associated nephropa- thy (HIVAN) was high in the latter study, comprising 25.7% of annual renal biopsies in 2009 [20,21]. Most HIV patients in the present study were presumed to have HIVAN since renal biopsy was largely not access- ible, which was based on a previous study from our in- stitution that showed HIVAN in >80% of HIV patients with microalbuminuria or overt proteinuria [22].
Dedicated CKD clinics typically conducted at tertiary level by nephrologists were inaccessible to most patients in this study due to various healthcare resource con- straints hence the establishment of this CKD outreach clinic. Published South African experience of nephrology outreach is limited to a study in Soweto primary health- care clinics in Gauteng province that found eGFR
<60 ml/min/1.73 m2 in 26% and nephrotic-range pro- teinuria in 9% of patients evaluated [12]. The high pro- portion of patients with advanced disease (50.6% with eGFR <30 ml/min/1.73 m2) in our clinic highlights an important reality in resource-poor settings that CKD Table 1 Distribution of demographic, clinical and laboratory data of study patients by gender
Parameter Malen = 137 Femalen = 165 P value
African 130 (94.9%) 160 (97.0%) 0.282
Rural 60 (43.8%) 77 (46.7%) 0.618
Smoking# 24/134 (17.9%) 2/158 (1.4%) <0.001
Age (years) 45.0 ± 17.6 48.5 ± 16.8 0.055
Systolic blood pressure (mmHg) 144.6 ± 28.3 141.1 ± 25.5 0.362
Diastolic blood pressure (mmHg) 84.2 ± 18.1 81.0 ± 19.0 0.153
BMI (kg/m2)# 25.4 ± 5.5 29.4 ± 7.9 <0.001
Waist circumference (cm)# 92.5 ± 15.2 98.5 ± 20.6 0.021
Overweight/obese# 55/101 (54.5%) 108/125 (86.4%) <0.001
(% with data) (73.7) (75.8)
Dyslipidaemia 40 (29.2%) 78 (47.9%) 0.001
Total cholesterol (mmol/l)* 4.1 (3.5 5.1) 4.5 (3.7 6.0) 0.009
Serum creatinine (μmol/l)* 215 (116 464) 173 (90 336) 0.009
MDRD eGFR (ml/min/1.73 m2)* 28.5 (11.8 61.9) 30.4 (13.7 63.5) 0.906
% with MDRD eGFR <60 100 (73.0%) 119 (72.6%) 0.933
% with MDRD eGFR <30 68 (49.6%) 85 (51.5%) 0.745
% with MDRD eGFR <15 44 (31.9%) 49 (29.9%) 0.707
Proteinuria 66 (48.2%) 68 (41.2%) 0.225
Serum albumin (g/l) 30.6 ± 9.6 31.3 ± 8.8 0.530
Haemoglobin (g/dl) 10.7 ± 2.7 10.3 ± 2.4 0.183
#Variables with incomplete data; the proportions with available data for smoking, BMI and waist circumference were 97.8%, 54% and 66.4%, respectively, for males while for females data were available in 95.8%, 59.4% and 67.9%, respectively.
Continuous data were summarized as mean ± SD and non normal data* as median (IQR); the 25th75thpercentiles are specified rather than the range. Categorical data were expressed as number (%).
Madalaet al. BMC Nephrology2014,15:61 Page 4 of 9
http://www.biomedcentral.com/1471 2369/15/61
Page 20 of 130
under-recognition of diabetic CKD has been identified as a barrier yet to be overcome in the global efforts against CKD, with some surveys in the United States putting patient awareness of their disease as low as 9.4%
in those with diabetic CKD [2]. Patients with suspected glomerulonephritis (non-HIV) in our province tend to be referred directly to the tertiary centre hence the low prevalence in this study differs from previous reports of glomerulonephritis as a common cause of CKD in sub- Saharan Africa [1,5,27,29,31].
The proportion of patients that were overweight/
obese in this study (86.4% in females and 54.5% in males) was substantially higher than the reported preva- lence of 58.5% and 25.4% in black South African women and men, respectively, in the general population [3]. Our observations were similar to findings in the Soweto study cited earlier, which reported that 86% of females and 40.9% of males were overweight/obese using waist circumference while prevalence was 83% and 75%, respectively, when using a composite measure of waist circumference combined with BMI [12]. Our study is the first to report a high prevalence of dyslipidaemia (39.1%) in South African CKD patients. The results are in keeping with the prevalence of dyslipidaemia or hypercholesterolaemia of 38.4% in sub-Saharan Africa reported in a recent meta-analysis of 16 studies of high cardiovascular-risk patients [32]. However, using total cholesterol to evaluate dyslipidaemia, as in our clinic, may underestimate the true burden since HDL, triglycer- ides and apolipoproteins are the major abnormalities found in CKD [33].
Study strengths and limitations
This study provides important insight into CKD and CVD risk factors in this population that has not been studied before. The results add to the much needed CKD epidemiology data in South Africa in the absence of RRT registry data and representative population stud- ies. The study is subject to the inherent limitation of a cross sectional design in which causal associations
cannot be determined between CKD severity and the various risk factors as the temporal sequence is un- known. Selection bias may have potentially occurred from preferential referral of advanced CKD patients over those with earlier CKD and contributed to the small sample size thus results may not reflect the true preva- lence in northern KwaZulu-Natal. Another limitation is the use of serum creatinine values without re-calibration to the IDMS assay as this could have introduced bias in calculating eGFR. Correction to the IDMS method sub- stantially improves accuracy of MDRD-eGFR, especially in CKD stages 1–3 although the impact of correction was shown to be minimal at GFR <45 ml/min/1.73m2 [34]. We expect the bias from non-standardized creatin- ine to be small in this study, as the median eGFR was low. This will be eliminated in future studies as all la- boratories nationally now use standardized serum cre- atinine in calculating eGFR. The validity of MDRD eGFR in HIV patients is uncertain thus using MDRD eGFR in our HIV patients may be a potential limitation.
There are no validation studies in our population and data from published validation studies in various popula- tions are inconclusive on the equation that provides the best GFR estimate. A recent systematic review of studies that evaluated MDRD eGFR reported that the perform- ance was similar in HIV-infected and HIV-negative pa- tients [35]. The absence of renal histology, CD4 cell count and antiretroviral (ARV) therapy data may also be a limitation since these may be significant risk factors for incident CKD as well as progression.
Study implications
The implications of our findings of advanced CKD in the majority (>70%) of patients, in strong association with HIV infection and hypertension, is that patients presenting with these conditions should be screened for CKD at initial presentation to primary healthcare practi- tioners and regularly thereafter. The high HIV burden in South Africa as well as the widespread national ARV therapy roll-out program with the resultant improving Table 2 Multivariable logistic regression analysis results showing factors associated with presenting eGFR <60 and
<30 ml/min/1.73 m2
Risk factor MDRD eGFR <60 MDRD eGFR <30
Adjusted OR (95% CI) P value Adjusted OR (95% CI) P value
Age≥60 years 4.5 (2.0 10.5) <0.001 1.4 (0.8 2.5) 0.261
HIV 3.0 (1.5 5.9) 0.001 2.4 (1.3 4.2) 0.004
Hypertension 2.7 (1.4 5.0) 0.002 2.3 (1.3 4.2) 0.007
Rural 1.9 (1.1 3.4) 0.021 1.5 (0.9 2.4) 0.100
Diabetes 1.7 (0.8 3.3) 0.148 1.3 (0.7 2.2) 0.415
Male gender 1.2 (0.7 2.1) 0.493 1.0 (0.6 1.6) 0.998
Referral source 1.3 (0.9 1.8) 0.131 1.2 (0.9 1.5) 0.274
Madalaet al. BMC Nephrology2014,15:61 Page 7 of 9
http://www.biomedcentral.com/1471 2369/15/61
Page 23 of 130