Plagiarism
Publications
Introduction
Bracken fern is one of the problematic invasive alien plants invading pastures worldwide (Matongera et al., 2021a). In South Africa, bracken is a problematic invader in the Drakensberg mountains, threatening the biodiversity of the pastureland (Matongera et al., 2017).
Aim and objectives
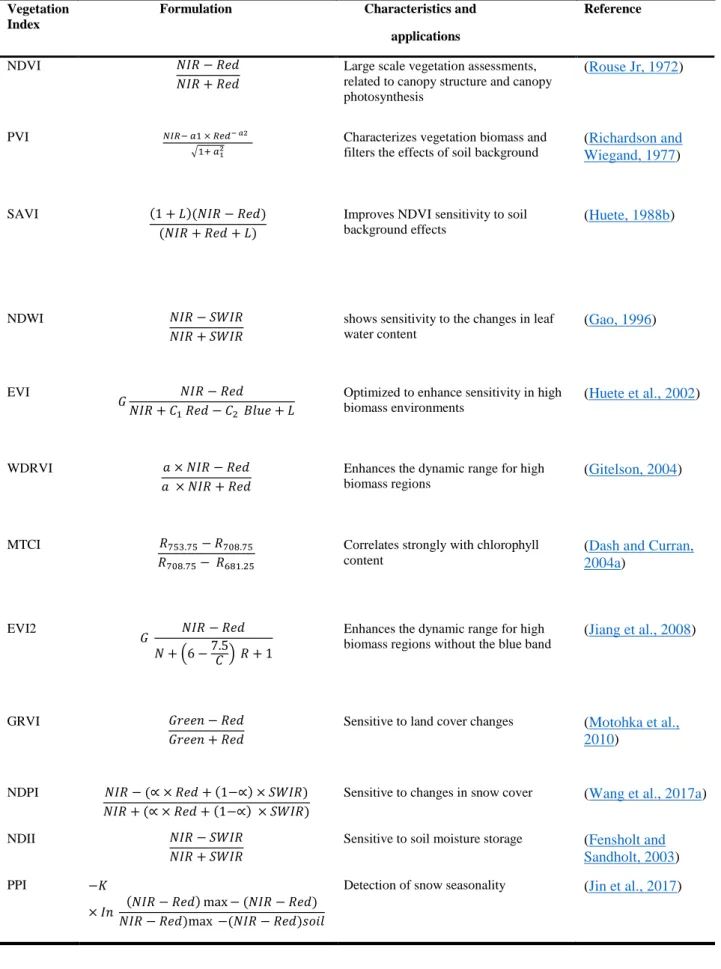
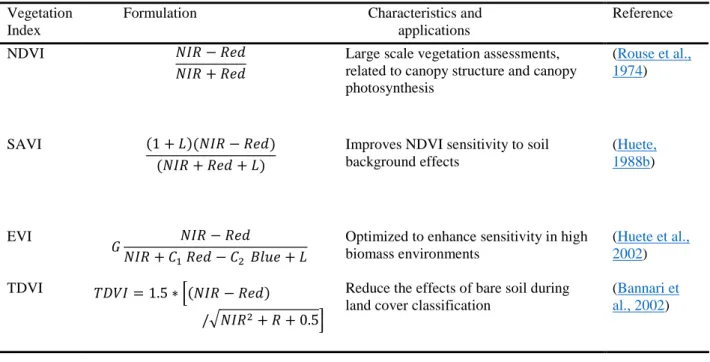
Second generation indices such as the Soil-Adjusted Vegetation Index (SAVI) (Huete, 1988b) Transformed Difference Vegetation Index (TDVI) (Bannari et al., 2002) are designed to reduce the effects of soil background and atmospheric disturbances while working with remote sensing data in various applications. As more satellite sensors with wide spectral channels were launched, the development of new vegetation indices also increased significantly (Matongera et al., 2021b).
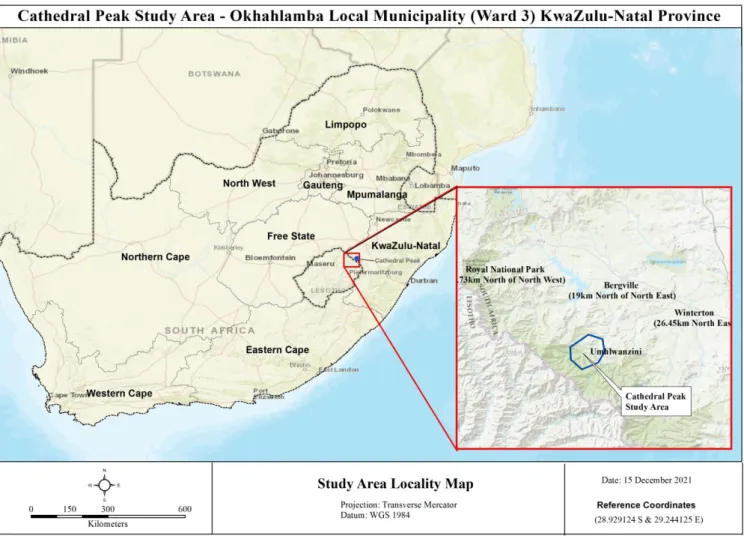
Description of the study site
Optimization of the Transformed Difference Vegetation Index for mapping and monitoring bracken phenology. Bracken fern is one of the most common invasive plants to have encroached on jungle areas in the Drakensberg.
General structure of the thesis
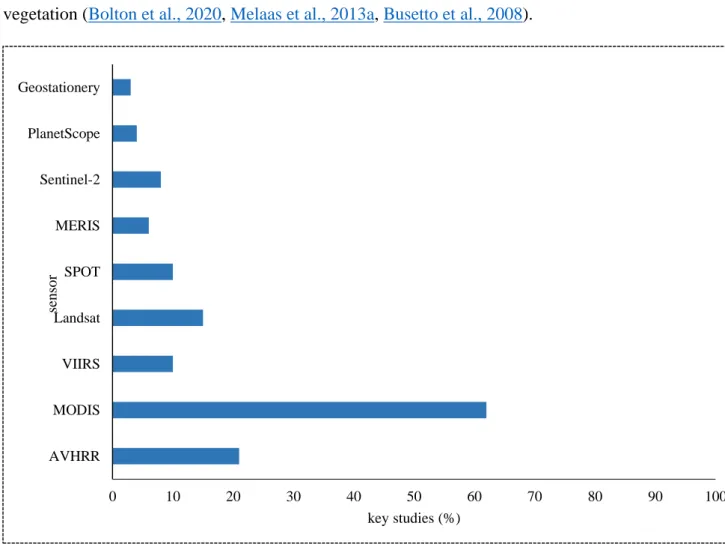
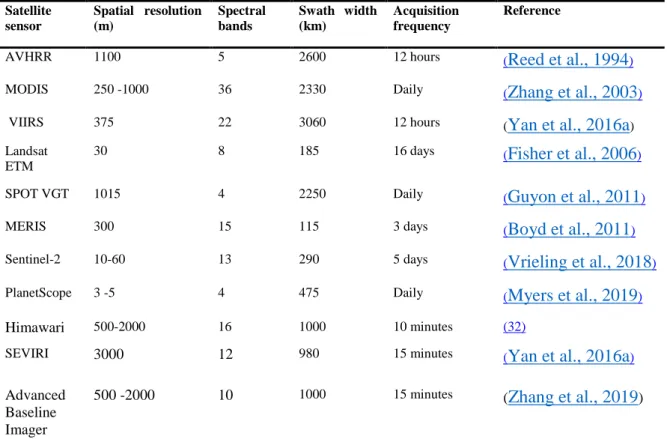
A review of progress and challenges in assessing and monitoring land surface phenology in rangeland areas. Findings from the literature revealed that the spectral characteristics of early satellite sensors such as Landsat, AVHRR, and MODIS played a critical role in the development of spectral vegetation indices that have been widely used in LSP applications.
Introduction
Vegetation indices are calculated using spectral data in the visible and near-infrared (NIR) parts of the electromagnetic spectrum (Viña et al., 2011). A very detailed synthesis of LSP phenology extraction methods using multispectral satellite data was recently published (Zeng et al., 2020).
Literature search and selection of sources
The article initially provides a detailed overview of the methodology used in selecting the literature examined in the study. Subsequently, a detailed overview is given of the developments of satellite sensors and associated VIs in LSP studies.
Satellite sensor developments in LSP studies
The biochemical chemistry and morphology of brittle fern affect its spectral reflectance behavior (Matongera et al., 2017). The Normalized Difference Vegetation Index (NDVI) (Rouse Jr, 1972) and the two-band Enhanced Vegetation Index (EVI2) (Jiang et al., 2008) were used to derive fern phenological metrics. Previous findings by (Marrs et al., 2000b) also reported that the fern breaks down in high altitude areas.
The present study assessed the spatial variability of bracken fern during the dormancy phenological stage.
Vegetation indices and biophysical variables in LSP
LSP software packages for data processing
The TIMESAT program requires gap-free time series data as a prerequisite for successful characterization of vegetation phenological cycles (Matongera et al., 2021a). Consequently, TIMESAT was revised to produce temporally and spatially continuous time series data (Gao et al., 2008).
LSP metrics validation
For example, a study in northern Japan used PhenoCam data from the Phenological Eyes Network to evaluate LSP metrics from the Himawari Satellite Imager and MODIS (Yan et al., 2019). Canada compared LSP retrievals from MODIS and SPOT with global phenological data obtained from FLUXNET (Wu et al., 2017).
Challenges and future directions in rangeland LSP
However, several studies have reported low correlations between satellite-derived phenology and bioclimatic-based phenology retrievals (Schwartz and Hanes, 2010; White et al., 2009). On the other hand, high temporal resolution sensors such as MODIS lack spatial details that can accurately track vegetation phenological events at the subspecies level (Peng et al., 2017).
Conclusion
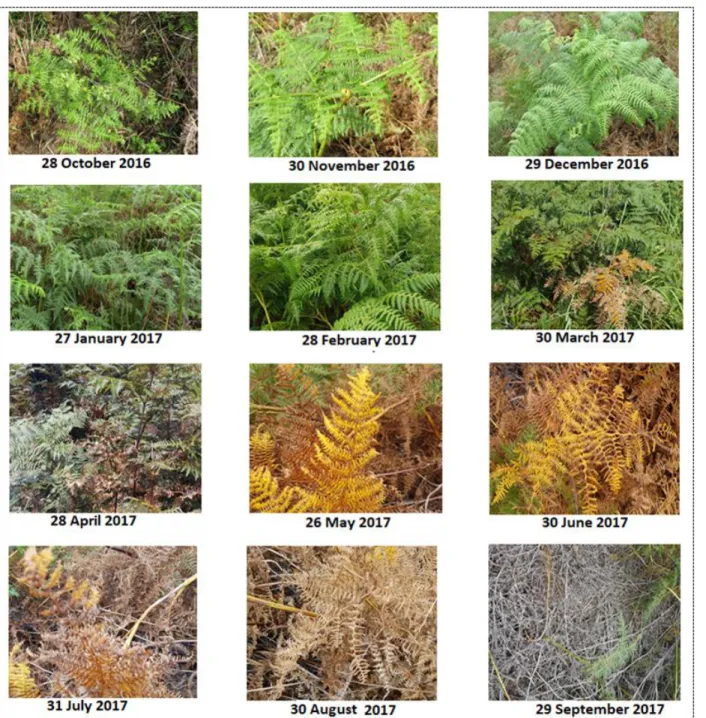
Characterization of the phenological cycle of bracken fern using time series data derived from Sentinel-2 satellite sensor. The study characterized the phenological cycle of bracken fern using NDVI and EVI2 time series data derived from Sentinel-2 sensor.
Introduction
Estimating the spatial distribution of bracken fern during the green-up phenological stage using limited soil sample data. Pixel-based classification approaches have been widely used in fern fern remote sensing.
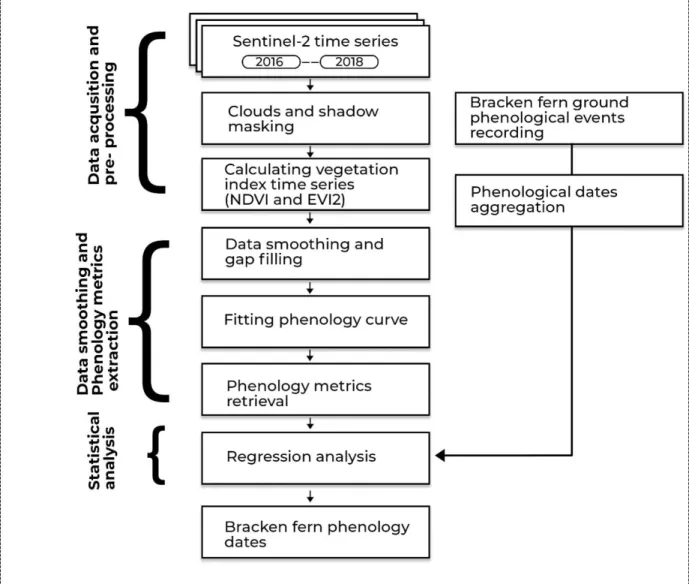
Methods and materials
- Ground observed phenology data
- Satellite data acquisition and pre-processing
- Data smoothing and phenological metrics extraction
- Statistical analysis
Results
- Variation in TIMESAT models phenological retrievals
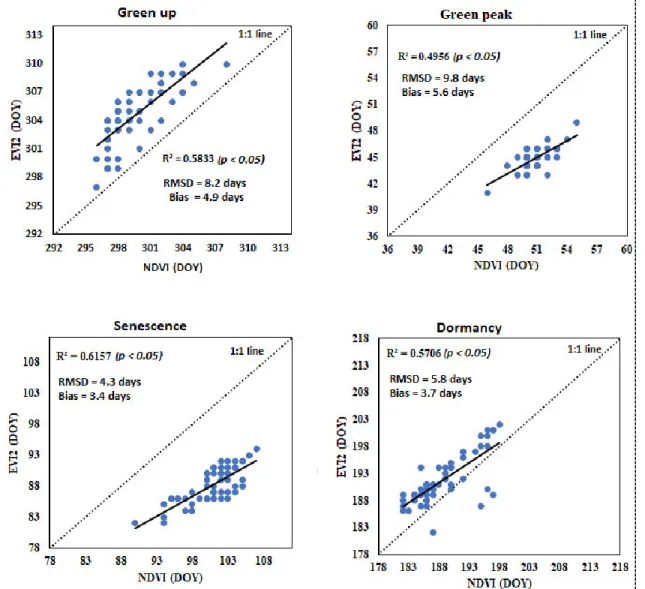
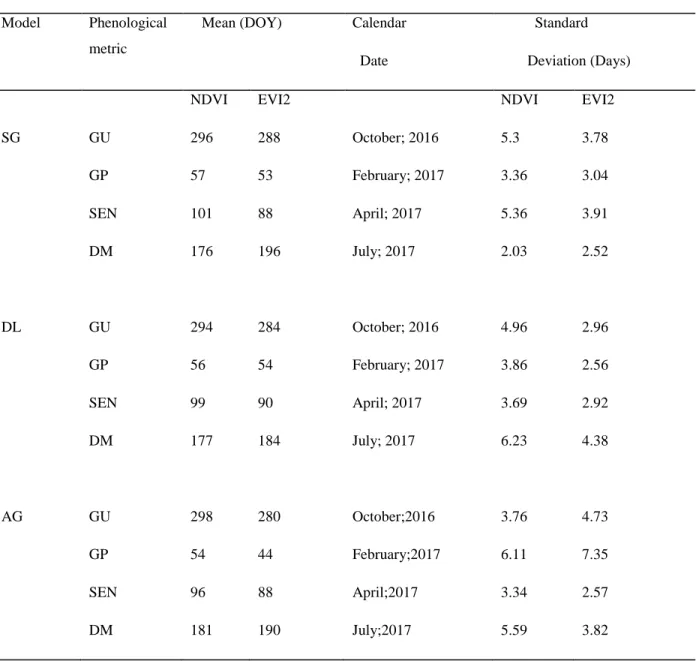
- Intercomparison of NDVI and EVI2 phenological retrievals
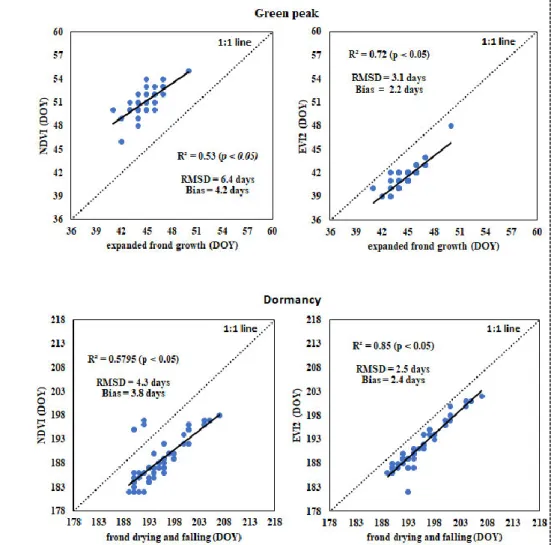
- Comparison between satellite-based phenological retrievals and ground observations
Results from our study showed that the phenological metrics estimated using NDVI and EVI2 across the four major bracken fern phenological stages were comparable. RMSD statistical values between satellite-based phenological retrievals and ground-observed phenological transition dates ranged from 2.5 to 6.4 days across the four bracken fern phenological stages.
Discussion
- The role of remotely sensed data in characterizing bracken fern phenology
- Comparisons with ground observed phenological events
- Implications to the control and management of bracken fern
The performance of NDVI in estimating the onset of fern greening can be attributed to its ability to reduce topographic effects (Huete et al., 2002) and lighting conditions (Testa et al., 2018) much better compared to EVI2. Application of chemicals to bracken during the senescence period significantly reduces the number of leaves that will be produced the following season (Pakeman et al., 1994).
Conclusions
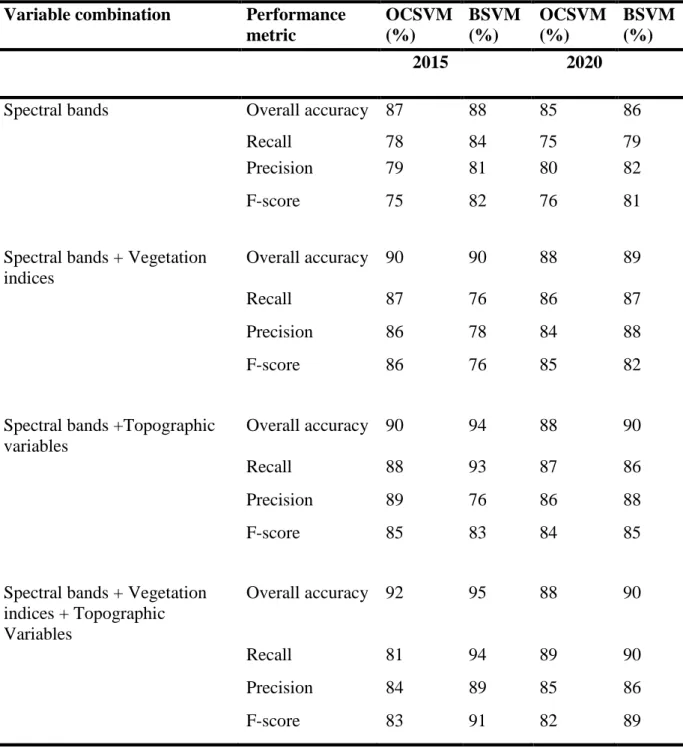
The aim of this study was to evaluate the spatial distribution of fragile fern during the phenological phase of greening. To evaluate the performance of One Class Classification (OCC) algorithms, the study analyzed the effectiveness of (i) spectral bands, (ii) spectral bands plus vegetation indices, (ii) spectral bands plus topographic variables, and (iv) all sets of data combined in the evaluation of the spatial distribution of the brittle fern during the greening phase.
Introduction
One Class Classification (OCC) is the most ideal approach for mapping invasive alien plants such as bracken ferns in inaccessible mountainous sites (Piiroinen et al., 2018). The parameters and thresholds in one class classification affect the performance of the algorithm (Seliya et al., 2021).
Data and Methods
- Ancillary data collection
- Remotely sensed data acquisition and pre-processing
- Vegetation indices
- Topographic variables
- Classification
- One Class Support Vector Machine
- Biased Support Vector Machine
- OCC model assessment
- Changes in the spatial distribution of bracken fern
The present study tested the usefulness of the OCSVM and BSVM algorithms in estimating the spatial distribution of brittle fern during the greening phenological stage. The F-score metric was also calculated to measure the accuracy of the model on the data set.
Results
- Comparison of OCC algorithms
- Comparing the performance of different variable combinations in discriminating
- Variable importance
- Changes in bracken fern distribution
The spatial distribution maps show that bracken fern in 2015 was mostly concentrated in the western parts of the study site, while the southern areas had a low infestation. The distribution maps show that bracken fern coverage has almost doubled over the five-year period.
Discussion
- OCC algorithms and data set combinations performance
- Bracken fern spatial distribution
- Implications of findings in bracken fern management
As the Drakensberg is a biodiversity hotspot (Matongera et al., 2017), it needs to be protected from further encroachment by bracken fern. The current study provides key information on the locations of bracken ferns in the Drakensberg.
Conclusions
Optimizing the Transformed Difference Vegetation Index for Mapping and Monitoring Fern Fern Phenology', International Journal of Remote Sensing, Submitted to Journal. Consequently, five Optimized Transformed Difference Vegetation Index (OTDVI) variants were developed based on the spectral band ratios that showed maximum discrimination between bracken fern and other land cover classes.
Introduction
Specifically, the spectral reflectance of bracken fern has been reported to be similar to C3 and C4 grasses such as Festuca costata and Themeda triandra (Matongera et al., 2017). In addition, studies of crop detection using TDVI vegetation mapping show excellent linearity as a function of chlorophyll content level and vegetation cover (Bannari et al., 2002).
Materials and Methods
- Field data collection
- Satellite data acquisition and pre-processing
- Separability analysis
- Optimized spectral vegetation indices
- Validation of the optimized indices
- Bracken fern phenology mapping
- Random Forest
- Feature selection
- Accuracy assessment
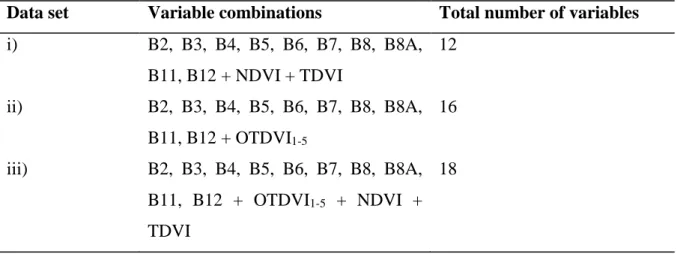
Random forest, an ensemble decision-based classification algorithm (Chan and Paelinckx, 2008) was used to test the effectiveness of the optimized spectral vegetation indices in mapping bracken fern in its four phenological stages. To test the performance of the optimized indices in mapping fern phenology, three datasets were used in the first part of the analysis as detailed in Table 5.1.
Results
- Spectral separability of bracken fern and other classes
- Correlation between LAI and optimized indices
- Mapping bracken fern phenology
- Comparison of data set accuracies
- Feature importance
- Accuracies based on the SFS best features
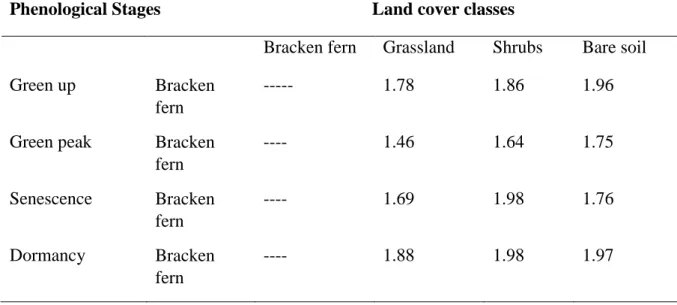
There was high spectral confusion between bracken fern and grassland during the green peak stage. Bracken fern and grass recorded the lowest TDSI score of 1.4 during the green peak phenological stage.
Discussion
- Bracken fern spectral characteristics
- Vegetation indices sensitivity to LAI changes
- Bracken fern mapping
The NDVI-LAI relationship was weak especially during the peak of the bracken fern season. The OTTVI4 and OTTVI5 performed well in the classification of bracken fern during the senescence and dormancy phenological stages.
Conclusion
Assessing the spatial variability of bracken during the phenological phase of dormancy using object-based image analysis. Assessment of the spatial variability of bracken fern during the phenological phase of dormancy using object-based image analysis', In preparation.
Introduction
Moreover, the invasion vulnerability maps, which show the spatial variability of alien and native vegetation, are crucial in the management of invasive plant-infested pastures (Turbelin et al., 2017; Dai et al., 2020). Due to the availability of freely accessible satellite sensors such as Sentinel-2 Multi-Spectral Instrument (MSI), it is possible to assess and quantify the spatial variability of ferns between landscapes (Matongera et al., 2021a).
Materials and methods
- Field data collection
- Remotely sensed data acquisition
- Bracken fern classification
- Accuracy assessment
- Topographic variables
- Statistical analysis
Second Angular Momentum Measures the uniformity or energy of the gray level distribution of the image. The validation data set was used to calculate the accuracy metrics to statistically evaluate the quality of the bracken fern classification output for spatial variability.
Results
- Classification accuracies
- Bracken variability and topographic variables
The plots illustrate the spatial variability of bracken fern spatial distribution as a function of each topographic variable during the dormancy phenological stage. As expected, the topographic wetness index shows a clear distinction in the spatial distribution of dry and green bracken during the dormant phenological stage.
Discussion
- Performance of classifiers
- Factors influencing bracken fern spatial variability
Both dry and green bracken were abundant in areas that varied over 1.5 m of terrain ruggedness. Therefore, terrain ruggedness did not significantly affect bracken fern variation during the dormancy-phenological cycle.
Conclusions
Remote Sensing of Solar Surface Radiation for Climate Monitoring - The CM-SAF Retrieval in International Comparison. Advances in satellite remote sensing for mapping and monitoring alien invasive plant species (AIPs).
Synthesis
Conclusions
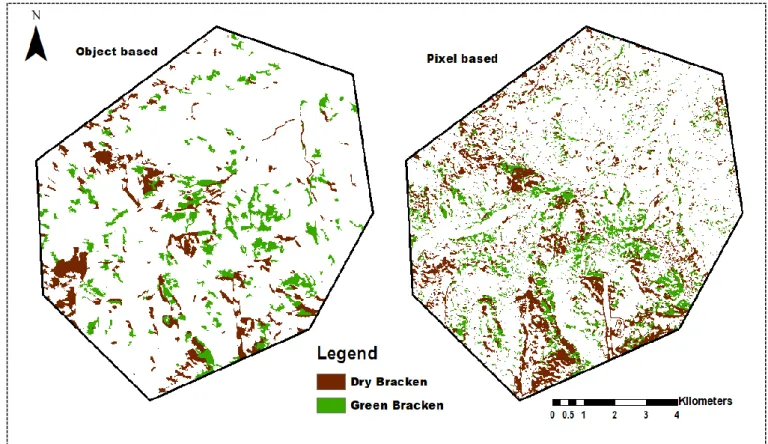
The datasets that combined spectral bands, vegetation indices and topographic variables yielded the highest accuracy in mapping bracken fern during green-up phenological stage compared to all other datasets. d) The optimized indices showed growth patterns of bracken fern that were significantly correlated with the soil. LAI measured throughout the fern's growth cycle. The optimized indices proved to be more sensitive to changes in vegetation than NDVI and TDVI, but less sensitive to the soil background. e) The object-based classification approach (OB_GLCM) that combined Sentinel-2 spectral bands and fern texture features outperformed the traditional pixel-based approach.
Recommendations for the future
Remote sensing of invasive lantana camara (verbenaceae) in semiarid savannah ecosystems in South Africa. Trends in land surface phenology inferred from passive microwave and optical remote sensing systems and associated drivers in the arid tropics 1992–2012.