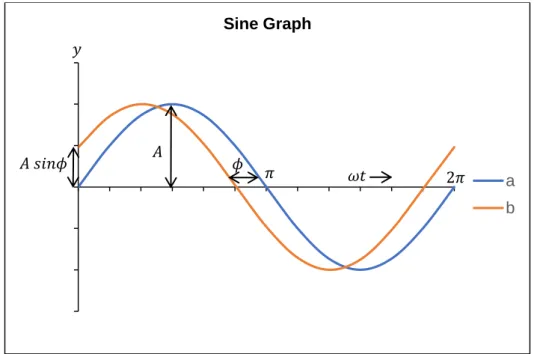
The three instruments chosen to perform the measurements of the above methods include the ABEM Terrameter LS 2, the EM 34-3, and the Proton Memory Magnetometer (G5). The elements D and I are respectively the declination and slope of the total field vector F (Sharma, 1985).
INTRODUCTION
Motivation
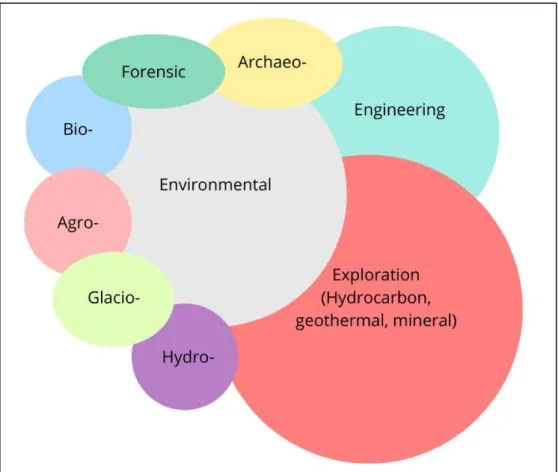
2009) and Reynolds (2011) argue that it is more efficient to use different geophysical methods for each study. Accordingly, there is a need to use a single geophysical method or instrument that could efficiently and effectively perform a specific survey.
Hypotheses
Aims and Objectives
- Aims
- Objectives
Export digitally stored data from the ABEM Terrameter LS 2 instrument to a personal computer (PC) and manually read in data obtained from the EM 34-3 and G5 magnetometer instruments into Microsoft Excel;.
LITERATURE STUDY
Geophysical Groundwater Exploration
- Electrical Resistivity Methods
- Electromagnetic Methods
- Magnetic Methods
Campbell (as cited by Fourie, 1998) stated that basic intrusions such as dunite pipes and dolerite dykes contain accessory magnetite. As a result, magnetic methods can be used during groundwater exploration projects to delineate dolerite dykes and sills (Zohdy et al., 1974 and Ranganai & Ebinger 2007).
Geophysical Methodology
- Electrical and Magnetic Geophysical Methods
- Electrical Resistivity method
- Electrical Resistivity
- Instrumentation
- Advantages and Disadvantages between the ER and the EM
- Electromagnetic Methods
- Background
- Basic EM Theory
- Noise and Limitations Associated with the Electromagnetic (EM) Method
- Types of EM Systems
- Instrumentation
- Magnetic Method
- History and Background
- The Magnetic Properties of Rocks and Minerals
- Principles and Elementary Theory
- Magnetic Intensity
- Induced and Remnant Magnetism
- Magnetic Susceptibility
- Diamagnetism, Paramagnetism and Ferromagnetism
- Remanent Magnetism and the Königsberger Ratios
- Noise
- Magnetic instruments
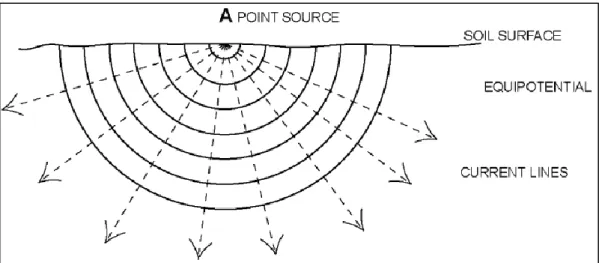
The above theory is dependent on the condition of the subsoil (its homogeneity and inhomogeneity). Transverse resistance – if the current flow is in the direction of the normal geological stratification (lower resistance known as S-value);. The unit vector field indicates the directions of the current density (J) and therefore the electric field (E).
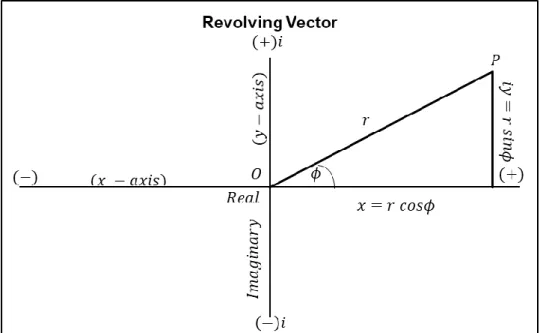
The drawbacks of the EM method, as discussed by McNeill (1990), Sharma and Baranwal (2005), Chegbeleh et al. Where ε represents the dielectric capacitance (F/m), μ represents the magnetic permeability (H/m) and σ represents the electrical conductivity (mho/m) of the medium (Telford et al., 1976 & Sharma, 1985). 1976) & Sharma (1985) state that all EM fields produced externally by a conductor (free space) are attenuated with distance from the internal conductor.
The inductance number is determined by the ratio of the coil spacings divided by the coating depth (zs). The strength of the magnetic field depends on the concentration of magnetic minerals present. This local magnetic field will overlap with the Earth's magnetic field (also known as the geomagnetic field).
The geomagnetic field can be understood as a large bar magnet located in the center of the earth. The hydrogen protons in the sensor align in the direction of the surrounding magnetic field.

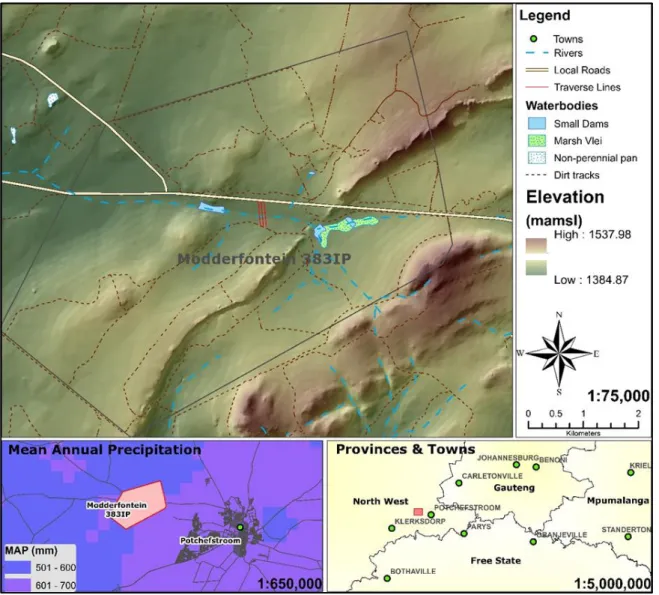
Study Area
- Climate
- Vegetation
- Introductory Geology
- Stratigraphic Geology
- Regional geology
On the other hand, McCarthy (2013) provided an informative and very well illustrated development of the geology of South Africa. As can be seen in Figure 3-3, the study area is underlain by two primary formations that include the Timeball Hill Formation of the Pretoria Group and the Malmani Subgroup of the Chuniespoort Group. The Pretoria - and Chuniespoort groups are part of the Transvaal Supergroup (Johnson et al., 2006).
2006) stated that the Campbell Rand Subgroup of the Ghaap Plateau Subbasin is estimated to be 1600 m thick. Catuneanu & Eriksson (2000) stated that the Timeball Hill Formation hosts a thickness of more than 1100 m and is located in the northern part of the Transvaal Basin. The northwestern section of Modderfontein Farm 383IP is underlain by dolomites of the Malmani Subgroup.
Rocks of the Transvaal Supergroup have a northeasterly and southwesterly orientation and are intersected by one dolerite dyke in an east-westerly direction. All of the above rocks are part of the Timeball Hill Formation, and more specifically the Klapperkop Quartzite Member. Other rocks found in the study area include andesite from the Hekpoort Formation, dolomite from the Chuniespoort Group and siltstone from the Klapperkop quartzite layer.
Instrumentation used in this study
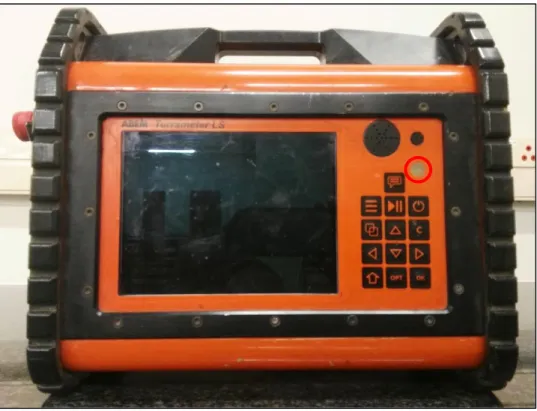
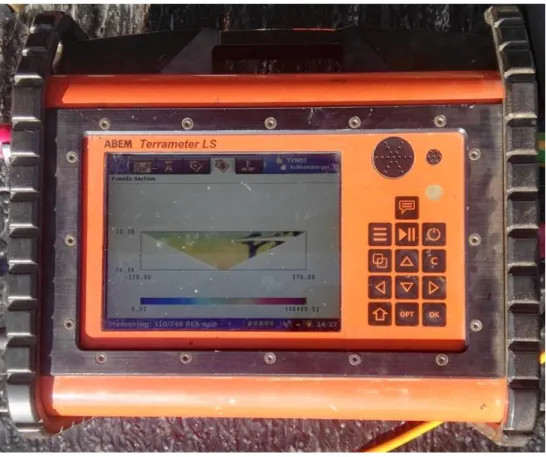
- ABEM Terrameter LS 2
- Electro Magnetometer – Model 34-3
- Proton Memory Magnetometer – Model G5
The instrument incorporates three intercoil spacings (also known as reference cables) 10 m, 20 m and 40 m enabling the EM 34-3 to explore a depth range of 7.5 m-60 m. Since the dyke was expected to be at a depth of ±30 m, the 40 m intermediate basin was chosen to be the most suitable for this study. In order to overlap the measurements and increase data resolution, the station spacing was chosen to be 20 m.
The data processing for the EM 34-3 involved interpolating the raw data into Surfer 14 to generate contour maps of the HD and VD. The raw data was smoothed (using a three-point moving average) to eliminate short-wavelength peaks. 2D graphs were made from the collected data – conductivity (mS/m) over horizontal distance (m) – for each displacement (Appendix 5 to Appendix 7).
The instrument was chosen for its ease of use, operator familiarity and proven effectiveness in underground geological and groundwater exploration. All personal belongings (such as cell phones, pocket knives, and wristwatches) that could contribute to noise were removed and put away before the field procedures began. The resulting data were plotted into 2D graphs of magnetic intensity (nT) versus horizontal distance (m) (Appendix 10 to Appendix 11).
RESULTS AND DISCUSSION
ABEM Terrameter LS 2
- Traverse 1
- Traverse 2
- Traverse 3
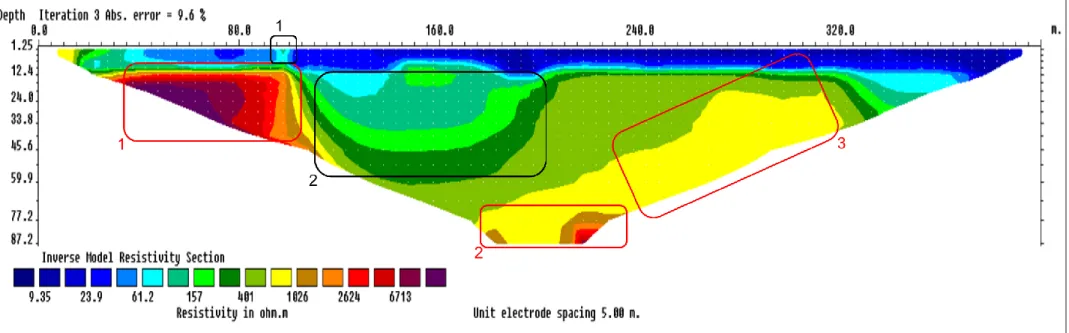
The three anomalies numbered and circled in red are expected to be the result of the geological variation. The random outcrops were encountered only on the north and south sides of the survey, not in the middle. As previously mentioned, Figure 4-2 displays the pseudo-section of the second traverse as measured by the ABEM Terrameter LS2 during the fieldwork of this study.
As in Figure 4-1, the clay layer (blue zone on top of the pseudo section is also clearly visible in Figure 4-2. As previously mentioned, Figure 4-3 shows the pseudo section of the third traverse as measured by the ABEM Terrameter LS2 during the fieldwork of this study There are, however (as is the case with Figure 4-2) minor differences in the display of the five anomalies.
The reason for the possible depth increase of the dolerite dike is the same as explained for Traverse 2. As mentioned before, the reason for the variation in the appearance of the quartzite layer is still unclear, but it exceeds the scope of this study. The reason for the expansion and deepening of the weathered zone is still due to the visible deepening of the dolerite dike.
EM 34-3
- Horizontal Dipole
- Vertical Dipole
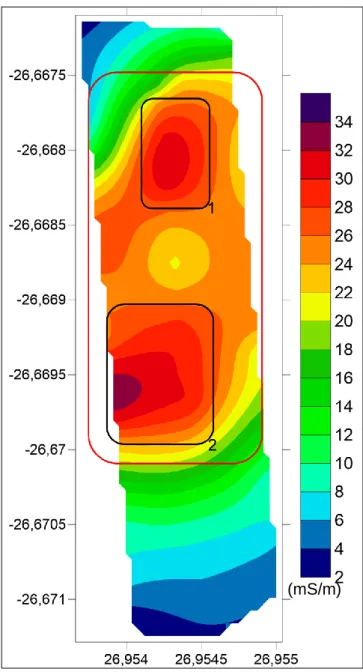
Zones of different conductivity are depicted by different intensity colors as indicated by the scale shown in Figure 4-5. Based on the color variation shown in Figure 4-5, it is clear that the EM 34-3 was successful in measuring different zones of electrical conductivity. It is unclear what the first anomaly might be, as the location of the anomaly does not match any of the previous anomalies measured by the ER data.
The second anomaly is expected to be the dolerite dyke, as its horizontal location matches the predicted location of the dyke as well as that depicted by the ER data. The third anomaly is expected to be the weathered zone, as its horizontal location is similar to that depicted by the ER data. This statement is further strengthened by Molaba (2017) who states that underground weathered zones will exhibit high conductivity.
This is due to electrolytic conductivity caused by groundwater penetrating the weathered area (Molaba, 2017). The fourth anomaly is expected to be a natural water channel, as its location matches very well with the location determined during the fieldwork of this study as well as that shown by the ER data. This statement is supported by Molaba (2017) who describes the electrolyte conductivity associated with infiltrated groundwater.
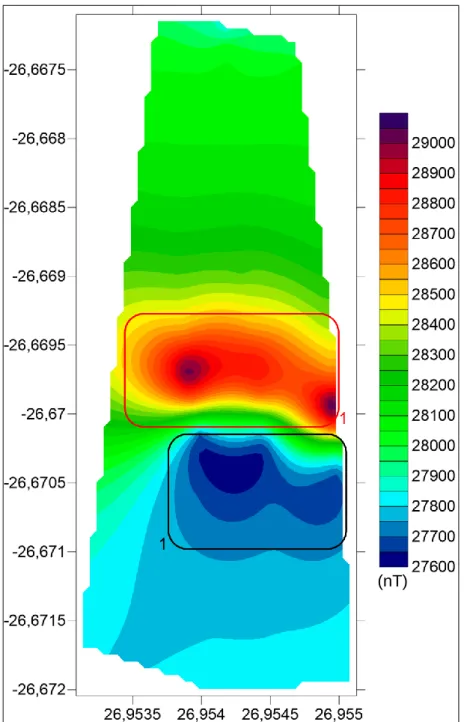
Proton Memory Magnetometer – Model G5
The anomaly numbered (1) and circled in black is associated with the weathered zone also clearly visible in Traverse 1 of the ER data. 2017) showed that weathered zones are associated with low values of magnetic susceptibility. This statement is further strengthened by the similar comparison that can be seen between the location of the weathered zone as indicated by the ER results and the location indicated by Figures 4-6. Upon further examination of the anomaly, it is noted that the anomaly does not align linearly, but rather curves in an east-west direction.
The zero point of the dyke for each traverse was thus determined to be ±320 m for the first traverse and ±350 m for the second – and third traverse. As can be seen in Appendix 10, the maximum height of the anomaly amplitudes over three traverses is different, possibly indicating a different depth below the surface. The different depths (z) of the anomaly over all three traverses have been determined using Sokolov's method (S).
It should be noted that as Bavan (2006) described, when determining the anomaly depth in this way, the depth includes the actual depth of the anomaly as well as the height of the sensor above the ground. It is also important to note that depth is the depth from the surface to the top of the anomaly (ie the shallowest part of the anomaly). Dolerite dam susceptibility was calculated using equation 56 as given by Roux et al.
CONCLUSION
RECOMMENDATIONS
Integrated geophysical methods for groundwater investigation in a karst area with or without thin cover – a case study from Tai'an City, Shandong Province, China. About the phase difference of the earth current caused by the changes in the earth's magnetic field. (Part Ⅰ). A systematic approach to the interpretation of conductivity anomalies over intrusive dolerite dykes and sills in the Karoo Supergroup.
Water management tools as a means to avert a possible water scarcity in South Africa by the year 2025. Aeromagnetic and Landsat TM structural interpretation to identify regional groundwater exploration targets, Southern Zimbabwe Craton. Audiomagnetotelluric prospecting for groundwater in the Baril coastal area, Piton de la Fournaise volcano, Réunion Island.
Geophysical measurements for subsurface mapping and groundwater exploration in the central Sinai Peninsula, Egypt. Source data file name: D:\Meesters\Veldwerk\Data\Surfer\Mag\Mag Data source Surfer.xlsx (sheet 'EM(HD)'). Source data file name: D:\Meesters\Veldwerk\Data\Surfer\Mag\Mag Data source Surfer.xlsx (sheet 'EM(VD)').