University of Cape Town
The copyright of this thesis vests in the author. No quotation from it or information derived from it is to be published without full acknowledgement of the source.
The thesis is to be used for private study or non- commercial research purposes only.
Published by the University of Cape Town (UCT) in terms of the non-exclusive license granted to UCT by the author.
University of Cape Town
University of Cape Town
Table of contents List 0
Declaration
1:
l.l
I.2 Problem 1.3
1.4 Aim 1.5
INTRODUCTION
2: LITERA TURE REVIEW
2.1 2.2 2.3 2.4
2.5 2.6 2.8
2.9
2.10
2.11
3: METHODOWGY
3.1.
3.2
3.5 Selection and
3.6 Data sources
3.6.1 and data
3.6.2 Persormel intixmation.
3.7
Cross border How Ethics
111
8 9 10 10
II 12 13
inuicators. 15
5 21 22 24 25 26
statistical models 28 31
34 34 34 35 36 37 38 38 40 42 43 44
University of Cape Town
Chapter 4: RESULTS 4.1
4.2 4.3 4.4 4.5
Derived and cross border How estimates of beds for non- metropolitan district hospitals Pert'onnance indicators for non-metropolitan district hospitals Personnel
4.6 4.7
Chapter 5:
amongslnon-melmpolitan of non-melropolitan district
of scope (md scale DISCUSSION
Costs
in the distribution of acute care beds 5.1
5.2 53 5.4
Perfonnance of n011-metropolitan acute care hospitals
Pabon Lasso in the non-metropolitan
cost and potential savings Chapter 6. STUDY LIMITATIONS
Chapter 7 POLICY IMPLICA nONS, RECOMMENDATIONS
AND CONCLUSION.
REFERENCES:
APPENDIX:
II
47 45 53 60 64 67 G9 72
75 77 79
80 82
83 87 93
University of Cape Town
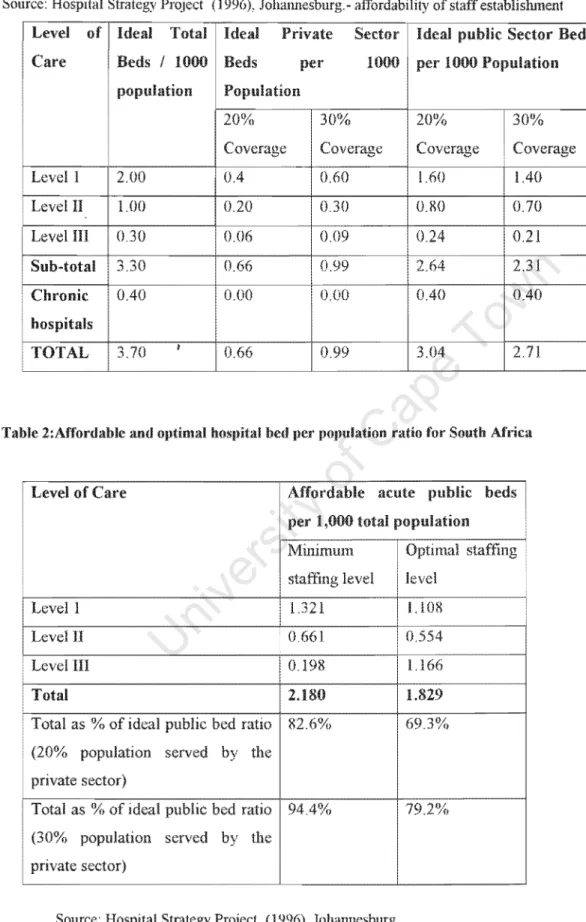
Table 1: HSP recommended proportions Itlr affonlahk: puhlic and priYate heds Table 2: Affordable and optimal per population ratin lil!' South Albca.
Table
Table 4
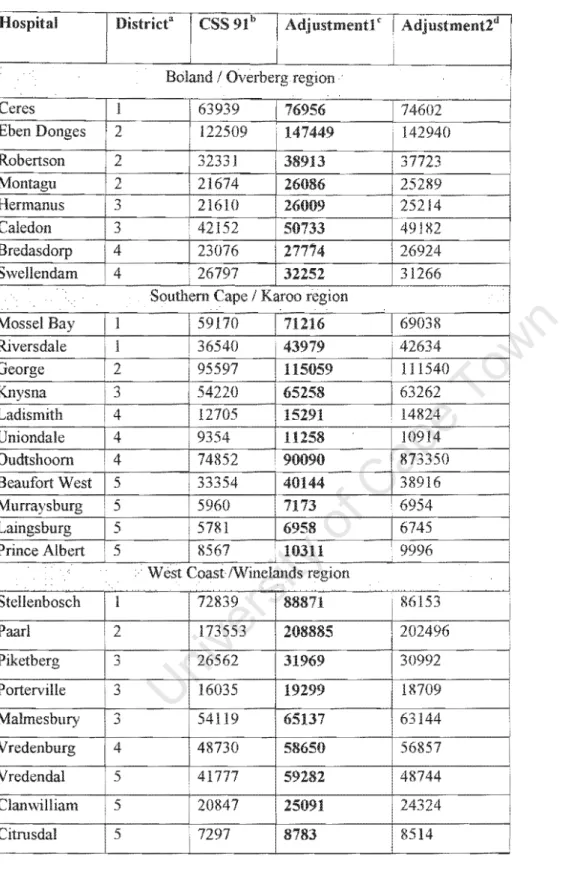
popUlation to rdlecl I ')')7.
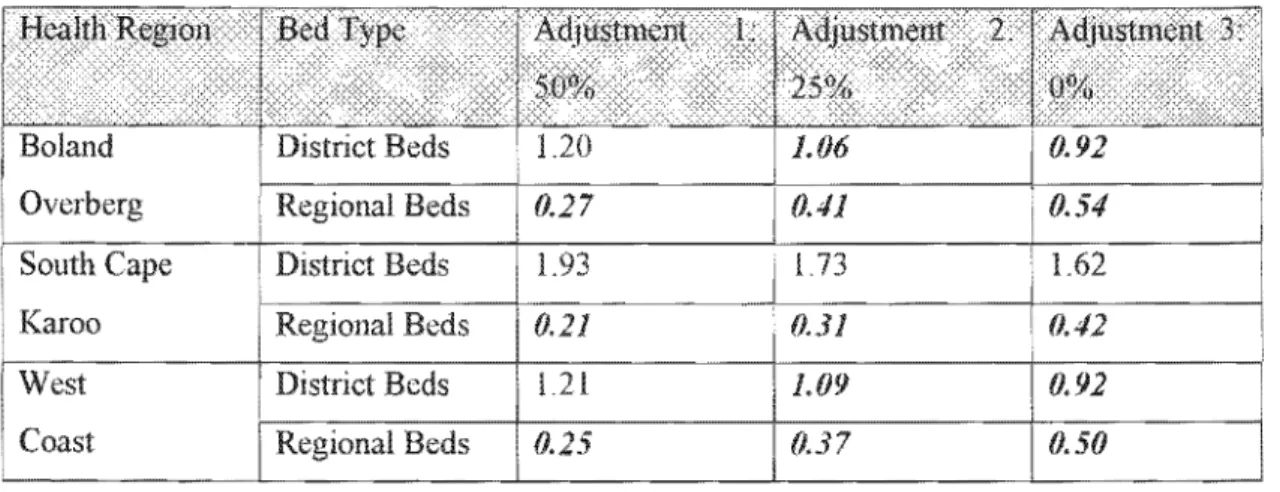
"IJlUtllleJH estimates for Districts and
... CH lUJ " , , __ > to reil eet 1997
l')!) I Census with
Table 5: Background characteristics and code used to n'I'.I·.'" .... 111 hospitals in stlllly results
111
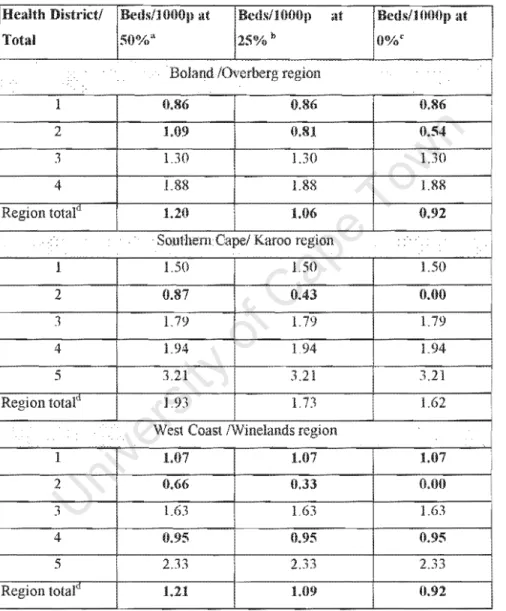
Table 6: Beds per 1000 popUlation estimates ior districts and for levels of care.
with analysis
diften .. "I1t propOitions of di5trict
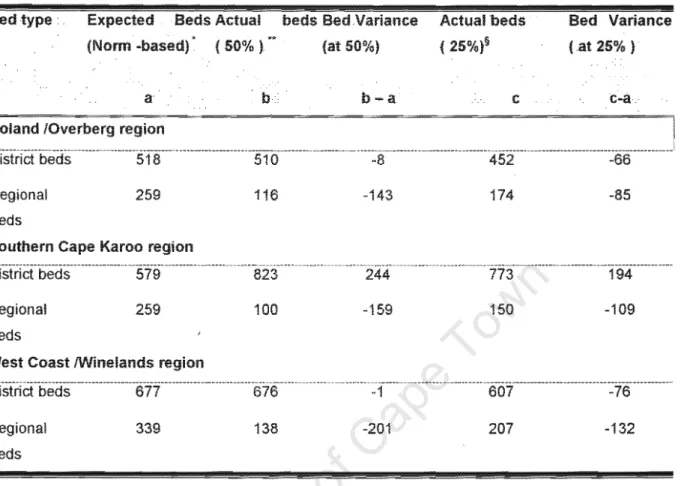
eXT)ected bed totals with estimated deviations in bed HSP affordable nonn values
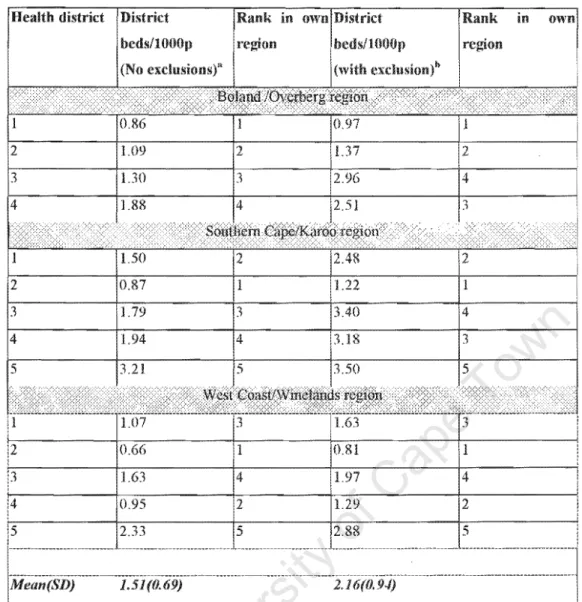
Table 9: of district beds per 1000 popUlation non-black population as proxy tbr public sector
Table 10: Summary statistic ior non metropolitan hospitals bed size
III
analysis
Table 11: Non linear analysis the ini1uence of capacity ami
on costs.
1Il
33 33
48
49
51
55
57
58
59 60
73
University of Cape Town
Figure 2:
3:
4:
5:
Figure 6:
7:
8 9:
10:
11:
12:
Figure 13:
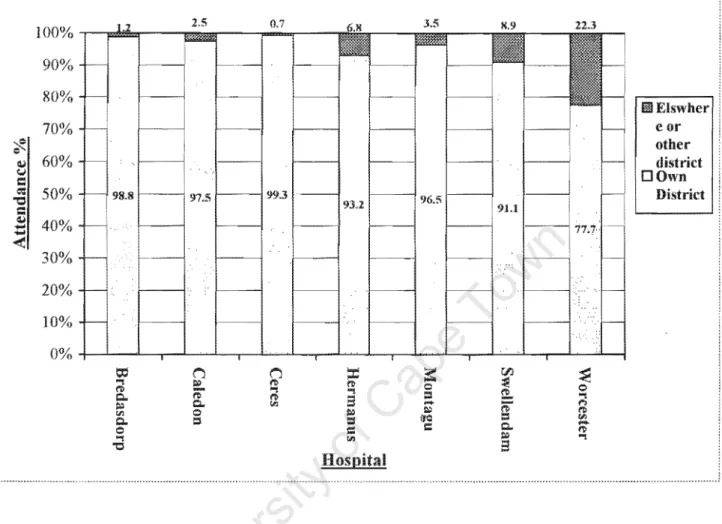
An illustration of Pabon Lasso liJr com paring 2: Proportion of Croflfl border 110w
outside the local district for Boland I
Beds per 1000 population for non-metropolitan disttict hOflpital lengths of stay for P A WC non-metropolitan district IlU,'P!!,"'.:>
Turnover rates of district
Bed occupancy rate t'(1r district
nl"r"",nn,'1 (FTE) to bed ratios for non-metropolitan district hm;pitals Nurse to bed ratio for nOll-metropolitan district hospitals
Distribution of Doctor to bed ratio for hospitals Pabon Lasso ''''''Wi''I'''' classification of relative across nOll-metropolitan district
Cost per patient thr district
Short run average cost curve tClr non metropolitan hospitals Relationship between bed occupancy and bed supply
IV
30
52
54 61 62 63 65 65 66
68 70 71 72
University of Cape Town
APPENDIX
"'-I-'I'''"'''U',-' I: Table showing all tht:
and exclusion status.
in the non-metropolitan in tenns of inclusion 93
\A."tH"''''., for Estimates by district and
Appendix 2: Population Derivations prior to adjustment ]llr Bcd I'opulation Ratios 94 3 ~_,uu.,n¥ of Raw data printout from delta') hospital inl(lIlnatiol1 for a hospital 98 4: postal code related utilisation hllspilal and for all attendance 99
applied 10 the 130land
1\1Jipena:lx 5: Result irom calculated cross border How in the Boland using inpatient
data from Delta 9 reii::renced hy postal code as proXy for residence 103
A\JpenUIX 6: Abstract at Public Health Conference 104
Appendix 7 :Reference for baseline and derived activity and perllll111anCe indicators 105
"1'1.,vHU,," 8: ot'variance int1ation factor test t(lf multicolinearity 106
University of Cape Town
ALOS
PAH HMC
HBWG
TOR NHFP
COSTPDE RAWP
SMT FMS
GIS CSS
ANOVA
Average of Stay
Provincial Administration Western Department
Provincial Hospitals Health lVlana.{~ernlem
Provincial Health Plan Hospital
Occupancy rate ate
Group
National Facility Planning
Regional Health Management lnfonnation System Cost patient day equivalent
Resource Allocation Working
ITPTnPl,r Team
Financial Management System
Administration System
Central Statistical ",'rvwr··"
Hn,,, ... t,, ,.nn","! Pr~iect
Analysis of Variance
VI
University of Cape Town
Declaration
Onwuchekwa, hereby declare that the work on which acknowledgements indicate published before.
I empower University of Town to reproduce purposes of research either whole or any portion of the contents any manner whatsoever.
Date
\'ii
University of Cape Town
This work would not have been completed without the assistance and "'~""'lJV' of various people who useful contribution at various ':>Lal">"'':>'
the Provincial Bed of Dr's Vallahbjee, but constructive mputs to shape
The kind cooperation and assistance of staff from the Provincial Health Information Management Directorate and of the Personnel Directorate, of p
Awe
and unit is appreciated valued,availed to some ... ",.,,",v.,,
inputs in of this study,
Badri
,,..."'''O''TU','' were very helpful as Zere, whose PVY'PrT'C used in the study,
phases of assistance and resources were easily the
This project is dedicated to my Nnenna for encouragement m completing work.
\Till
University of Cape Town
SUMMARY
Departments across South Africa increasing financing constraints comparable to other developing and reported internationally. During the 1997/98 financial year, Department of Health (DOH), Provincial Administration of the Cape (P A WC) huge cuts in its financial resource allocation
between already
the National
In
a further 500
as policy shifted to Province, loc:att:a in academic addressing
'-'JI', •. VHCU hospital centres care budget at
for closure. Hospitals faced with budget
province consume over 73% of the health research teams were approached to evaluate the supply of acute care hospital beds focusing on "",u,,' ... ,.,,uv and equity to guide rational policy decisions to savings from
study evaluated performance and distribution of acute care public sector district hospital beds in non-metropolitan of the Cape Province. It applied some methodologies including use of norms recommended for
Hospital (HSP). Study be
hospital resource distribution u,u.""''''F"> to savings
METHOD
All public sector acute care district Hue'",,,,,,' (either regional of acute care Aided) are
that comprehensive the
atPAWC efficiency.
nUl1n""" or Provincial were included with implications equity. Several sources including the use census population data, hospital information system with utilisation and costs are utilised after validation of the data has been performed.
drainage populations for hospitals, are rlpl'P .... n,
cross border flow
(beds 1000 population), activity (average length of
- 1
as are estimates
... ·un." .... indicators turnover rate),
University of Cape Town
",,,,ru,,,,,, mlx and of normal to delivery); and hospital cost
using cost patient day equivalent Data was and Microsoft
Excel Access with results graphic scatter plots to show distribution
variables across hospitals; Tables and Additionally,
run cost function curves and Pabon Lasso technique are used to analyse relationships and factors that hospital bed occupancy and provISIOn.
Results obtained that IS bed across between hospitals,
and the non-metropolitan regions Western with some districts
no earmarked district beds. Using Pabon Lasso technique, most (17) of hospitals the
r.or.,,.' .... " could described as inefficient. cross flow of from
other to hospitals is calculated to be 1-9% for ':>1 .. "'Ul,;>, and up to 21 % in regional hospitals,
population.
this information could contribute to planning hospital
The bed supply and hospital cost average cost curve follows a suggestive that efficiency is best optimally obtained for district hospitals with
result motivation smaller enhanced
public mix or outright reduction of hospital beds in some of the district hospitals.
Hospital cost appeared to be influenced by ownership of hospitals with P Awe owned hospitals
to be more than Aided hospitals
RECOMMENDATION AND CONCLUSIONS
the basis of this study, there is inequitable distribution of hospital beds, according to hospital, district regIOn in the non-metropolitan of the
Province. Reallocation of resources such as beds
hospitals and bed reduction for very large hospitals for identified this study as under is warranted. In carrying out the
mergers for outlier hospitals PAwe would required to of and communication ''''''"'U1U''! .... ''''' to
positive needed to bring about the desired changes.
-2
University of Cape Town
\
CHAPTER 1: INTRODUCTION
1.1
International
hospital bed supply,
country experiences reveal in the number of inpatient
acute care
length few
However, in contrast to
''''>A'v ... declining numbers of inpatient ... ,'u",,,, ... ,,,,, 1,2
LL",,,,,,,, care costs consume a of total
to but is not to factors as health sector much n"p'r"~'n at consumer levels. Some of the costs can
newer and more expensive an
a
by the costs consumer eX[JectaU increase have
consumer demand for health care. nature the cost
cost
Hospitals data from show that countries.
1,3
In
one
sector health care eXI,enOltlllI
In terms account To contain costs U""'U..,,,UL
use terms such as "health care cost explosion" to
most eX[)enSI components of the health sector. 4,5,6
and Development Co-operation (OECD) L,-V ... HLL
40-60% of the health care
.. p .. ,nrtpr! to account for over 70% of health care PVlr\PT1rl
Soviet Union.7 Hospitals In
.. ,p",nrt,prl to consume between
than those of developed level health care facility '-'fl.!-',","''"''
hospital care, some measures have been appropriate hospital utilisation. These may
4,5,6
T"'rl~.ot<>1i reduction of available beds for inpatient care, use managers to
expenditure
substitutes for n_T<~rrn (chronic) care such as home based care, planned short term or seasonal) bed
admission protocols
in the home, ambulatory surgery, the use of lW'inr""".r!
care routines. Choosing various
- 3 -
by
University of Cape Town
options presents decision "H.'UU'.., for managers. care m developing and are more likely to vU'JV;:',f,;;
care costs and budget constraints. 1, 2,8
reduction options when with
nsmg beds have a direct relationship
to hospital costs. negative "'VI".,,,,,,, resulting choosing this from such varied are not uncommon. 9,10 deadlines within which
to make decisions impact on resource been in a hurry
by managers that upon subsequent review are very little
that' the plans. I. 7 Research has an important role to decision making hospital planning and could have several applications. These are suggested by et al 1 7 to include the contribution towards rational hospital bed planning: evaluating future demand hospital care, elucidating aspects hospital performance and ALOS Further contribution of t"P<:!Pl'It'(, include, assessment impact specialisation of hospitals and inputs on access to care, imaginative ways of hospital personnel staffing, of management vv'..,a"'v1,' .... U by restructuring .... Y,,,,,.,,, improved methods planning new hospitals through use of techniques that utilise scenarios, models, and
analysis.
In South the of and health IS a situation due to
our legacy of a recent with health and other
These favoured urban to rural areas and was race-based, favouring whites" the exclusion of all racial groups in keeping with resource policies
during the apartheid years. 11,12,13 This situation contributed to an existence demand mismatches availability and of public
facilities and hospital beds that may lv,",al\;;,U ill communities not needing them.
Performance of hospitals could compromised such contributed to by under-utilisation and concomitant available resources.
the of ill hospital care access. This
observed in the Cape Province is not unlike other
resource provision and efficiency in this component of health resource .. , ... netr",
catalyst for undertaking restructuring initiatives during 1997/98 financial
Western Province, is largely to introduced and
similarly warrants a
in the for
a Racial terminology here used only to illustrate tlle racial classification that was used during ap~lrtl1eldyears and does not aim to convey of the lise of race based in research.
University of Cape Town
allocation of funds to the provinces the central rrn'",:,,· ...
were aimed amlOngst other reasons, at ensuring a move towards achieving 9
14, 15
On account
and were with
this, financial
proVInces, threatened continued provlslOn health services in Provinces more
of the Provincial Administration Western (PA WC), henceforth referred to as in this study), belonged in the of health provinces, and sought strategies efficiently ''''''''''',15''''5 the available revenue allocation order to meet service and demand.
existent in care allocation in terms of funding by at PAWC.
spent by
financial year, a R2, (l
health " ... ,..,J1( .... provision with the largest proportion amount being spent on tertiary
was for district (including rrp.."",r"
health centres (hospitals), Out hospital. while
of care was this figure,
health care accounted only 15% of expenditure [direct communication-Directorate Policy and Planning, In terms expenditure district hospitals, personnel
for 68.3% the cost.
health care eXt)endltl at highlights
which are unsustainable face of dwindling sources of revenue.
considerations prompted Health lVlCInagelnellt Committee of P A WC, to embark on several
decisions
n. ... u,,,. policy reviews in anticipation the changes strategic
from these, to a Province was This policy policy
district
rt:>r·h"."n that now u,,,,',,,,-,,,, more
as opposed to
is reinforced by shifts in
on pnmary of
care past. at
the national allocation formula as an albatross on could anchor the transformation of
line with ... VI'"'''' . . n .... """... in the blueprint to PAWC towards
efficiency, equity, affordability, ,",U\_,",U
- 5
provincial hospital bed provision in Health plan
(hospital)
16 The sets out a
University of Cape Town
L.HlHU1Ut"UF, from the HMC (oTT'ClT"'!"f' decisions on way fonvard, various task teams were set up
fund (from the European Union), which reviewed models for rationalisation tertiary and
a group (HBWG) was set up in
emanated. The was tasked with of
level hospital services.
from which this study
current bed
provision and distribution of public hospitals the Western Cape Province. concerns to be addressed were the district hospitals located in the non-metropolitan regions of the given that other of the HBWG have been tasked with responsibilities to
similar the regIOn. Members of HBWG were a 2
months deadline to conclude its from with timeframe extended a further 3 months following presentation of preliminary
the Western Province, Hospitals are catle!2:O to P A WC classification into
KeglOnal and District (Community) with level care
referrallJv'3''''''1 applicable to By using indicators such as length hospital and and the nature of care provided, hospitals are
Chronic care hospitals. Chronic into such as
psychiatric rehabilitation homes, nursing homes tuberculosis hospitals. terms of ownership, public sector hospitals in Cape Province are subdivided into P A WC
owned and Hospitals (P AH). about 90% of their
budget from PA We' s transfer payments to them and they rema1010g 10% balance hospital collected private fee paying
study the current supply of beds efficiency at
which district hospitals in the non-metropolitan ,",,..,,,uu,, function currently. and inter-regional bed supply; distribution and performance of the hospitals is evaluated.
'~,_.'"''~~''' of cross "'",..(1/'.,.. flow of patients in terms movement one or region to
another cormelctIC)fl with of hospitals is Pabon Technique
17 performance recommended by the Hospital Project (HSP) HI is utilised 10 study to assess relative performance of hospitals.
its simplicity the use
appeal
available collected activity indicators. This approach has
at least three commonly potential to promote comparison of hospital performance practical and common approaches
- - ... _ - - - -
h JIMS is acronym for Joint ""'HtaU"U Management :str.:lte~!;V
-6-
University of Cape Town
adoption by hospital administrators for hospitals over South
The this thesis is . organised into chapters ease of
understanding the background" problem,
Chapter 1, an introduction that aims and Chapter 2 n r p " P l ' U
body of research work on hospital performance utilised performance indicators. Chapter 3 discussion on
study with sources
Chapter 4
review of of utilised this analysis
obtained study.
5 ~~ mallOi[1. recommendations and
policy implications and is followed by References and Appendix sections.
- 7 -
University of Cape Town
1.2
on hospitals consumes 73% of health care budget at PAWC. Such pattern in the face dwindling to historically
such as is unsustainable.
magnitude of financial to are revealed its In
--_.~'''',", health care managers at PA we to close down about 120 regional hospital In
1997/98. Further proposals exists which lead to closure additional 500 academic hospitals in Province, expected revenue savings could not
time of this study. National Provincial
towards implementing a district based health care this desired resource reallocation
contributed as a catalyst to
policy options to consider in face resource scarcity, representing the that P A we could from are; 1) to improve use of resources, 2) loc;ancm of resources sector in a manner that
met by
about
of
lead to maximum benefit and outcome, 3) reallocation resources to health sector from sectors outside health, and 4) any combination above. 19
Given of resources to ... "' ... ,. from other sources is not a feasible option for PA we at time, policy only choose the remaining options, or combinations It is expected that gains made, would into financial
which could utilised financial demands of equally
,'V\,rt-<,"n-t programs of P Awe, as the
and Acquired Immune ..., .... u .... ' .... ."..., Syndrome (AIDS).
- 8 -
University of Cape Town
PURPOSE
purpose of this study is to provide a description of the current nTl"U"""Hl acute care hospital and also assess performance of hospitals health
of the Non-metropolitan
of the non-metropolitan ofPA we happen to be located rural areas and are the
HBWG were tasked to evaluate
because other research team member's from In metropole region methodologies.
By USIng performance indicators and other
hospital performance, this study could promote more use and adoption of indicators by health care in the provInces Africa. Further, study could contribute to empirical discussion in scientific literature through application of
methodologies cross of to
pointed out by HSP information on cross border flow is ill Africa.
study has relevance for PAWe given hospitals consume a significant portion its health care budget, and results would facilitate choices concerning resource allocation to hospitals. It may influence increased awareness about efficiency deployment hospital resources. Every made through better
deployment of available hospital resources could some money access to primary health care and overall health in the province. and community hospitals are
to have contributions to in a district as IS
currently implemented around South on experiences Sri and
'-.JUl'''«. making hospitals an important 6 The obtained from
study could be utilised by senior health managers at for planning acute care hospital proVIsIon
Further, results from the study would contribute to resource pool researchers for purpose making of hospital bed and distribution, a research area data is
the literature. 1,6,20
final aspect motivation for this study is knowledge concerning behaviour and productivity
9 -
potential to contribute towards rural hospitals in South Africa.
University of Cape Town
not been well studied, 21 to urban, metropolitan academic nOS:Dlt;al bias in previous that have a.:>il.I;;,:>,)I;;U hospital performance South Africa and many countries,
1.4
study to evaluate supply, and performance acute care, public sector hospitals in
the non-metropolitan the Cape Province
to optimal utilisation the available resources that could support attainment efficiency and equity in health care policy,
1.5
The objectives are as
1 , Review the current supply of public hospital beds the non-metropolitan regions of Western Province terms of equity and recommend changes,
2. Pilot a methodology to acute care hospitals
cross border flow of regIOns.
and the population
3. nu·rn'"c associated with or inefficient performance and utilisation of public
beds in the study in comparison to norms
4. of cost across hospitals the non-metropolitan
rl'>fT"nn" of P A WC using Pabon technique, analysis and cost function
curves.
- 10-
University of Cape Town
CHAPTER 2: LITERATURE REVIEW
2.1
There is a rising demand healthcare with equally consumer expectations on healthcare from health care have outpacing the rate at financial and other resources to deliver are made available. occupy an important in healthcare delivery and this be in terms of costs and level of care provided, all of which cannot be easily ignored. Important roles hospitals are noticeable even in the aspects of community development, hospitals impact on and impacted upon by communities in which they are located. 9,22 particular, hospitals with
other health care and resources available the to curtail
the exploding health care to 1
Restructuring resources deployed at hospitals could m substantial changes the number and distribution hospital and facilities. International experiences been quite variable as local are into consideration, it appear that
principles are usually applied. In initiatives were underpinned by considerations health determinants and health care costs 9,24 used to guide policy on rationalisation. led to implementation of that have
adjustments to the payment mechanisms for health care, changes to formula
allocation to hospitals, hospital and To illustrate
magnitude of problem that reorganisation could Saskatchewan Canada, with beds thousand population in 1 (compared to a national having most these
ocatea in rural areas, closed small health facilities
initiatives also occurred the the
and developing countries. 1
Two important approaches to resources are namely, an "economic approach"
as paramount, the which and are determined accepted approach to reclrg:amsmg
being allocation a "needs based approach"
23,24
there is no universally to Sheldon (1993), 25 a comprehensive, all-encompassing, statistically or empirically derived valid formula resource
- 11 -
University of Cape Town
base cannot achieved, therefore could use partial empirical models that could improved subjected to periodic review the future as additional information or data available.
2.2
Hospitals are very complex organisations, and attempts at detennining characteristics or products that distinguishes them have generated debates in the literature' 26,27 A hospitals performance is a of "productivity" (ratio input to and this could
using a production function and (cost per output such as represented by use "patient day equivalent").
Hospital performance be described using a theory encompassing inputs,
nrr,,,",,,,,,, and including of various components the
Hospitals utilise (personnel, drugs)
a (interfaces with patients are
outputs (products). of could directly captured through routine such as admissions or outpatient The overarching of hospitals
final which is health individuals or
the system is to
23,28.29
Flood (1994), 28 the performance to include, (ability to produce response or performance) 2) appropriateness- in terms of whether an
treatment was applied the right context 3) effectiveness In health care the commonly
to are
productivity and the has been how to measure
outputs in health care, a problem worse by the use confusing terminologies that
III of in the 28
reported to influence performance of hospitals include (public or private), efficient high standards practice feedback. 28 Intuitively, """".AU", of high standards
could it is to a financial system
reinforces productivity and efficiency standards, However, too high, or inflexible standards may cause the converse and adversely performance, hence management techniques are
relevant to of hospitals. Policy be to
DeltOl~mliflc;e through decisions components, ii) hospital's
hospitals in parameters as; i) Size a hospital and and of care iii) facility location iv)
- 12 -
University of Cape Town
appointment of medical and v) budget.3 An of how policy makers influenced hospital behaviour
IS
in the Kingdom, targetedintervention introduced have been found to reduce total ALOS and lead to improved The In efficiency which resulted was attributed to
In of improved clinical
measures leading to the i)
technique iii) financial incentives for hospitals to bed needs.1
Hospital activity captured output to input) indicators could used to evaluate performance. Illustratively, a study by Mahapatra and (1999),30 incorporated
output ratios hospital activity mix to perform combined hospital utilisation and
productivity analysis. suggested use to measure performance
2.3
1)
Lehner et al (1995), 31 who reported that efficiency could affected adversely by and physician levels by a in patient admissions.
& Mills 24 efficiency as
this patients or geographical areas, maximisation benefits to society.
be described as allocating resources different
Operational be
producing and delivering a
status.28 Operational could be performance.
the provision of in a manner to attain
as least costly or financial ... 'un""..,
health services to achieve improved health with technical efficiency
Technical efficiency as concermng hospital entails producing a
of by deploying a of (such as
personnel, and capital). It is no advocated use
comparing performance hospitals.32 importance in Ul""'U"C>HJUC> on performance relate to how health care planners can choose from various combinations inputs that have shown
to in order to obtain the most combinations
\JULW.U:'''' of achieving objectives in desired health care outcomes.
- 13 -
University of Cape Town
With the costs and productivity of inputs over policy decisions have to keep with occurring to constraints that the budget
for health services do similarly over as population
poses. demands such as composition and health needs, resulting demand-supply
entrusted hospital resources are obligated to determine the current distribution of hospital and provision. Within organisations, '-'11,,,,,,,,,,,
made various of input to produce a given output, implying
varying degrees substitution occurring its could compared III
assessments.23 In South Africa as in other developing countries, health care ... ai-."' ... ""
continue to be implemented with such programs as comprehensive primary health care "one station" by has implications terms of deployment
level health care affordability
workers are now being
available doctors are appropriately not equate to a drop in quality. 23
commitment of money to a
.nt:l.t'h,-,<,>,nt outputs implying
AU':!.!!"'''"U scopes of practice in order to ensure that
to requiring their skills given that
cause opportunity cost associated it, that could limit resources improving access amongst in need.23 Hover, choosing whether to weight measures resource provision and
utilisations on or on equity and considerations are
choices which have generated fierce debates. 33,34,35,36 some settings, of care (having a bearing on costs), and the of inputs for health outcomes including hr.',.· .. lt<'
Africa. 37,38,39,40
outputs, the on hospital performance as in South
planning could be in beds
for and assessment of productivity relative to norms such as beds per popUlation, ALOS, Occupancy rate (BOR) over rate While use of norms may appear simple and much data or additional resources, norms may unexpectedly mask Iv1\.11'-'lv" prevalent in hospitals, may from their potential to hamper efficient use resources implied assumption that one combination of inputs is
to be norms the to discourage innovation
could even re-enforce inefficient 21 exist however health care, as physician behaviour been reported to influence ALOS?3 Policy makers should therefore
- 14 -
University of Cape Town
caution drawing on the of norms that the use
norms could prevent achievement in providing hospital A
discussion "!'<lC"1'n,c" influencing pet"tolrm,mc;e indicators H'-'.'p . . , .... '" would
to H'«'''"i5'''' and therefore presented
Descriptions of commonly used hospital performance indicators.
that influence performance and metropolitan hospitals at PAW C are discussed
to evaluating performance of non- with elaboration on drawbacks indicators have been recommended South
Provinces
with the use of indicators, Some
hospitals by the HSP to allow for comparability between to uniformity of and measurements obtained,
and indicators
including norm or m as activity indicator
outpatient head counts and attendance);
efficiency BOR, theatre utilisation, turnover, admission rate per
,finance cost patient and income) indicators service
provision (beds 1000 population, health rate per and
per staff member), At several indicators are routinely collected at P A WC these are not comprehensively collected all the variables and may be incomplete for some hospitals,
La"' .... , .. '",'" of international, South and P A WC relevance ";,,,/1,1,-,,,, to
discussions on ALOS, BOR, quality of care and population norms are expanded in paragraphs below, in to useful insights that ABU,B",..,"> need to aware of
2.5
1 Admis.<;ion.<; per 1000 (100, 000) population. indicator provides information about
utilisation, It could of a community's
profile and may be by related to the adequacy or otherwise supply, demand and equity access to services, including Communities with closer proximity to
- 15 -
University of Cape Town
hospitals tend to have more admissions per 1000 population but this could change physician remunerations are linked to volume of produced, as with capitation.
doctors have hospitals, which is not case at P Awe hospitals, the number of admissions per population reflects manifestations of supplier-induced demand.
Problems can be encountered in defining the population base accurately with this performance indicator with potential for bias results obtained. data to help improve the of the estimates are not readily available, and appear not to be routinely collected by P Awe or any province to the author's knowledge. Population census result therefore becomes the potential source of data with
keeping population vu,~u"' • ..,,,. uo;;;,,-,au,)o;;; the are not
inherent problem of not
O;;;lo;;;a",,-,y very promptly.
2.5.2 Health prl~fessi()nal per bed and! or stn;U'per bed
The health professionals per bed ratio provides information about the potential level care available at a hospital, although the results obtained could be distorted by factors that affect under or over supply of beds. The various ratios for professional categ()m~s may include --,U'Of'r,')}',·
per bed" or "nurse per bed ratio ", for which the different hierarchical classifications these professional grouping are collapsed into one group, 1~ The ratios are further indicative of the relative time available to hospital doctors and nurses could be shared patients.
Indirectly, the importance of indicator could extend to providing information on the number
/
of procedures that could without much on a hospital resource and even cost.
When using health prOleS:SlOI bed ratio policy decisions, caution has to be exercised in indicator, as this could be biased and mask the situation since it does not truly take into account the skill-mix doctors and other in a hospital,
nU'Yr\1r" that affect the overall nature of care they would be hospitals with
more skilled practitioners would tend to provide more health care output.
Personnel in rural areas are compounded by problems related to attracting and retaining highly skilled health professionals to rural hospitals. This appears to be one the arpl:ITP<1T
factors militating against optimal of hospitals in several developing countries, including South Africa.t, 6 Global trends indicate the need to adequately staff district hospitals comparison to other hospital so as to enhance their especially the light of additional for district hospitals in a district health system mode1.41 Due to the potential difficulties in respect of and at rural hospitals, substitution of personnel
- 16 -
University of Cape Town
types occurs and is an acceptable policy option aimed at ensuring that provision of hospital care to communities is in the absence adequately skilled manpower. But substitutability
of personnel is not without drawbacks choices to personnel
shortages. It is dependent on existing state regulations which govern of personnel but
are by councils and boards that do not consider
expertise, training policies and cost prices2 Frustrations with routinely utilised hospital performance indicators not capturing the true productivity of hospitals have led managers to apply alternative measuring hospital performance where plays an important role. 42
Personnel norms South Africa community (district) hospitalsl~ for the professional bands namely, nurses 0.7 and 0.89 (NHFp1 and Rehmis2 respectively) and that for doctors are low
to international norms. The bed ratio for South is 0.05 and Rehmis) in comparison to 0.1 (Jamaica) to 0.4 (Indonesia), with an international average 0.1
2. A l'erage Length o.f.~tay (ALOS).
the indicators for comparing l " A ' r t l ' ' ' across hospitals, the of stay (ALOS) remains one of the most extensively used. It is defined as the duration of stay that a patient who is admitted to a hospital stays in the hospital up to the time by transfer (including home or facility) or death. ALOS is calculated by dividing the inpatient days spent (month or by the number of discharges and deaths that occurred in the month or year. Intuitively, ALOS will shorter in acute care hospitals. It is at care hospitals and rehabilitation centres because longer patient stays in these facilities. The
for acute care hospitals in South Africa recommended by are as follows: district level (urban 4-6 days, ruraI6-8days), regional (5-7 days) and tertiary (6-8 days).
A falling ALOS trend observed internationally and applicable to South Africa is expected to lead to a concomitant drop in bed occupancy. Reduction in I L L J ' L h J has the potential to free more for use patients, enabling hospitals to retain additional flexibility to cope with seasonal
requirements and other random fluctuations that influence population bed demands. 1,7
hospitals should into a potential for ALOS to be affected by patient factors, factors and hospital system factors, including interaction
1 National Health Planning nann
2 Health management infonnation (Rchmis) 1994.
- 17 -
University of Cape Town
amongst the factors that could exert more influences on ALOS than individual factors, The ALOS is also affected by lack access to referral or step down facilities that can lead to delays in connection with of patients, and could be confounded by patient
such as gender, condition at discharge, number of diseases diagnosed, year admitted, status of paTientS and the availability of home 43,44 the time admission, complementary procedures that are also performed such as patient disease group, status, diagnosis, organisational and other management that
care, The payment source could also ALOS, as could the adherence clinicians to approved drug protocols and standard treatment guidelines as would be expected,45 A reduction in could achieved through deployment of adequate numbers and of personnel and Tagushi quality improvement methods have also been
improving ALOS,46
for use in
The ALOS could similarly be monitored through the use of computerised hospital patient to obtain real-time assessments of ALOS, an approach that is practical, although the complexity of such monitoring may them unsuitable for use at PA
we
and other South African district hospitals, When used for comparing performance across hospitals, IS believed to influence a hospital's performance and cost, indicative it's total productivity, a reason that may explain why its reduction has continued to be targeted in ",""{'\N" to improveIn of its importance for performance
reduction does not always translate directly to an appropriateness care47 Such high bed occupancies which may result from reduced could opportunity cost concerns for patients if admission of acute cases is hampered by very high bed occupancy. of ALOS could be as an indicator applied to chronic patients on admissions at acute care hospitals whereby the use of an averaged length of stay may mask the actual lengths of with management implications,48 It appears as though the true ALOS hospitals cannot be determined without categorisation by levels of care and the type of hospital such as acute or chronic when comparisons across hospitals, so other indicators have be
to ALOS in determining performance, is more so, because data needed to correctly calculate true ALOS as the reveals may be unavailable or cumbersome to collect in PA
we
non-metropolitan and other South African district hospitals, the ALOSremains available indicator hospitals,
• 18 -
University of Cape Town
-
2.5.4 Bed Occupancy Rate (BOR)
Bed occupancy rate is another commonly utilised indicator of hospital efficiency for comparing performance across hospitals in countries. 1,49 It provides information on the estimated
utilisation of beds within a period as a of total bed available at a hospitaL It is calculated by dividing the inpatient days, by number of total
bed days available the interval in derived may occur because
hospitals could use different totals (approved or actual or actively used). In the Western Cape both forms of bed total are readily available, the beds actual use is usually more weight when making a choice between and the classification of beds used at P A WC are described 50
The use of BOR comparing of hospitals as sole indicator has not been
drawbacks such as pointed out by Phillip et al (1984), 51 who argued from interpretation of results from regression analysis on occupancy rates of hospitals uniform occupancy for hospitals not a good management . The reasons adduced to support this argument were that, for hospitals is influenced by several such as hospital size, number of alternative facilities that impact on referrals, and also ratio of to
hospital beds. Further lUL"L'"'' on this indicator include hospitals within the area that services a community and fluctuations in the demand for the services provided by hospitals
with in utilisation.52 to the HSP, BOR could
result from change in the access to services, case mix and problematic referral patterns. All these may not be information and periodic returns collected by administrative database, therefore BOR estimation used for comparisons, as sole indicator of
may be fraught with errors from confounders.
rates which are above 90% or those below should warrant further investigation by managers, as they depart from international and South norms which support from 1,18 This also partially reinforced by findings from a study by
.uUi'<.u.:" et al (1999), 53 using simulation model to study dynamics of bed use in emergency
admissions, with that bed rates that are over 85% are associated with a potential for bed crisis and des-equilibrium occurring at hospitals.
- 19 -
University of Cape Town
2.5.5 Bed turnover rate (TOR)
bed turnover rate (TOR) provides information on the number admitted or discharged per hospital interval implying throughput per bed. It bed utilisation and hospital productivity and is influenced by population on available hospital bed, provided, skills of hospital personnel, case mix, availability or absence of patient admission protocols. It could be at district and regional hospitals by the prevailing doctor to patient ratio, " , < .... !-,UV capacity of doctors, availability of beds and also urban-rural setting that hospitals operate in. It is derived by dividing the total number (inpatients) or the month/year by the total number of actual beds in use at hospital. Bed turnover is to be higher at lower levels
Factors such as admission of requiring short lengths of stay in situations of bed over supply may lead to inappropriately high bed turnover rates being observed, which are
undesirable and Also admission patients chronic diseases
associated predominate at acute care hospitals, inferred by observation reduced throughput per (TOR) the information obtained becomes unreliable, this a drawback in its utility for comparing ofhospitais by '''''''''",0''''
2.5.6 Betl., per 1000 population
This could be defined as the number of actually used or active hospital beds divided by the population to a population of 1000, For the actual beds supplied residents in an area implies that occurs regardless of where the care was and disregarding the usage is based on inpatient or outpatient utilisation. 3
Population based ratios depend on population densities, which relate to geographical dispersion patterns, indicator information on the supply beds and may be utilised to compare equity of access to hospital care among communities.
International norms seem to favour supply of about 4 beds per 1000 population in developed and middle income countries, this figure being exceeded in some European countries and the Soviet Union where ratios of over 9 1000 been reported. 49. However South bed
- 20-
University of Cape Town
per population ratios are quite variable across provinces and is below the international norms partly accounted for by rationalisation of hospital that has been 11,18
Bay & Nestman (1989) in their study, 54 highlight importance of determining
population. The study by utilising refinements to methodology for studying beds used a population model that considered beds 1000 population with sex
of district population, including of service load of hospitals to determine hospital population
The indicator is barriers to access and proximity to health centres. 3
Factors such as lack of appropriate data, technical infrastructure and personnel to support analysis in many developing countries South Africa, to such methodology. Considering South Africa's apartheid past, it ]s practical to assume that the available bed to population ratios in the Western those other Provinces have been determined without considerations the impact comprehensive health care and population will have on hospital bed utilisation. A baseline review the current situation of bed supply as they to hospital performance is thus warranted leading to development plans to ensure that current
supply matches demand with reduction resource in the
constraints experienced at P AWe. It is equally important to assess the proportion patients moving across districts to care due to access problems.
Cross border flow is closely to hospital population but in this study, to patients moving across administrative boundaries that could be either hospital drainage areas, health districts and even provinces in order to care. It in South Africa has been alluded to in previous publications. 18,55,56 This measure has relevance for planning acute care hospital beds as useful It may
better understanding equity of access, hospital and
to quality. matching attendance to hospitals by postal (zip) codes used as a proxy for residence is utilised with methodology. 57 It has common application in situations data on patient attendance to hospitals by postal code are readily available, such as at several P A WC hospitals. to together in comparison to fun patient addresses for analytical purposes. that have been put forward the use postal In
- 21 -
University of Cape Town
are that, are arbitrary and could represent very areas with for misclassification crosses political boundaries and with the possibility of confounding by residential area, race and variables. Also population figures may not
match those drawbacks, postal use for continue to
favoured Zip (postal) codes are common, are widely used numerical classification,
and may part of component of hospital Their
use could contribute to improving accuracy analytical especiaHy as information on postal codes could linked to geographical information (GIS) for spatial data analysis. It is likely that such types analytical work would be III demand in the
ror'es~~eaDIe future widespread GIS South
Making census population data a format that makes them already geo-coded would this and appears to a realistic expectation.
2.7
options concerning allocation beds could be through vln .... v'"' that are based on need or
demand based based allocation beds
is as being but a component
drawbacks demand hospital services. Such blurring of relationship could contribute to over supply beds with excess bed supply resulting utilisation therefore demand?3 Explanations for
are as follows; 1) that the current demand supply.
increasing supply, the demand therefore patient and physician are met leading to increased demand. 2) The further people live away from a health centre or hospital the less they are likely to attend the centre However, when additional are provided patients may sensitive to the additional and increased hospital that is
to their (or work), with resultant increased preferences to use
IS ''''..,1.1..,'-''' by and cost which apply,
opportunity cost associated with productivity. 3) With additional change with in the use of beds, constraints posed by bed is diminished and so the ALOS may actually
facilities. This elements of
23 It is thus acknowledged that the distribution, supply characteristics and behaviour of the users or community can utilisation of as by Kenneth and Mills (1985).24
-22
University of Cape Town
The survey on hospital bed supply may highlight inequitable distribution of available
that or rich-poor dimensions which should make us consider how to evaluate, distinguish or un-bundle these from attributes related to geographical location.
bed capacity could be evaluated using approaches that are based on population norms or on occupancy (such as by beds until 80% occupancy is reached). 23 Beds supply population and load are stable across different statistical methods and data sources used for estimating bed requirements, and are sensitive enough to detect changes over
could be used to identify inadequacies of bed supply.
Community bed utilisation is also affected such as payment availability and other options care o.v\.v;,;"
distribution of population, (such as home based care) and cost shifting to that may result from bed reduction as
indicate.9 that in with predominantly older populations, the impact of hospital closure on health status are beyond the on accessing health and could threaten the viability of the entire communities. These may be in the of transportation
including cost providing
hospitals may excessively high bed occupancy, all of which may hinder access to hospital care with associated longer travel distances and lost time for patients and their relatives.
9,10,22 Emigration community members may also ensue, and the doctors could similarly the community. overcome some of problems have been that when planning for hospital beds in rural areas, important factors to consider could include; topography,
type of care to be provided, cost and benefits of alternative forms of care. 24
Pertormance of hospitals may additionally affected by such as the the facility, diminishing population related to rural - urban utilisation and low bed occupancy, state of equipments deployed, difficulty in recruiting and retaining physicians who
be reluctant to relocate to rural areas, financial problem facing hospitals, proximity to hospitals, availability of more extensive medical and hospital In centres,
improvement transportation system that impact on referral support, several of Canada.9
Socio-economic among population groups create barriers to access to care that may result in equal needs for health care not being met with a commensurate level supply
- 23 -
University of Cape Town
(horizontal inequity) or the converse where unequal of IS prevalent for communities with equal (vertical inequity). 19,24
Horizontal equity i.}' defined as meaning equal access capita for PU'1JOse qf this study, discussion of the definitions and application equity considerations resource allocation .... ...""".,v... can C d ' h loun m t e lterature. . .. ,. I' 25 5N 59 W' h It a II t ese IscuSSlOn m mm , h d' . . . d consideration all the that have a bearing on pel'tolrm,mc:e hospitals within the
time of decision-making PAWC this study would be as
enormous data collection not routinely available is implied
2.8
is no acceptable universal definition of quality nor is there on the that quality, especially as concern hospitals.60• 61 Health, final outcome to be IS
not to measure readily been by proxy indicators indices as mortality, morbidity, disability, well being, quality of health status, patient education and patient satisfaction that have been used to approximate 28. 60,61,2,63 It is regrettable that individual diagnosis related group (DRG) mortality rates are poor measures of quality even when and also perceived quality has not been observed to predict admission even after adjusting for several variables that affect performance.61,62 Comparing peJ'tOJrm,mc:e across P A WC hospitals using quality indicators could be fraught with difficulties
indicators to use, especially are not all
hospitals.
Quality and costs are related to and performance of hospitals. Given the huge costs associated with running hospitals, it is to be imagined that any discussion of comparative
hospital rationalisation should costs with
hospitals. Indicators and methodologies for comparing hospitals based on hospital costs are thus
n .... ·'''''nr to at planning district hospitals bed non-
metropolitan of the Province.
- 24-
University of Cape Town
2.9
An overview commonly used indicators dependent variable is discussed below;
of hospitals with cost as a
2.9.17 O}st per total beds. This variable the total hospital cost and is derived by total hospital costs by beds. This provide information on the cost hospitals for comparative purposes, as beds are believed to indicate productive of hospitals.
2.9.2 O)st per patient (lay
This is a measure of hospital cost rather than using the absolute of expenditure to indicators on unit reflect hospital and it is to assess the impact of hospital
cost. Maclean and Mix (1991), 64 in a study of annual return hospitals, used cost patient day as the measure hospital productivity and reported drawbacks with its use that could attributed to the omission of outpatient care in estimation of hospital output with resultant of hospital costs and productivity. Therefore a measure incorporating inpatient and outpatient hospital costs such as the cost per patient day equivalent is rather
g,,!(~ste:a for use studies evaluating performance.
2.9.3 Cost per patient day equivalent
This indicator the (unit) cost of a patient or day a specified intervaL It has utility in hospital because it takes into account both inpatient and out patient could include emergency care. Further it is preferred because it makes easy comparability across as a measure of unit costs. 18,2U1,65 It is reported to have better advantages for comparisons of hospital than cost per patient day, which is
Y ... r",nrpn to limitations attributed to its not correctly productivity.66
PA
we
hospitals, a day" is calculated as the total inpatient days plus a third of out patient attendance days. However, it has been argued that using a third of outpatient may by underestimate productivity WesternLombard et al (1991), 67 who recommended that more This has not led to changes in methods reason for this could be of concern
Province to
be given to outpatient visit.
deriving this indicator at PAWC. The that the proportions frequently may lead to a loss credibility for what the estimates are meant to measure in the long term.
- 25 -
University of Cape Town
2.10
have evaluated efficiency and performance across hospitals with cost as
performance with many of cost presenting their results in the a cost function curve. cost is an empirical approach ascertaining hospitals 6::; and
reported to superior to bed occupancy measures, 68 and applicable to rural
21,70
hospitals' may
employing their use. 65
Cost curves convey number is a good
information on the and scale of production capacity that
only studies developing countries
on relationship between hospital costs and which cost curves could short run or run curves depending on span of time being considered in analysis. Given that some components of hospital cost is fixed, then only a minimum amount of the various components needed for efficient functioning would required to enhance In run, the scale of performance of a hospital could be altered through whereas the run with an abundant time interval, the scope of and deployment of additional measures to influence performance can implemented. With cost a sub-type of operational known as economy
of or is encountered. implies that a hospital
would
COSt.19, 24,71
outputs resulting in higher turnover rates which result in lower
uelbatl~s on the place of of scale for hospitals with for and
'''',,,,'''In,,, concentration of " .. .-"" .... are not uncommon .72
Independ