Given the seriousness of such accidents, SIMRAC has initiated research to identify factors that affect truck driver attention during mining operations. Subjects were also asked to rate their subjective sleepiness at work at various times during the shift using the Wits SleepWake Scale. The aim of the study was to identify factors that could affect driver attention while operating tow trucks during mining operations.
Literature Review
- Number and pattern of hours worked
- Time of the day
- Quantity and quality of sleep
- Obstructive sleep apnoea
- Shift work
- Night work
- Work-related fatigue
They were also asked to rate their level of perceived sleepiness at work at different times of a shift schedule using the Wits SleepWake scale (Maldonado, et al., 2003). Seventy operators at four mines agreed to participate in this phase of the study. Most of the studies in the literature dealing with falling asleep at the wheel involved long-haul truck drivers.
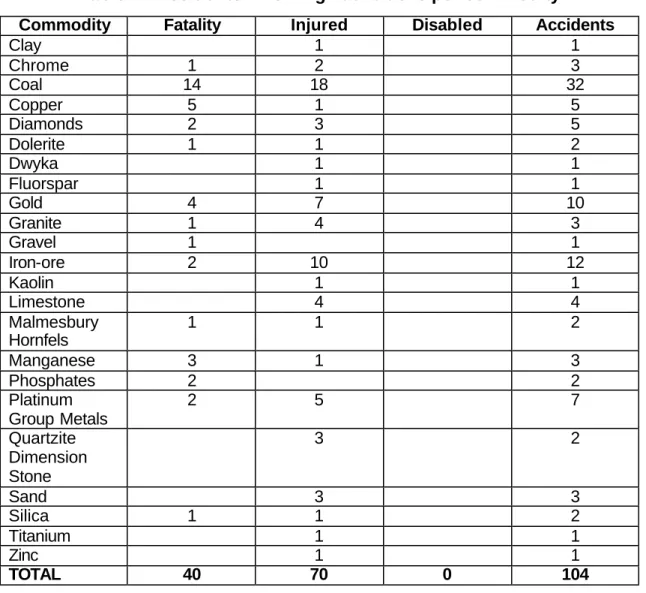
Accident Statistics
SAMRASS
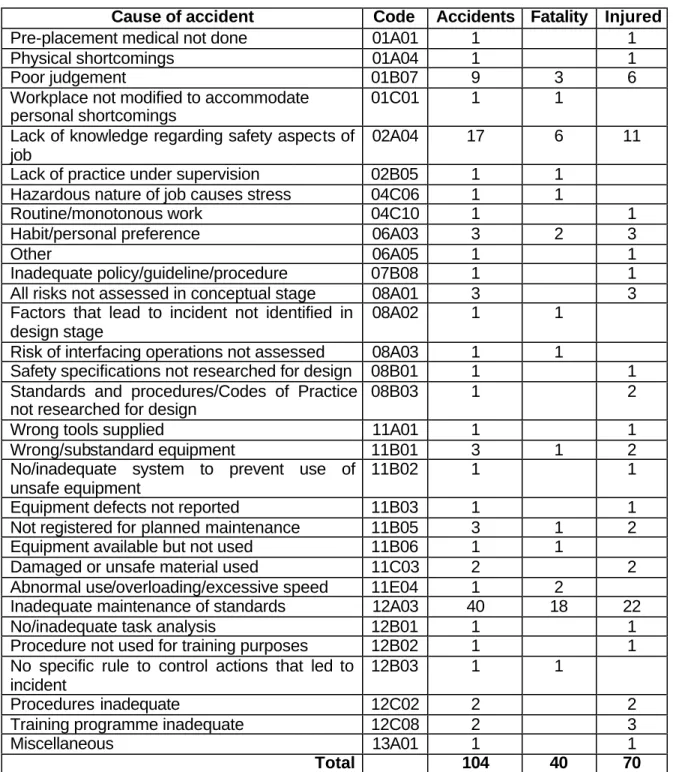
Shift work has also been found to be a factor in premature infant birth and/or low birth weight (McDonald et al., 1988; Nurminen, 1989). In 38% of the accidents shown in Table 2, 'insufficient enforcement of standards' was stated as the cause and in 16% of the accidents 'lack of knowledge about the safety aspects of the work'. Although SAMRASS is an excellent system for providing statistics, it cannot really be used for a more detailed analysis of the likely causes of and circumstances surrounding accidents, such as environmental and other mining-related factors surrounding accidents.
Mine A
Mine B
Field Evaluations
Shift cycles
9 hours for all morning shifts, 9 hours for all afternoon shifts and only 6 hours for all night shifts. The shift rotation at Mines A and D (forward and backward on the same shift schedule) was the opposite of the preferred forward rotation (morning to afternoon to evening) (Kogi, 2001). If there are several night shifts in a row, there is likely to be a greater cumulative sleep deficit towards the end of a night shift period (Escriba et al., 1992).
Feedback from questionnaire
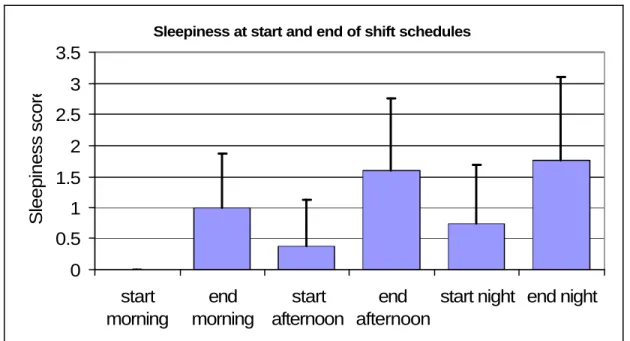
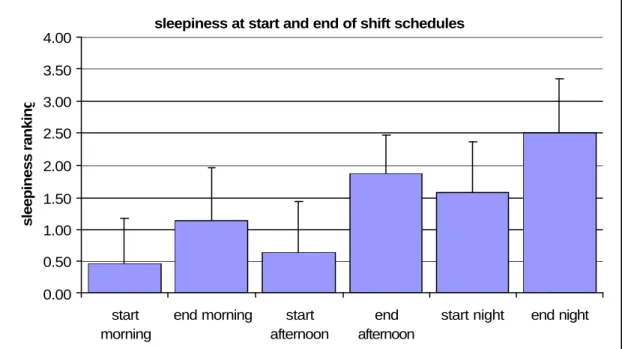
Operators reported being significantly more sleepy at the end of the morning, afternoon, and night shifts than at the beginning of each shift (paired t-test, p <= 0.02). Sleepiness scores at the beginning of the night shift were significantly higher than at the beginning of the morning and afternoon shifts (p < 0.01). Operators reported being significantly more sleepy at the end of the night shift than at the end of the morning shift (p < 0.01).
Sleepiness scores at the end of the morning, afternoon, and night shifts were significantly higher than at the beginning of each shift (paired t-test, p <= 0.0003). Operators are significantly more sleepy at the beginning of the night shift than at the beginning of the morning shift (p < 0.01). Sleepiness at the end of the morning, afternoon and night shifts did not differ significantly (p > 0.05).
Drivers reported being significantly more sleepy at the end of the night shift than at the beginning of the night shift (paired t-test, p = 0.002). They also reported being significantly more sleepy at the end of the night shift than at the end of the day shift (p = 0.007). Operators reported being significantly more sleepy at the end of their shift than at the beginning, for both day and night shifts (paired t-test, p < 0.0001).
Operators at Mine B1 were more alert than their counterparts at Mine B2 at the start of the night shift (p < 0.05).
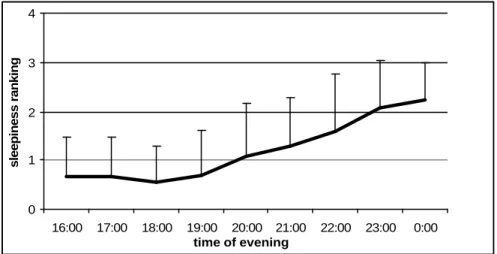
Sleepiness rating during shift
The average levels of sleepiness in mine B1 for the morning, afternoon and night shifts are given in Figures 13, 14 and 15. During the afternoon shift, levels of sleepiness began to increase from 19:00 onwards, with the highest level of sleepiness recorded towards the end of the shifts. The night shift showed a typical response, with levels of sleepiness increasing significantly from 2:00 a.m., peaking between 3:00 a.m. and 4:00 a.m., and returning to wakefulness at the end of the shift at 6:00 a.m.
The average sleepiness levels at the B2 mine for the morning, afternoon and night shifts are given in Figures 16, 17 and 18. Sleepiness levels during the morning and afternoon shifts peaked towards the end of these shifts. During the night shift, which lasted only 6 hours, the level of sleepiness increased from about 4 o'clock and peaked at the end of the shift at 6 o'clock.
The average sleepiness rankings for the morning and night shifts in Mine C are given in Figures 19 and 20. Mine D uses a rapidly rotating shift cycle, and the average sleepiness rankings for the two consecutive morning shifts and the two consecutive night shifts are given in Figures 21 and 22. The pattern of sleepiness during the second day shift was nevertheless very similar to the pattern during the first.
The results obtained at all mines are in accordance with findings from the literature showing that people who go without sleep at night and who are not used to night work do not experience their greatest feeling of drowsiness at 2 a.m., but several hours later on. more typically between 4:00 AM and 6:00 AM (Horne and Reyner, 2001).
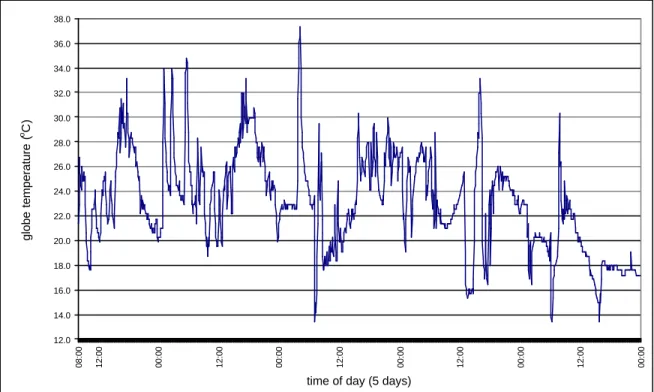
Physical stresses
The sound levels recorded in the cabins of trucks were surprisingly high (Figure 25) and could potentially pose a risk. The concentrations of carbon monoxide and carbon dioxide measured in the cabins of a number of the tractor units used in the study rarely exceeded normal background levels and never reached or exceeded the occupational exposure limits. From the pulses recorded during some of the shifts, it is clear that the operators were not subjected to undue strain.
In one of the project's mines, heart rates ranged between 56 and 105 beats per minute during the morning shift, between 73 and 100 beats per minute during the afternoon shift and between 65 and 98 beats per minute during the night shift. Figures 26 and 27 depict typical heart rate profiles of loaded truck operators during an afternoon and night shift. Poor awareness of the causes and consequences of fatigue, the importance of adequate sleep and ways to achieve it.
Long, undemanding and monotonous driving is conducive to drowsiness and increases the risk of accidents. Countermeasures that can potentially alleviate drowsiness and increase alertness in truck drivers are provided below.
Well-Designed Shift Work Schedules
Rest Days
Structured Breaks During The Shift
Sleep Management
Health Screening and Counselling
Research on the effect of food intake on alertness is quite limited and most knowledge is speculative. The timing of food intake, rather than diet content, has been shown to aid transition to a new light-dark cycle, but its effect is minimal at best (Comperatore and Krueger, 1990). The positive effects of food breaks on driver performance have been shown and the results of a study by Hubert (1972) showed that the risk of falling asleep was reduced by an increase in sugar intake.
As expected, positive effects on alertness and performance have been observed following caffeine consumption, and coffee is often used as a countermeasure to driver sleepiness. Caffeine blocks the brain's adenosine receptors, and since adenosine is believed to be a potent sleep promoter, caffeine may well have a direct effect on this aspect of the sleep system. There are also ways in which caffeine can act on alertness, for example through its effects on the synthesis and turnover of catecholamines (Battig and Welzl, 1993).
Research outside the field of driving has shown that about 150-200 mg of caffeine significantly improves alertness in drowsy people. Moderate doses, ranging from 2-4 mg/kg will cause a significant alarming effect (Meulbach and Walsh, 1995). A cup of coffee contains approximately 100 mg of caffeine.) The effect will continue for 5 to 6 hours after administration. On the other hand, if the sleep deprivation is longer than 24 hours, the use of caffeine would seem less appropriate, as significantly higher doses (6-9 mg/kg) would be required (Penatar and Thorne, 1990 ), which would cause the -effects (vibration, nervousness, etc.).
Findings also suggest that the energy drink, which contains 80 mg of caffeine and other ingredients such as taurine, sucrose, glucose and vitamin B complex, is more effective than coffee with the same amount of caffeine (Reyner and Horne, 2002).
Devices for Measuring Driver’s Wakefulness
Therefore, the various physiological measures that can be used to measure sleep may show weak associations with each other, even under the best laboratory conditions. Even closing the eyes, which occurs during the normal process of falling asleep, can be delayed to the point where individuals can sleep with their eyes open. Electroencephalographic techniques, including measurements of the electroencephalogram, electrooculogram and electromyogram, or any combination of these.
Electroencephalography (EEG) has been rated as one of the most successful monitors, using alpha, beta and theta waves to reflect the stages from full alertness to the various stages of sleep. However, it will take some time before a prototype is ready and the device can be validated. These measure the time it takes for a visual stimulus to reach the occipital lobe of the brain, and also involve the attachment of electrodes, dedicated equipment and specialized personnel.
Heart rate variability can also be used as a measure of fatigue and as a measure of the effort required to perform a task. The authors argue that failure on the test is a justification for removing a driver from driving duties, and so far the regulatory use of the system has not been challenged in court. The manufacturers of the OSPAT system are currently developing divided attention tasks within the test to capture the more complex tasks performed in mining operations.
Therefore, a measure of effort, for example the heart rate, could be used to assess the effect of having to mobilize additional effort if one is sleepy but still able to perform.
Environmental Stimulation
How many hours per week do you usually work (including driving, other work or overtime). Do you drink caffeinated drinks to stay awake, for example coffee, tea and cola? always often sometimes rarely never. How many hours do you sleep on average during a period when you are not working, for example at the weekend?
If you feel sleepy behind the wheel, do... more than 1 answer possible) A) keep driving as you are. How sleepy do you feel when you START a morning shift? highlight one of the faces below). How sleepy do you feel when you finish a morning shift. highlight one of the faces below).
How sleepy do you feel when you START an afternoon shift? highlight one of the faces below). How sleepy do you feel when you complete an afternoon shift? highlight one of the faces below). How sleepy do you feel when you START a night shift? highlight one of the faces below).
How sleepy do you feel when you DO a night shift. please mark one of the faces below). Do you have more than five hours between your meals. always / often / sometimes / rarely / never. What time of day do you think you reach your "feeling best"?