In the experiments under semi-controlled environmental conditions, the effect of applied winter cooling on flower bud production and photosynthetic efficiency was investigated. The results of the experimental series with field and semi-controlled environments suggest that precocity and flower productivity in E. Mondi and Sappi foresters for their cooperation and help in the establishment and maintenance of the field experiments.
LIST OF ABBREVIATIONS
CHAPTERl
INTRODUCTION
According to O'Neill (1993), flowering can be divided into four successive component processes: a) floral induction; b) transduction of the induced state to the meristem; c) floral evocation of the meristem, and d) organogenesis, the development of the flower. Phytohormones and nucleotides participate in the activation and derepression of the genes responsible for the development of the flower primordia (Larcher 1995, Meilan 1997). However, this practice is far from ideal as, apart from the high cost of the chemical, paclobutrazol remains active in the soil for several years, with this latter characteristic attracting increasing pressure from environmentalists (Reid et al., 1995, Moncur 1998 ).
GENERAL EXPERIMENTAL PROCEDURES
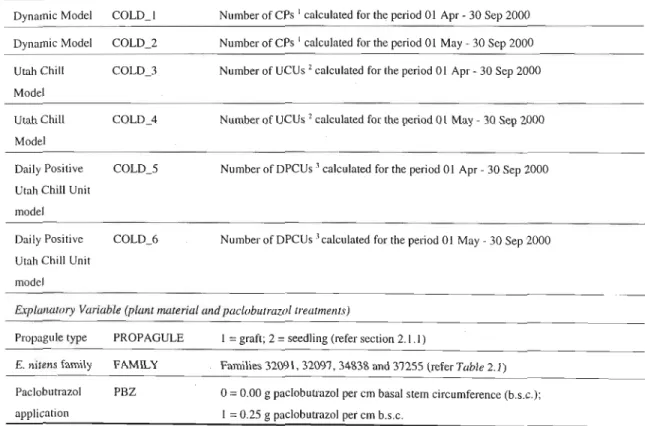
Dynamic Model
The dynamic model was developed in a similar way to the Utah model, but is more sophisticated. The model considers not only the positive effect of low temperatures and the negative effect of high temperatures on chilling accumulation, as the Utah model has, but also the positive effect that moderate temperatures have on chilling accumulation and the effect of cooling cycle length on high-temperature denial (Fishman et al. 1987a andb). When a critical level (1.0) or amount of "intermediate" is accumulated, it is irreversibly transferred in the second step to the amount (one part) of the stable dormancy breaking factor.
The temperature response curve for the Dynamic Model indicates that optimum cooling occurs at temperatures between 6 and 80C and no cooling effect at -20C and 130C. Moderate daytime temperatures between 13 and 150C increase the cooling effect of temperatures in the optimum range. The model has proven to be equally accurate for areas with moderate or cold winter climates (Linsley-Noakes et al. 995, Allan 1999).
The Diurnal Positive Chill Unit (DPCU) model, a modification of the Utah Chill Model, was proposed and developed by Linsley-Noakes (1995). The main problem with the Utah Chill model was that good bud break would occur in areas with mild winters despite the fact that negative amounts of UCUs had accumulated. Dynamic Model features were used to modify the Utah Chill Model to allow more accurate prediction of winter chill accumulation in areas with mild winters (Linsley-Noakes et al. 1994).
Allan's (1999) suggestion that the Daily Positive Utah Chill Unit be abbreviated as DPCU will be adopted for all further discussion in this thesis.
EFFECT OF WINTER CHILLING AND PACLOBUTRAZOL ON VEGETATIVE GROWTH AND FLORAL BUD PRODUCTION IN
Number of trees with one or more screens in each plot (rep), expressed as a percentage of the total number of live trees in the plot. In the April 1999 flowering assessment (three years after planting), none of the seedlings were marked with screens. The percentage of screen-producing ends for the control (null . paclobutrazol) (13.3 %) was double that of the paclobutrazol-treated ends (6.0%) (Table 3.6).
The results of the analyzes of variance for the percentage of trees that produced UMBels at five years after planting are presented in Figure 3.2. Die grafiek toon die resultate van die afsonderlike variansieanalises vir die vier verskillende Propagulex PBZ -behandelingskombinasies. Hierdie resultate versterk die bestaande kennis van die teenwoordigheid van 'n aansienlike variasie binne die gesin, met betrekking tot die voorkomiteit, in die Suid-Afrika.
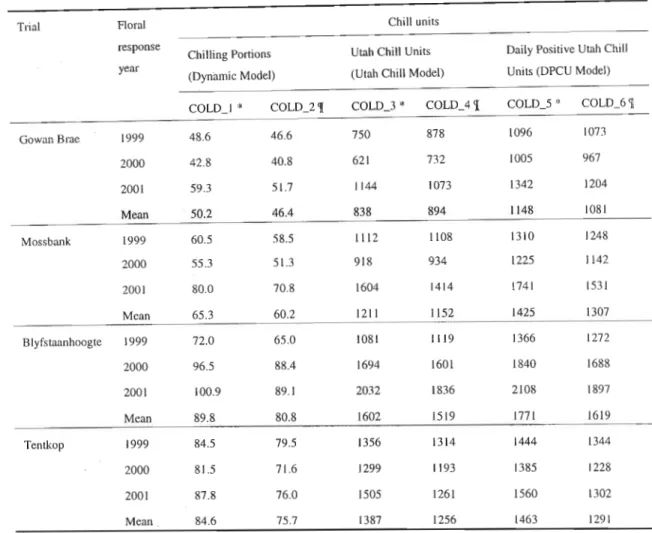
In the initial evaluation of the data, separate correlation matrices were produced for seedlings and grafts as described in section 3.2.1.1.1. Because the resulting correlation coefficient(s) for the explanatory variables were identical in the case of both propagule types, only the results of the correlation analysis for grafts are presented (Table 3.13). Overall, the difference in performance for the six cool model x cool period combinations was fairly minimal.
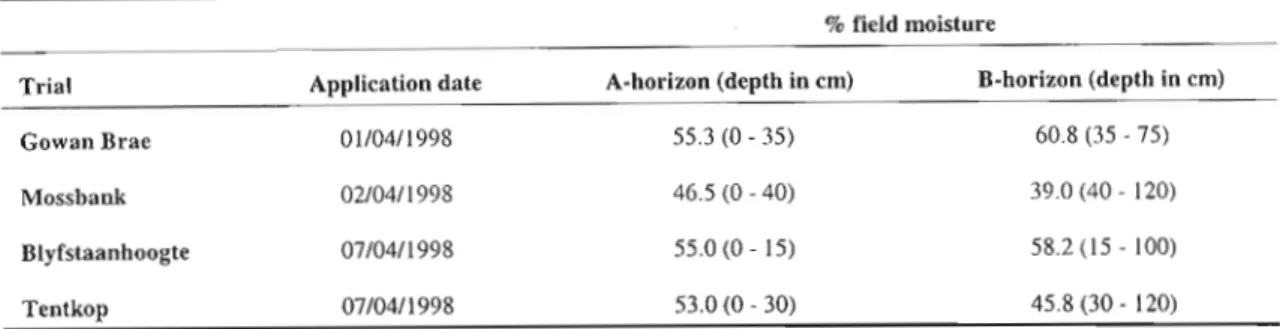
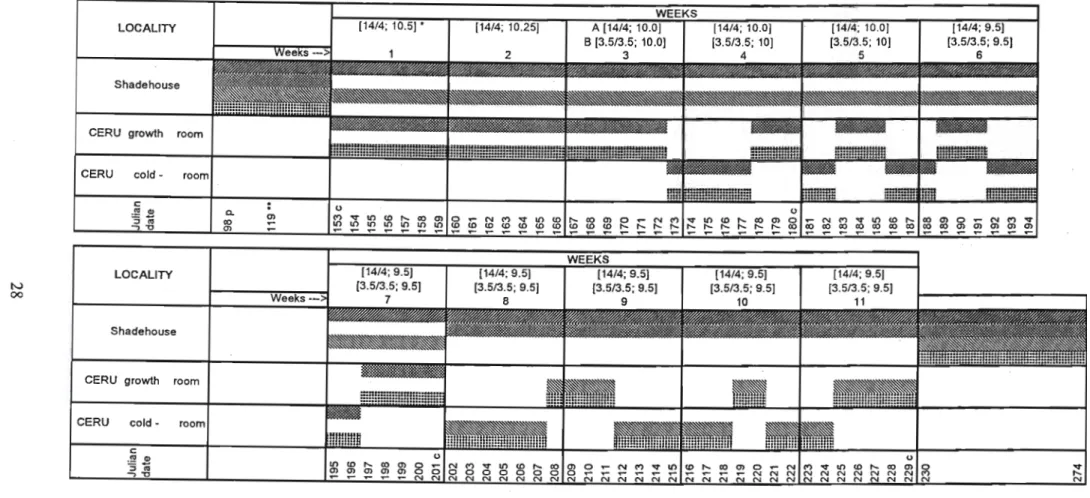
Winter cold accumulation in the shade room (Tt cold treatment) began on 28 April 2000 (Julian day 119) and ended on 21 September (Julian day 264). No symptoms of cold stress were observed in any of the transplants throughout the duration. However, the foliage of seedlings in the maximum cold treatment (T3) developed symptoms of cold stress (slight purple of the leaf lamina and necrosis of the leaf edges) from the beginning of the ninth week of the controlled condition phase.
EFFECT OF TEMPERATURE AND PACLOBUTRAZOL ON PHOTOSYNTHETIC EFFICIENCY IN E. NITENS
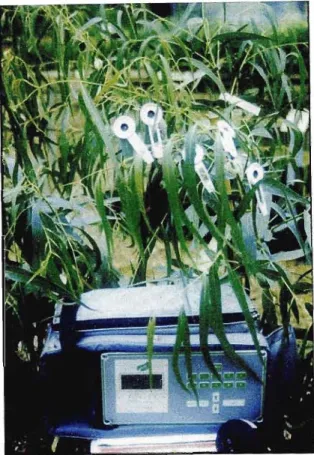
Under non-impaired conditions, about 80 to 90% of the absorbed light energy from excited chlorophyll a (Chl*) will be dissipated by photosynthetic quantum conversion, while de-excitation by heat emission (about 5 to 15%) and the red + far-red chlorophyll fluorescence (0.5 to 2%) is much lower. One of the most commonly used fluorescence parameters used in plant stress studies is the ratio Fy. Briefly, Fy/Fmratio is a quantitative measure of the photochemical efficiency of photosystem of PSII (Demmig and Bjorkman 1987).
The timings of the PEA measurements performed in pot Experiments I and 2 are indicated in Figures 2.1 and 2.3, respectively. Each data point (FvIFm reading) in the analyzes was obtained by averaging the two FvIFm readings from the two leaves on each plant. In all cases, the cause of mortality appears to be incompatibility between the rootstock and the topstock.
In Experiment 1, FyIFmd did not fall below 0.80 for any of the treatments at any time of. In Experiment 2, on August 16 (Julian day 229), the day before the maximum cold treatment (T3, 59 CPs, 1366 Cold Hours) (Table 3.19) ended (Figure 2.3), the photosynthetic efficiency of plants in the latter treatment (F )Fmratio 0.7681) was significantly lower than that of plants in all other cold treatments (Table 4.2). Nevertheless, this F)Fm figure showed that the cold applied in the T3 treatment was not severe enough to cause photoinhibition. Analysis of the chlorophyll fluorescence data as a stress indicator from Experiment 1 (Table 4.1) suggests that this is not the case.
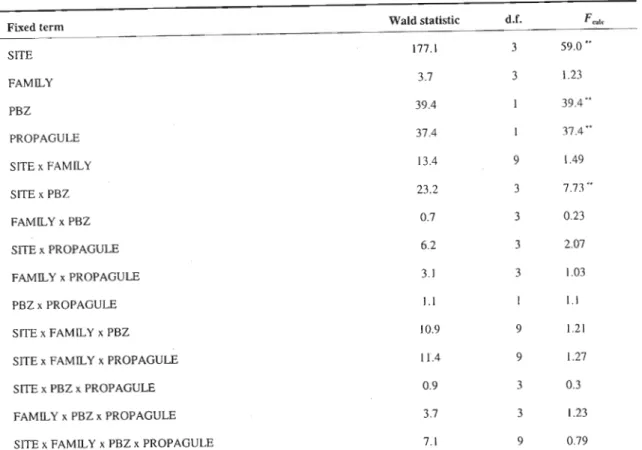
This is supported by the non-significant effect of the interaction between cold treatment and propagule (genotype) on the Fy/Fmratio (Table 4.2).
CHAPTERS
EFFECT OF DROUGHT STRESS ON FLORAL BUD PRODUCTION IN E. NITENS
Introduction
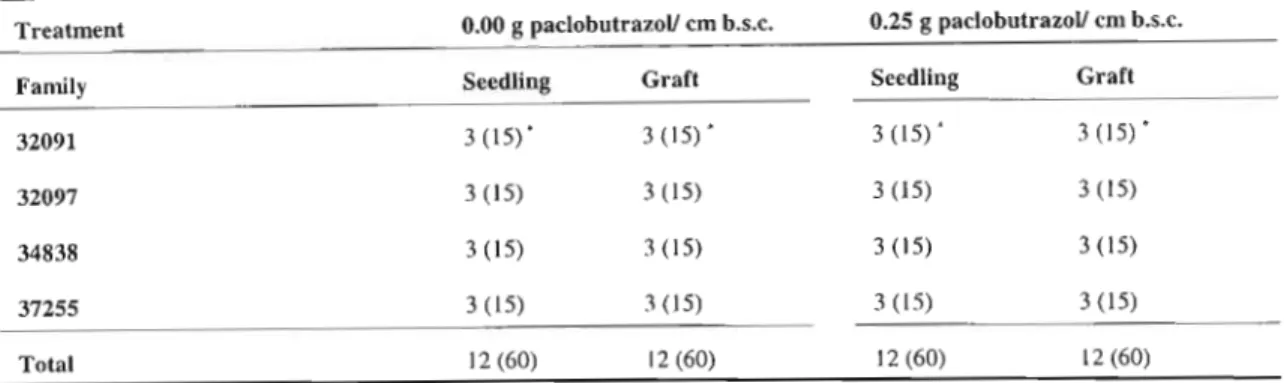
Of the years of rainfall data used, a highly reliable daily rainfall data set was only available for the year 2000. As mentioned earlier, seedlings and grafts of the same treatment number were at most 50% related. PROPAGULE was included as an explanatory variable to investigate the effect of plant type on the results of the regressions.
The main aim was to investigate the degree of correlation between the different explanatory variables. The summarized results of the string of multiple linear regressions performed for percent trees producing screens (%_trees) in the seedlings are shown in Table 5.5. Although a total of 72.8% of the variance was accounted for by the explanatory variables DRY_2000, COLD_4 and PBZ, post hoc tests showed that COLD_4 and PBZ treatment were highly significant (p<0.001), but winter drought (DRY_2000) was non-significant ( Table 5.5).
The summarized results of the string of regressions performed for the percentage of trees producing screens (%_trees) in the grafts are shown in Table 5.6. The summarized results of the multiple linear regressions performed for screen crop per tree (seedlings and grafts combined) (LFLW_200 I) is presented in Table 5.7. Regression of screen crop per tree (LFLW_2001) on winter drought severity (DRY_2000), propagule type. PROPAGULE) and pac1obutrazol application (PBZ) was highly significant (p<0.001) but only accounted for 38% of the total variance. Table 5.6 Summary of the analysis of variance performed for the stepwise multiple linear regression on percent grafts that produced screenshots at five years (%_trees).
Table 5.7 Summary of the analysis of variance performed for the stepwise multiple linear regression on the transformed umbel score five years after planting.
GENERAL DISCUSSION AND CONCLUSIONS
Some - or all - of the juvenile characteristics of the seedling rootstock imposed an inability to flower on the grafted tree. In 2001, less than 3/4 of the grafted trees produced umbels, possibly indicating that the chilling amount of 89.1 CP did not fully meet the chilling requirements of E. Although some of the grafts in Experiment I produced umbels after the higher treatments high winter chills, the low total number of plants in trials (due to space limitations), and the number of plants that flowered prevented any meaningful regression analysis between units of winter chill and floral response being undertaken.
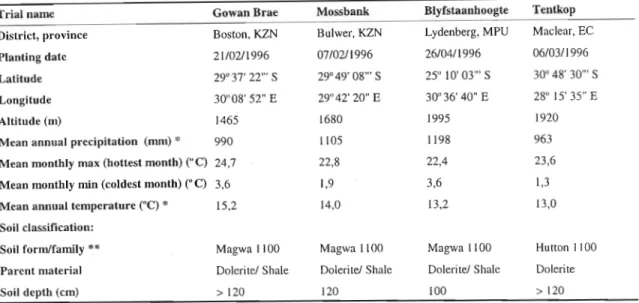
Other essential growth requirements of the species such as adequate available soil moisture, nutrition and soil drainage must also be met. Location of production plantations in a winter rainfall region: High cold areas in the southern Western Cape can provide the degree of winter chilling required for E. Although as much as 72% of the variation in flower bud production of mature grafts was explained by the accumulated amount of winter chilling and rate of paclobutrazol application , is the fact that the regressions depended on only four unique points with respect to the "COLD_x" variable.
To facilitate such research, prior knowledge of the low temperature requirements for floral induction in certain clones would be required. The results of the study suggest a similarity between temperature regimes that promote cold unit accumulation and completion of dormancy in deciduous fruit trees, and temperatures that promote floral induction in E.flitefls. Optimal accumulation of cold in olives occurs at temperatures that fluctuate in a diurnal sine wave pattern from a minimum of 20ºC to a maximum of 15ºC on either side of the cardinal temperature (12.5ºC) (Hartmann and Opitz 1980).
As previously discussed in Chapter 5, research into the relationship between drought and flower bud production in E.
LITERATURE REFERENCES
Photon yield of O2 evolution and characteristics of chlorophyll fluorescence at 77 K among vascular plants of different origins. Trials of cold-hardy eucalypt species in the summer rainfall region of South Africa: results at six years of age. Comparison of the effect of excess light on chlorophyll1 (77K) fluorescence and photon yield of O2 evolution in higher plant leaves.
1987a. The temperature dependence of dormancy breaking in plants: mathematical analysis of a two-step model with a cooperative transition. 1987b. The temperature dependence of dormancy breaking in plants: computer simulation of processes studied under controlled temperatures. Strong, independent, quantitative genetic control of the timing of vegetative phase change and first flowering in Eucalyptus globulus ssp.
Modifying dormancy termination prediction models for improved accuracy in South African stone fruit orchards. Five-year results of a trial series of Eucalyptus grandis from clonal interaction in the summer rainfed areas of South Africa. Variation in soil moisture availability in South African plantations: preliminary results of parameter sensitivity tests of model WETNES.
Comparative early growth of Eucalyptus species of the subgenera Monocalyptus and Symphyomyrtus in intensively managed plantations in southern Tasmania.
APPENDICES
Appendix3.1 Regression of Hobo pole minimum daily air temperature (PoleMinT) (y) on Stevenson's display of minimum daily air temperature (ScrnMinT) (x).