All work presented in this dissertation is my own, unless otherwise noted in the text. The reactor, the "Gasifier", operates at temperatures below the melting limits of inorganic salts (750°C) in the spent liquor.
CONCLUSIONS
RECOMMENDATIONS
APPENDIXB
APPENDIXC
APPENDIXD
APPENDIXE
APPENDIXF
APPENDIXG
APPENDIXH
T=500°C 104 Figure 6-20: General trend of the product gas compositions of SASAQ liquid 105 Figure 6-21: Effect of temperature on the composition of my product gas 106 Figure 6-22: The effect of time on the profile of the product gas composition.
NOMENCLATURE
CHAPTER!
INTRODUCTION
IN1'RODUCTION
Determine the factors influencing the theoretical water-gas shift reaction versus those experimentally observed with respect to the process variables. Finally, comments were made regarding the water-gas shift reaction from theory and from experimental work done based on the process variables.
LITERATURE SURVEY
Background
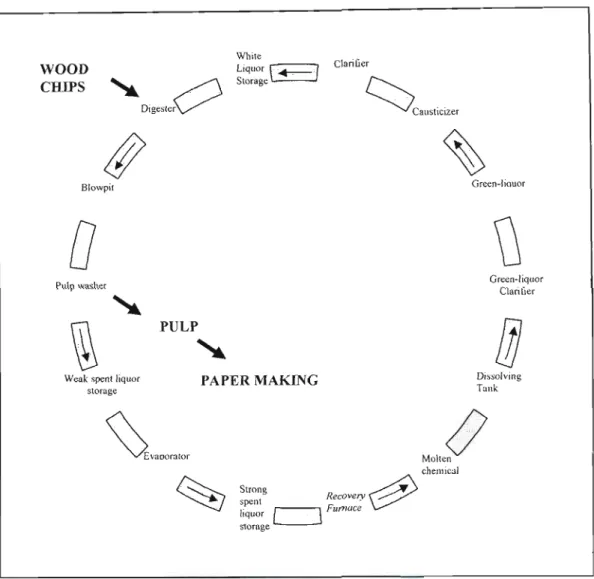
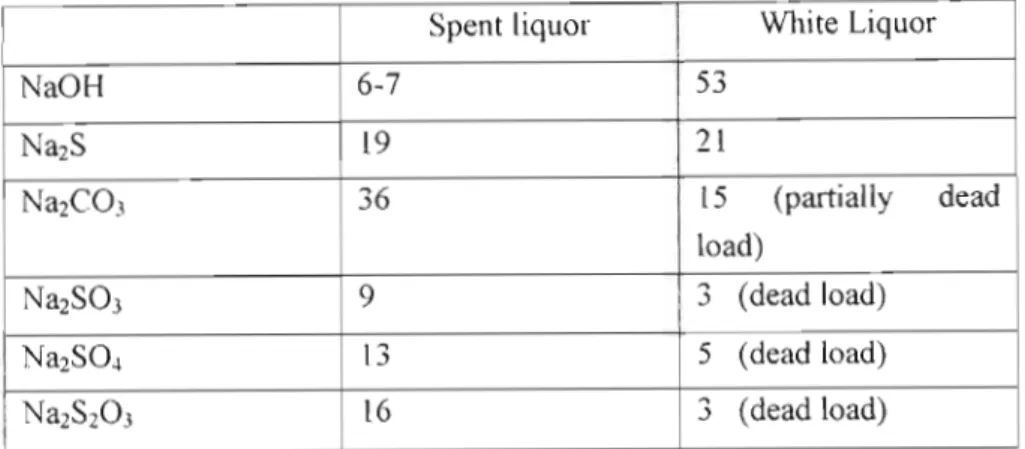
It is the only standard industrial pulping process where pulping chemicals can be recovered and reused in the pulping process. Here, wood chips are cooked at high temperatures and pressures in a solution of pulping chemicals consisting of sodium hydroxide and sodium sulfide to release the wood fibers (Macek, 1999). The organic acids present in the chemical matrix of the wood are neutralized and the lignin is dissolved in an aqueous solution called "white liquor". perhaps referred to as pulping fluid or cooking fluid) used in the pulping process (Marklund, 2002).
I,ITERATURE SURVEY
- Spent liquor
- Current Technology
- Liquid Injection
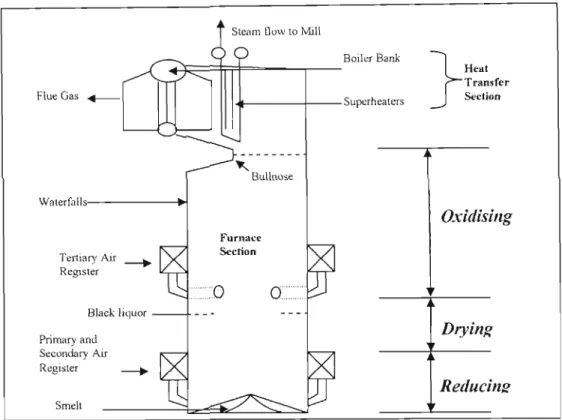
- a The Recovery Boiler
As mentioned in the previous section, pulping chemistry refers to the chemical composition of the aqueous pulp liquor solution used to pulp the feedstock in the pulping stage of the depennization process. Recovery boiler technology has been the dominant design used in the Kraft process for many decades.
LITERAT!JRE SURVEY
- ITERATURE SURYEY
- Rotary Kiln Incinerators and Fixed Hearth Incinerators
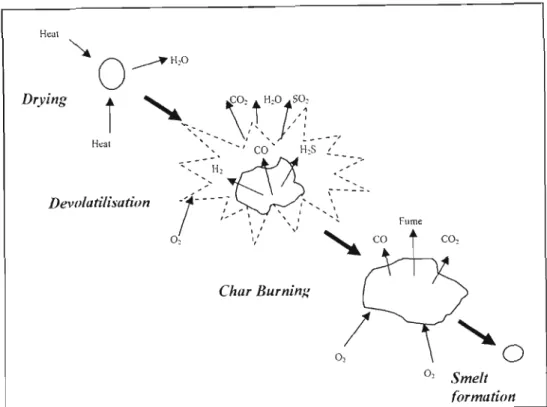
- Fundamentals of Spent Liquor Conversion in a Recovery Boiler .1 Introduction
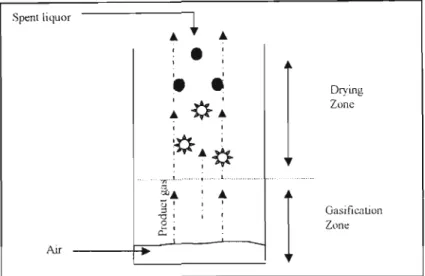
The water present in this concentrated liquor evaporates with the formation of carbon dioxide and water vapor" from the oxidation of organic matter in the liquor. The remaining inorganics in the form of sodium sulfate and sodium carbonate are deposited on the bed particles.
UTERATURE SURVEY
From the literature reviewed, it can be seen that the general concept of spent liquid combustion is the same. When the spent liquid is dispersed into the regeneration boiler, it is exposed to hot gases.
IJTERATURE SURVEY
- Concerns with Chemical Recovery Boilers
- ITERATIJRE SURVEY
Sodium sulfate is also formed, but is undesirable from a chemical recycling point of view as it leads to increased dead load in the chemical recycling system. A process which converts carbonaceous materials by a process involving partial oxidation of the feedstock in a reducing atmosphere in the presence of steam at temperatures sufficient to convert the feedstock to synthesis gas, to convert inorganic material in the feedstock convert (when the raw material is a solid or semi-solid) to a glassy solid known as vitreous fiit or slag, and to convert halogens into the corresponding acid halides.
I,ITERATIJRE SURVEY
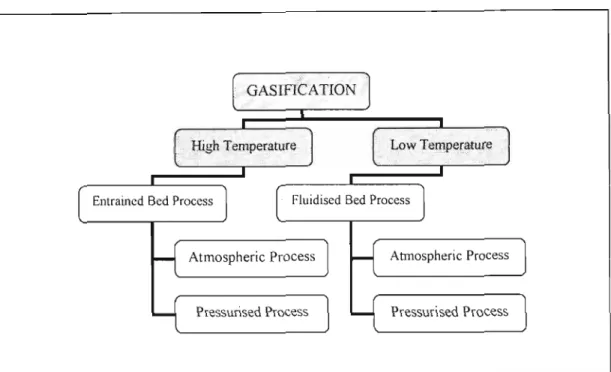
Low temperature gasifiers operate at temperatures below the melting point of the inorganic metal salts. Because the application of fluidized bed technology requires working under my conditions, the melting point of the feed is an important factor.
LITERATURE SURVEY
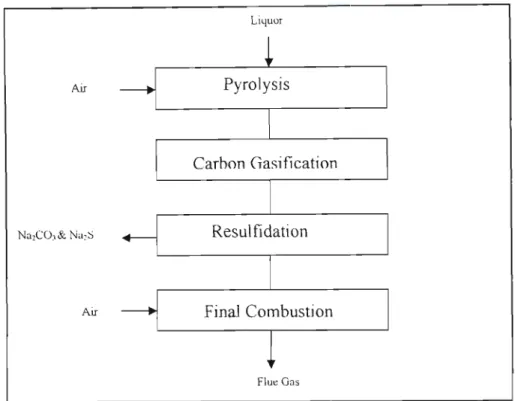
- Spent Liquor Gasification .1 Introduction
1990b) investigated sodium emission during pyrolysis and carbon gasification of beverages consumed by the same method. One of the most important kinetic studies of the gasification of consumed beverages was carried out by Li et al.
UTERJITURE SURVEY
- Tar Formation
- Results
- Babcock and WilcockProcess
- Kvaerner Pulping Process
- Description
- Results
- The NSP Project
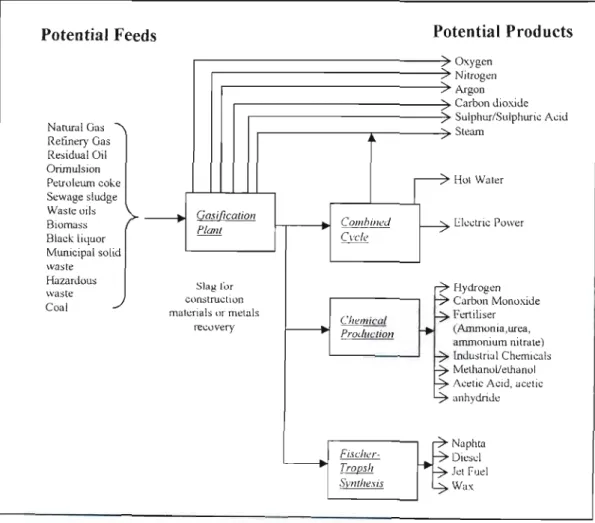
- Biomass Gasification
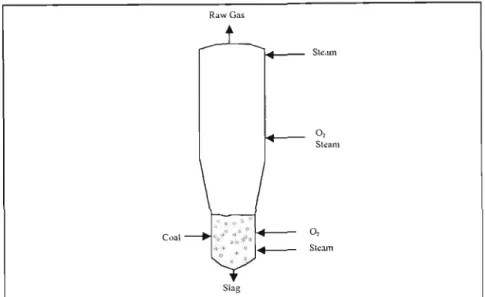
- Partial Oxidation Gasifiers
- Integrated Gasification Combined Cycle (IGCC) Power Generation
- Significance ofthis work
- Characterisation and the quantification of tars
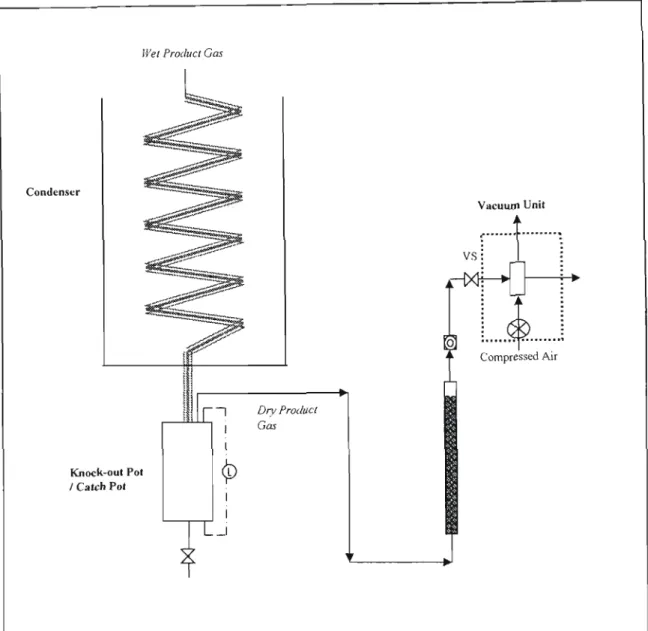
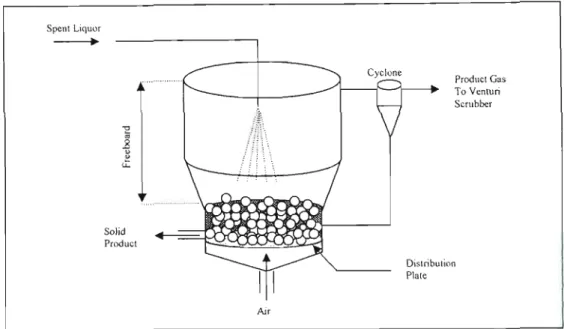
In the steam reformer system, part of the product gas is burned in the pulsating heat resonance tubes, which provide superheat to the fluidizing steam and to gasification reactions. A wet venturi scrubber is used to remove fme particles that escaped the cyclones and condense hydrocarbons present in the product gas.
CONCEPTS AND THEORY
Minimum Fluidisation Velocity from Pressure Drop versus Velocity Curves
The minimum fluidization velocity is determined from the pressure drop versus velocity curves as follows. Richardson (1971) states that much information can be provided on bed structure. In Figure 3-2, the minimum fluidization velocity is obtained by taking the surface velocity at the highest pressure drop reading, ie.
From Figure 3-3, the minimum fluidization velocity is obtained by constructing the lines OA and BC and reading the value of the surface velocity at the intersection of these lines (Richardson, 1971 and Kunii et al., 1991).
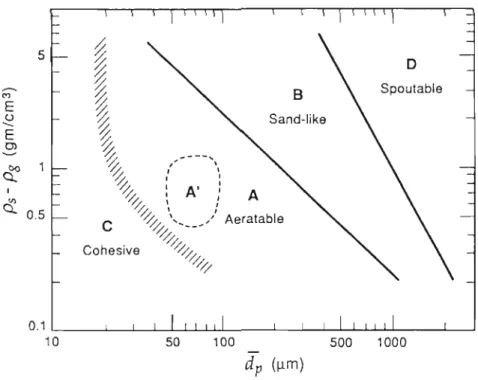
Geldarts Classification Chart for Particles
These diagrams provide a rough indication of the quality of fluidization, especially when visual observations are not possible (Kunii et al, 1991).
CONCEPTS AND THEORY
- Disadvantages
- Determination of Minimum Fluidisation Velocity .1 Experimental Determination
- Calculation
- Le Chatelier's Principle
- Effects of Temperature
- Effects of Catalysts
- Effects of Pressure
- Effects of Concentration
The term porosity or bed void fraction (£) is used to describe this expansion with the smallest void (£Ill!) achieved at minimum fluidization. You can determine the void in the same way, but you need to measure the height of the bed. An increase in pressure will shift the equilibrium position in a direction that favors the formation of fewer moles of gas particles and vice versa.
An increase in concentration will shift the equilibrium position away from the increase and vice versa.
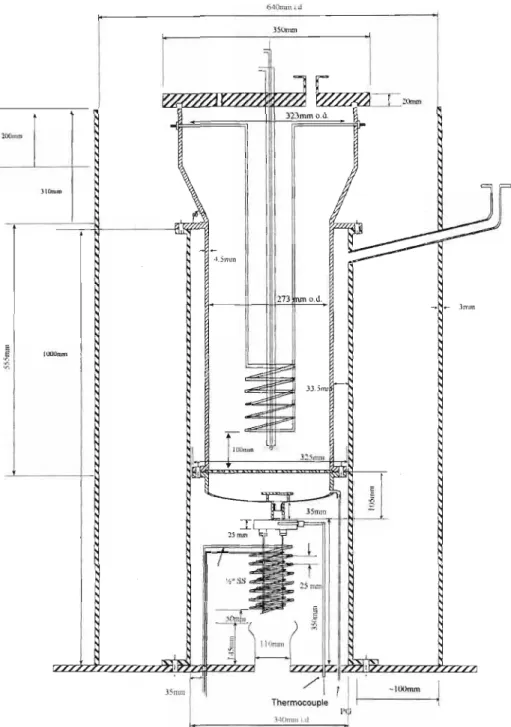
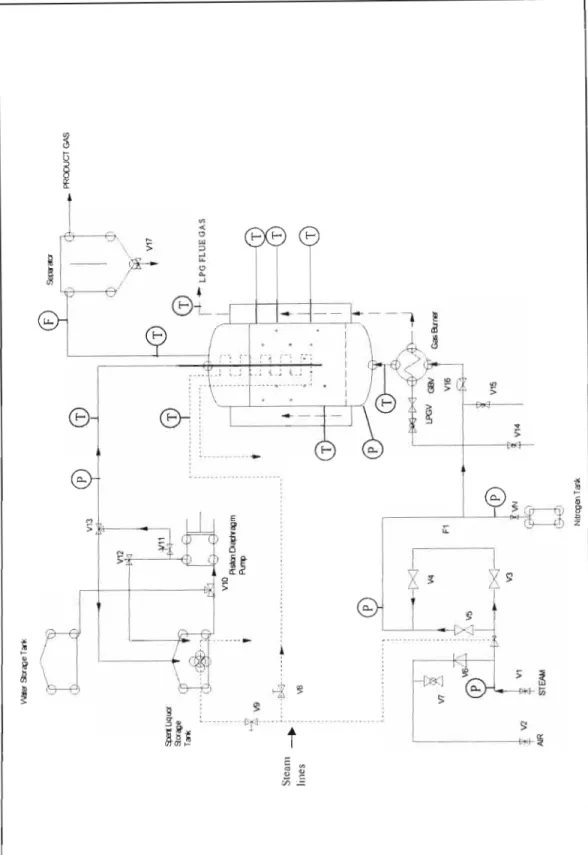
EQUIPMENT DESCRIPTION
- Introduction
- Brief Process Flowsbeet Description
- EQUIPMENT DESCRIPTION
- The Fluidised Bed Reactor Configuration
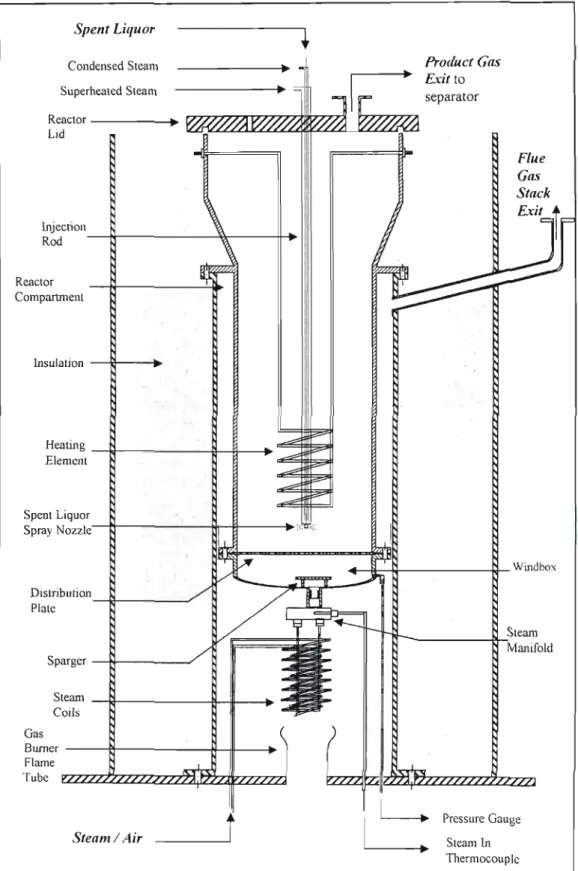
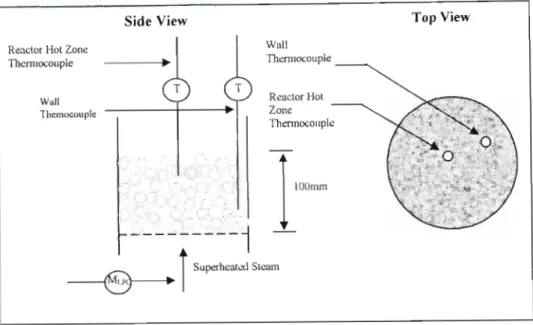
- Temperature Control of the Gasification System 1 The Gasifier
- Maintenance of the Gasifier
- Illustrations
- EQUIPMENT I2ESCRIPTION
The feed system consists of the spent liquor storage tank, the hot water storage tank and the injection rod. A needle valve in the heating coil line is used to control the degree of heating of the consumed beverages. It was connected to the gasifier product gas stack and calibrated with superheated steam.
The temperature probes or thermocouples inside the reactor were crucial to the operation of the gasifier.
ANALYTICAL METHODS
Introduction
Spent liquor tlowrate
- Silica Analysis of Bed material
- Drager Tubes
The XRF is then calibrated to precise standards for the chemical species in the bed material samples. The concern here was that this could affect the concentration of the dry product gas. The color change depends on the concentration of the component to be analyzed.
To achieve sufficient separation of the different components of the injected sample, the following valid settings were implemented.
RESULTS AND DISCUSSION
General Aspects of Gasifier Operation .1 Pilot-scale Considerations
- Familiarisation
- Bed Material
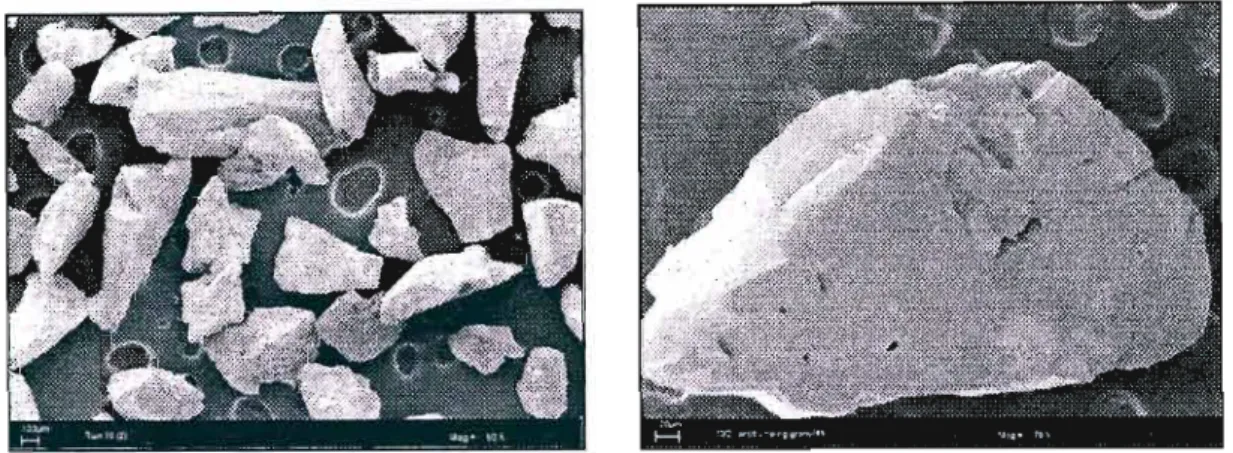
The presence of non-process elements such as chlorides and potassium in the spent lye, which are reported to lower the melting point eutectic of the inorganic salts. As a result, partial or complete melting of the soaked carbonate particles occurred, with subsequent coalescence of the individual particles. The composition of the material will not be part of the mass balance closure on the system.
Although aluminum oxide glitter had many advantages over sodiwTI carbonate, it was speculated at the start of the project that it would not be coated.
Fluidisation Characteristics .1 Bed Behaviour during Cold Tests
However, the minimum bed velocity is higher than the expected minimum fluidization velocity. From the pressure drop versus velocity plot, the minimum fluidization velocity for both the alumina grain and sodium carbonate particles (Figure 6-1) is 0.28 m/s and 0.54 rnJs, respectively. Since it is not possible to determine the minimum fluidization rate of the gasifier, an appropriate equation (Equations 3-7 and 3-8) was used.
From experimental values, it is evident that the minimum fluidization rate of sodium carbonate is comparable to its predicted value.
RESUIXS AND DISCUSSION
Although this information is necessary, a fluctuation of the pressure drop across the bed is sufficient to indicate fluidization. This enables us to determine the temperature distribution in the bed and in the freeboard region (region above the bed). The idea behind it was that the laser had to reflect metal balls in the bed and the intensity of the reflected light was measured.
When testing the modified plate in a cold model, it was clear that the bed was uniformly fluidized.
RESUI/TS AND DISCUSSION
- Spent Liquor Coating
- Approach for Experiments
They believed that the subsequent defluidization was due to the agglomerates settling on the distributor. It appeared that the resulting agglomeration problems may lie in the poor interaction between the solids in the bed. Therefore, the presence of sodium must be from the coating of the liquid used.
It seemed as if the coating formed a permanent bond with the surface of the gravel.
RESULTS AND DISCUSSION
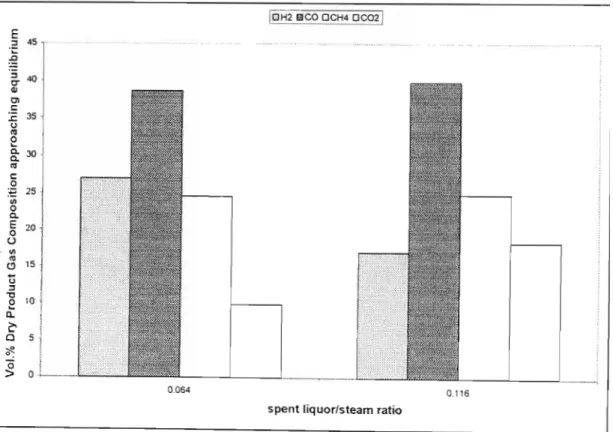
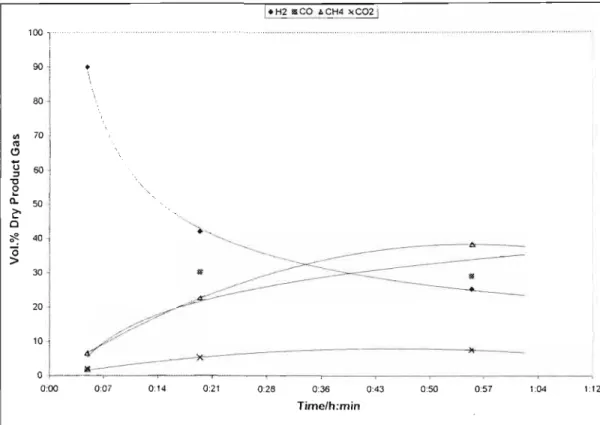
- The Effect of the Silent Liquor to Steam Ratio
From the figures below, it appears that an increase in the water content of the feed has a significant effect on the product gas composition. A similar trend in the product gas composition profiles is observed for the SASAQ gasification experiments. Therefore, the effect of additional water in the feed had a significant effect on the product gas distribution and equilibrium in the system.
The results reported in the following tables are presented as percentages of fluid feed consumed.
RESUI,TS AND DISCUSSION
- Tar Formation
The effect on the composition profiles of the dry product gas and the morphology of the coating was examined. Also due to time constraints, verification of the results in this part of the experimental work was not possible and is recommended for future work. These structures can be described as dendritic in shape and it is clear that they are well distributed over the surface of the gold.
Upon closer examination of the condensed samples, small droplets of oil were visible on the surface.
CONCLUSIONS
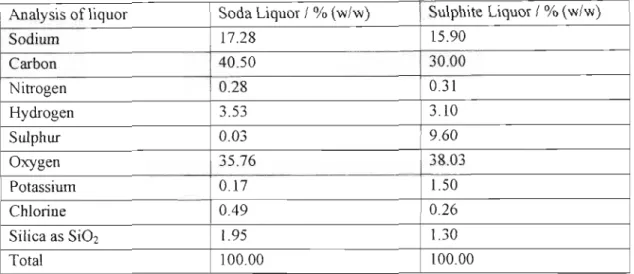
Hydrogen sulfide is also present, but was only detected in the gasification of spent SASAQ fluid. Hydrogen sulfide was not detected in the gasification of spent soda due to the low sulfur content (0.03%). CWorides were found to deposit in the layers at the lowest concentrations reported for SASAQ spent fluid (40.32%).
High concentrations of potassium were found in the bed for spent soda gasification with very low concentrations for spent SASAQ gasification.
RECOMMENDATIONS AND FUTURE WORK
RECOMMENDATIONS
Verification of the effect of alkali metal salts as catalysts should be done by conducting a laboratory scale kinetic study. The use of aninelt gas, such as nitrogen (tracer gas method), to more accurately measure the flow rate of the product gas stream from the gasifier should be implemented. In addition, higher temperatures for higher L:S ratios and the use of higher solids fluids should be explored.
The use of ICP (inductively coupled plasma) emission spectroscopy for chloride analysis should be investigated.
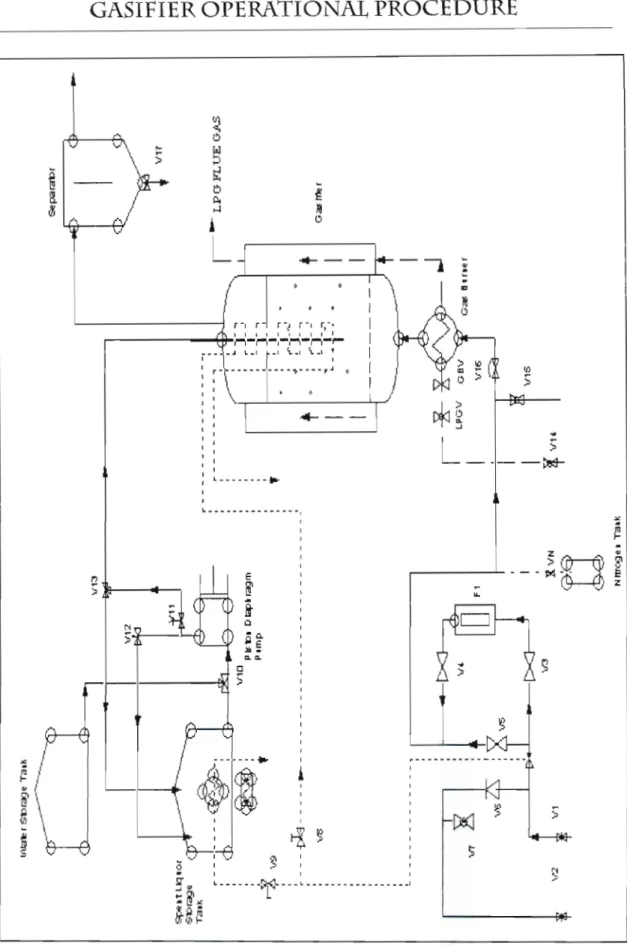
- Water storage tank
- Gasifier
- Air Startup
- Spent liquor injection
- Shutdown
- Maintenance
Feasibility study: gasification of black liquor and use of the products in combined cycle cogeneration, Tappi Journal, Vol. 1985); Gasification of black liquor and use of the product gas in combined cycle cogeneration - phase 2, Tappi Journal, Vo\. 1981); Kohl A.L (1986); Black Liquor Gasification, Canadian Journal of Chemical Engineering, Vo\. 1991); Fluidization Engineering, 211d edition, Stoneham, MA, Butterworth-Heinemann Series in Chemical Engineering. Gasification of black liquor coal and steam at elevated pressure, Joumal of Pulp and Paper Science, Vol. 1984), Reactive intermediate in the alkali carbonate-catalyzed gasification of coal, Fuel, Vol. 1999);.
Sulfur distribution during air gasification of kraft black liquor solids in a jluidized bed of Ti02 particles, Pulp and Paper Canada, Vol.
EQUILIBRIUM CALCULATIONS
GEANKOPLIS,1993)
SPENT SASAQ LIQUOR (RED LIQUOR)
- PRODUCT IDENTIFICATION NAME OF CHEMICAL
- PRODUCT INFORMATION TYPE
- PHYSICAL DATA PHYSICAL STATE
- STORAGE CONDITIONS
- ECOLOGICAL AND TOXICOLOGICAL DATA No infonnation
- HAZARDS AND RISKS PHYSICAL HAZARDS
- EMERGENCY ACTION FOR FIRES AND SPILLS FIRE FIGHTING
- PERSONAL PROTECTIVE EQUIPMENT PROTECTIVE EQUIPMENT
- ADDITIONAL COMMENTS
- PRODUCT IDENTIFICATION
- PRODUCT INFORMATION
- PHYSICAL DATA
- ECOLOGICAL AND TOXICOLOGICAL DATA ACUTE EFFECTS
- FIRST AID PROCEDURES SPLASHES IN THE EYES
- PRODUCT AND COMPANY IDENTIFICATION
- HAZARDS IDENTIFICATION
- ACCIDENTAL RELEASE MEASURES
- HANDLING AND STORAGE
- EXPOSURE CONTROLIPERSONAL PROTECTJON
- PHYSICAL AND CHEMICAL PROPERTIES
- STABILITY AND REACTIVITY
- TOXICOLOGICAL INFORMATION
Skin contact with the liquid phase of LPG can result in frostbite. In case of frostbite from contact with the liquid phase, place the frostbitten part in raw water, about 40-42°C. Unconscious persons should be removed to an uncontaminated area and given mouth-to-mouth resuscitation and supplemental oxygen. with liquid phase) Ingestion.
Do not allow cylinders to slip or come into contact with sharp edges, they must be handled with care.