CONTENT OF ACACIA MEARNSII ACROSS FOUR AGES AND THREE SITES IN THE KWAZULU-NATAL MIDLANDS
STEVEN B. DOVEY
January 2005
CONTENT OF ACACIA MEARNSII ACROSS FOUR AGES AND THREE SITES IN THE KWAZULU-NATAL MIDLANDS
by
STEVEN B. DOVEY
Submitted in fulfilment of the academic requirements for the degree of
Master of Science
in the
School of Life and Enviromnental Sciences University ofKwaZulu-Natal
Durban
January 2005
ABSTRACT
Acacia meamsii(black wattle) is one of the few tree crops of which both timber and bark are utilised, with branches sometimes being collected for fuel wood. There is a great potential for nutrient loss from plantations with intense harvesting practices. Allometric relationships were developed to estimate above-ground biomass across four ages and three site qualities ofA. meamsii stands. The three sites were based on high, medium and low site quality classes of productivity. Differences in biomass and the distribution of biomass between the stem, bark, live branches, dead branches and foliage components are described in relation to site and age. Relationships between biomass and light interception and plant area index are investigated and show some merit. Nutrient concentrations were used with the above-ground biomass data to estimate quantities of nutrients held in the various biomass components in each of the stands. Nutrient distributions in the above-ground biomass (AGB) were examined and compared to other studies. Foliar phosphorus (P) and potassium (K) concentrations were shown to be sub optimal, agreeing with results and recommendations of South African fertilisation stupies. Some concentration differences were observed between site and age classes for certain nutrients, although these differences may have been due to seasonal effects.
Biomass and nutrient quantities were adjusted to yield a wood production of 100 t ha01 and compared with adjusted calculations for similar studies on other plantation crops. Total nutrients contained in the AGB of the adjusted calculations were 540.8 kg ha01 nitrogen (N), 20.4 kg ha-I P, 200.6 kg ha01K, 241 kg ha-I calcium (Ca), 55.7 kg ha-I magnesium (Mg), with a half to two thirds of the nutrients held in the stem and bark alone. Nutrients losses vary with harvesting intensity as bark and branches may be harvested with the stem wood. Levels of nutrient removal with harvesting intensity are discussed with reference to estimated losses and gains from natural processes and management practices. An incomplete nutrient budget calculation indicated that P, K, Ca and Mg might potentially be removed in quantities greater than replaced by natural processes under stem and bark harvesting. The budget calculations lack processes such as leaching and N-fixation. It is highly probable that these processes, once quantified, may yield more negative budget results, especially for the base cations K, Ca and Mg.
Keywords: above-ground biomass, Acacia meamsii, allometry, biomass, black wattle, LAI, leaf area index, nutrient budget, nutrient concentrations, PAl, plant area index, sustainability
DEDICATION
To my wife and children for glvmg...
Every way of a man is right in his own eyes, but the LORD weighs the hearts.
Proverbs 21:2
PREFACE
DECLARATIO
The experimental work described in this dissertation was carried out (under the superVlSlOn of Professor Nonnan Panunenter) of the School of Life and Environmental Sciences, University of KwaZulu- atal, with the assistance of Institute for Commercial Forestry Research (ICFR) from January 2003 to December 2004.
These studies represent original work by the author and have not otherwise been submitted in any form for any degree or diploma to any tertiary institution. Where use has been made of the work of others it is duly acknowledged in the text.
TABLE OF CONTENTS
ABSTRACT PREFACE
TABLE OF CONTENTS . LIST OF TABLES
LIST OF FIGURES
ACKNOWLEDGEMENTS '
LIST OF ABBREVlATlO S
CHAPTER 1: GENERAL INTRODUCTION 1.1 General introduction
1.2 The Structure ofthe Thesis 1.3 Literature Review
1.3.1 Introduction
1.3.2 A brief review ofAcacia mearnsii Growth in South Africa
Establ ishment Uses of black wattle
South African black wattle research 1.3.3 Allometry and biomass
1.3.4 Forest resources
1.3.5 Leaf area index and light interception 1.3.6 Process-based growth models
1.3.7 Nutrients held in the biomass
1.3.8 Estimating the plantation biomass and nutrients The sample area
Sample tree selection Scaling up to the stand level
1.3.9 Allometry and biomass of plantations Age, site and silvicultural effects Fertility effects
Growth manipulation through management practices 1.3.10 Nutrient concentrations and distributions in plantations
ii
iv v viii x xi xii
1 1 2 2 2 3 3 3 3 4 4 5 5
6
7 8 8 9 9 10 10 10 11 11
Concentrations of nutrients Nutrient distribution
1.3.11 Sustainability in forestry management Soil fertility
1.3.12 Nutrient budgeting
Additions of nutrients to the system Losses of nutrients from the system
1.3.13 Past biomass and nutrient studies on A. mearnsii Findings from past studies
1.3.14 Conclusion 1.4 Aim and Objectives
CHAPTER 2: MATERlALS AND METHODS 2.1 Sampling Methods
2.1.1 Site Selection
2.1.2 Compartment selection and sample plot selection 2.1.3 Site and stand information
2.1.4 Sample tree selection and measurement of the standing crop 2.2 Destructive harvesting and sample analysis
2.2.1 Measurement of sapwood area 2.2.2 Optical plant area index measurement 2.2.3 Nutrient determination
2.3 ANALYSIS OF OATA
2.3.1 Analysis of general tree and stand growth 2.3.2 Ratios between tree component masses
2.3.3 Allometric equations for estimation of stand attributes 2.3.4 Comparing sites and ages
2.3.5 Plant area index, leaf area index and biomass
11
12 13 13 15 15 16 17 19 23 23
25 25 25 25 27 28 29 30 30 31 32 32 32 33 33 34
CHAPTER 3: ALLOMETRY AND BIOMASS RESULTS AND DISCUSSION 35 3.1 Growth and yield
3.2 General growth of the sample stands
3.3 Distribution of biomass between tree components
35 36 37
3.4 Canopy and foliar dynamics
3.5 Models to predict masses of individual tree components 3.6 Plot masses of tree components
3.7 Comparison of optical and destructive estimates of leaf area index 3.8 Intercepted radiation and growth
3.9 Predictions of tree attributes with PAl
CHAPTER 4: NUTRIENT DISTRIBUTIONS AND POOLS RESULTS AND DISCUSSION
4.1 Nutrient concentrations
4.2 Concentrations of nutrients in various tree components 4.3 Concentrations of nutrients in relation to site and age class 4.4 Concentration as an efficiency indicator
4.5 Factors that may have influenced concentrations 4.6 Nutrient distribution in the above-ground biomass 4.7 Harvesting practices and nutrient removal
4.8 Simple nutrient budgets
CHAPTER 5: CONCLUSIONS AND RECOMMENDATIONS
REFERENCES
APPENDICES
43 46 48 51 53 56
58 58 60 61 63 63 64 67 68
72
76
87 Appendix A: Sample tree data for each site and for all ages 87 Appendix B: Mean concentrations of nutrients in tree components 90 Appendix C: Regression results for prediction of component masses or areas 93 Appendix D: Regression results for prediction of stand level attributes from
plant area index 99
Appendix E: Nutrient mass data for allA.mearnsii ages, sites and elements 102 Appendix F: Mean contents of nutrients in tree components 104
LIST OF TABLES
Table I: Biomass of above-ground components ofA. mearnsii (t ha-I) at different ages and locations.
20 Table 2: Nutrient contents of the above-ground biomass ofA. mearnsii (kg ha-I) at different ages and
locations. 21
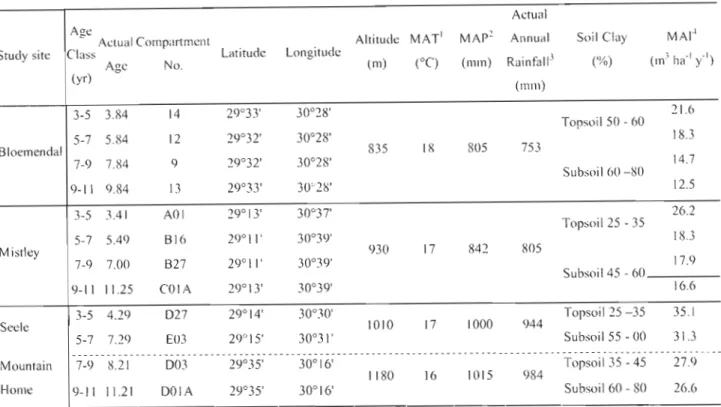
Table 3: utrient removals for wood, bark and branches (kg ha-I) inA. mearnsii stands. 22 Table 4: General site characteristics for Bloemendal, Mistley, Seele and Mountain Home. 27
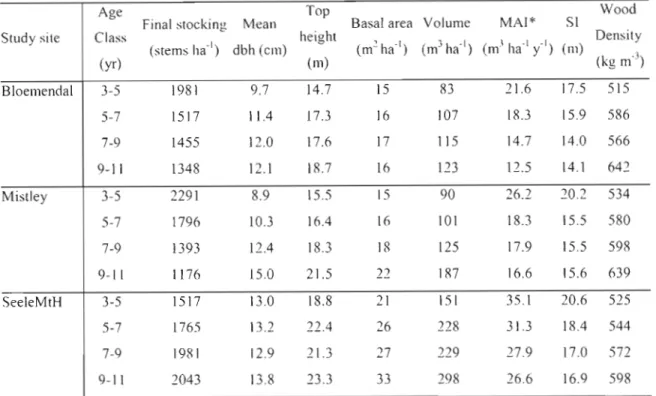
Table 5: General mensuration characteristics for each stand. 36
Table 6: Correlations between individual tree dimensions and component masses with levels of
significance. 38
Table 7: Mean percentage (%)contribution of each component to total AGB across all ages and all sites. 39
Table 8: Mean bark: stem ratios as well as the ratio of Ws to mean component masses across all
ages and sites. 40
Table 9: Percent contributions of tree components to AGB in other similar studies. 42 Table 10: individual leaf area, unit leaf mass and specific leaf area related to site, age and canopy
layer. (Means for site and age are shown on the right of each section and on the bottom for
canopylaye0. 43
Table 11: Number of leaves (Millions ha-I) for each age group at each site. 45 Table 12: Allometric models to predict masses or areas of individual biomass components, with the r~
of each regression used to generate them. 46
Table 13: Final masses and measures of tree components for each plot. 48
Table 14: Mean tree component masses for site and age class. 49
Table 15: Regression predicting leaf area index from LAI-2000 plant area index. 52 Table 16: onlinear regression predicting extinction coefficient from leaf area index and fraction of
light below the tree canopy. 54
Table 17: Annual PAR, iPAR, and AGB production per unit light energy for three sites 111 the
KwaZulu- atal Midlands. 55
Table 18: Equations to predict stand dimensions from plant area index. 57 Table 19: Foliar nutrient concentrations and ratios ofA. mearnsii as a mean of all ages and sites in contrast to "adequate" values cited in literature. 59 Table 20: Nutrient concentrations in each tree component across all ages and sites. 60 Table 21: Nutrients with significantly di fferent concentrations between sites. 62 Table 22: Nutrients with significantly different concentrations between age classes. 62
Table 23: Distribution of above-ground macronutrients for stands of A. mearnsii, E. grandis and Pinus potu/a, equalised to 100 t ha-I of utilisable stem mass. 66 Table 24: Average nutrient masses (kg ha-I) for 7 to 11 year old stand components of A. mearnsii. 68 Table 25: Simple representation of an annual nutrient input-output budget for the 7 to 1I-year old stands showing areas of limited knowledge and data needs. 70
Table AI: Sample tree data for all ages at Bloemendal.
Table A2: Sample tree data for all ages at Mistley.
Table A3: Sample tree data for all ages at SeeleMtH.
Table Bl: Concentrations of nutrients in foliage and bark for all sites and ages.
Table B2: Concentrations of nutrients in live and dead branches for all sites and ages.
Table B3: Concentrations of nutrients in stem wood for all sites and ages.
87 88 89
90 91 92
Table Cl: Regression predicting woody biomass as In(Ws) from In(dbh). 93 Table C2: Multiple linear regression predicting stem biomass as In(stem biomass) from In(dbh)+
In(height). 93
TableC3:Multiple linear regression predicting bark biomass In(Bark Biomass) from In(dbh) + age. 94 Table C4: Multiple linear regression predicting live branch biomass as In(live branch biomass) from
In(dbh)+In(stocking). 94
Table C5: Multiple linear regression predicting dead branch biomass as In(dead branch biomass) from
In(dbh)+stocking + In(age). 95
Table C6: Multiple linear regression predicting AGB as In(AGB) from In(dbh) +age. 95 TableC7: Multiple linear regression predicting sapwood area as In(Sapwood) from In(dbh)+ In(age).
96 Table C8: Regression predicting foliar biomass as In(leaf biomass) from In(sapwood area). 96
Table C9: Regression predicting leaf area from sapwood area. 97
Table CIO: Regression predicting foliar biomass as In(leafbiomass) fi'om In(dbh)+ In(age). 97 Table Cll: Regression predicting leaf area as In(\eaf area) from In(dbh)+ In(age). 98
Table D I: Regression predicting Basal area from plant area index and age. 99 Table D2: Regression predicting stand volume from plant area index and age. 99 Table D3: Regression predicting above-ground biomass from plant area index and age. 100 Table D4: Regression predicting stem biomass from plant area index and age. 100 Table D5: Regression predicting bark biomass fi'om plant area index and age.
to
ITable El: Masses of nutrients contained in the AGB for all sites and ages. 102 Table E 2: Distribution(%)of above-ground macronutrients for all sampled stands ofA. mearnsii. 103
Table Fl: Nutrients contained in foliage and bark for all sites and ages.
Table F2: Nutrients contained in live and dead branches for all sites and ages.
Table F3: Nutrients contained in stem and total AGB for all sites and ages.
LIST OF FIGURES
104 105 106
Figure 3.1: Foliage biomass and leaf number in the upper, middle and lower canopy positions as a
percentage of the canopy total. 45
Figure 3.2 Observed LAl vs. LAI-2000-predicted PAl. 52
Figure 3.3 LAI plotted against non-intercepted light fraction. 54 Figure 3.4 The relationship between AGB production and intercepted radiation (iPAR) for stands of
ditTerentage. 55
Figure Cl: Observed vs. Predicted Ws 93
FigureC2: Observed vs. Predicted stem biomass 93
FigureC3: Observed vs. Predicted bark biomass 94
FigureC4: Observed vs. Predicted live branch biomass 94
FigureC5: Observed vs. Predicted dead branch biomass 95
FigureC6: Observed vs. Predicted sapwood area 95
FigureC7: Observed vs. Predicted sapwood area 96
FigureC8: Observed vs. Predicted leafbiomass 96
FigureC9: Observed vs. Predicted leaf area 97
Figure Cl 0: Observed vs. Predicted leaf biomass 97
Figure C 11: Observed vs. Predicted leaf area 98
Figure DI: Observed vs. PAl predicted basal area 99
Figure D2: Observed vs. PAl predicted volume 99
Figure D3: Observed vs. PAl predicted AGB 100
Fib'UreD4: Observed vs. PAl predicted stem biomass 100
Figure D5: Observed vs. PAl predicted bark biomass 1O 1
ACKNOWLEDGEMENTS
The author would like to thank:
Norman Pammenter for his inspiling input through the course of this study. Ben du Toit for his motivating input and ideas that made a major contribution to this work, also for believing in me enough to afford myself this opportunity. Colin Smith for the initial assistance in the initial stages of this project. Selam Ghebremicael for her assistance and cooperation with the fieldwork, lab work, data capturing and sharing of information. Ben du Toit, Colin Smith, Janine Campion, Luke Esprey and Rob Dunlop for their meticulous review and comments in the major chapters of this manuscript. My wife, Keigwyn and children, Timothy and Rebecca. My Lord and Saviour, Jesus Christ, for His grace and guidance. The South African Wattle Growers Union (SAWGU) and Mondi Forests allowing this study to be conducted on their forest plantations and for the use of their digital maps. The Institute of Commercial Forestry Research for the use of their facilities and resources, providing finance and time to complete this work.
LIST OF ABBREVIATIONS
(3PG) Physiological Principles in Predicting Growth (AGB) Above-Ground Biomass
(AN OVA) Analysis Of Variance (BA) Basal Area
(Bk) Branch bark fraction (dbh) Diameter at breast height (GPP) Gross primary production (h) Tree height
(iPAR) intercepted Plant Available Radiation (k) Light extinction coefficient
(LA!) Leaf Area Index
(MAI) mean annual increment (MAP) Mean Annual Precipitation (MAT) Mean Annual Temperature
(NDVl) Normalized Difference Vegetation Index (NPP) Net primary production
(PAI) Plant Area Index
(PAR) Plant Available Radiation (PCA) Plant Canopy Analyser
(SAWGU) South African Wattle Growers Union (SeeleMtH) Seele and Mountain Home
(SI) Site Index
(SLA) Specific Leaf Area
(V) Individual tree utilisable volume
(Vol) Volume of all utilisable timber per hectare (VPD) Vapour Pressure Deficit
(Ws) Sum of stem, branch and bark mass (WUE) Water use efficiency
(WUEr) Rainfall water use efficiency as stem mass production per unit rainfall (t ha- I m-I)
CHAPTER 1: GENERAL INTRODUCTION
1.1 General introduction
Acacia mearnsii (black wattle) (ShelTy, 1971) is harvested for both its timber and bark with branches sometimes being collected for fuel wood. Estimating the quantities of these products and the nutlients held in them is of great value. Allometric relationships are used to predict these complex tree attributes from easily measured attributes such as diameter at breast height or tree height (Medhurst et al., 1999). Allometry and biomass infonnation have many uses other than predicting forest resources, such as the parameterisation of process based growth models and forest water use models. Biomass information in conjunction with remote measurements (satellite or solar radiation) may also be used to generate and test altemate methods of biomass estimation. Nutrient removal can be estimated as the product of nutrient concentration and the estimated biomass of the harvested stand components.
Nutrient removal during harvesting or utilisation of harvesting residue is an important consideration in a sustainable forest management regime. Various levels of harvesting intensities (stem-only, stem and bark, branch harvesting) can be used to assess the impact of different harvesting regimes in relation to potential nutrient supply on nutrient pool sizes of a particular site (Rangeret al.. 1995; Moller, 2000). The nutrient pools include the forest biomass, the forest floor (litter and harvest residues) and the soil pool. The most appropriate way to calculate the approximate nutrient loss from a system is to draw up an input-output budget. In most intensively managed agricultural/forestry systems, a net loss of nutrients takes place, which is strongly affected by the management regime. Exceptions occur where symbiotic nitrogen-fixation or atmospheric deposition contributes large quantities of nutrient inputs. If a net loss occurs, the loss needs to be quantified and augmented by fertilisation, nitrogen-fixation or addition of residues to ensure sustained productivity. Forestry management regimes need to consider the effect of current practices on future growth and productivity, the environment and economical viability, and to replace nutrient losses appropriately.
Allometric relationships predicting biomass and associated nutrient contents are considered important tools in estimating the supply of forest products to consumers and the effects of harvesting practices on nutritional sustainability. Limited allometry, biomass, nutrition and sustainability work in black wattle has resulted in little understanding of these issues in South African black wattle forestry. Allometric equations generated over a broad plantation age and site range will help understand changes in these relationships and tree attributes as affected by
site factors. Remote measurements need to be tested to ascertain their predictive ability 10 relation to plantation biomass or any stand attribute at a larger scale.
1.2 The Structure of the Thesis
The first chapter of this thesis introduces the reasons for undertaking this study by looking at allometry, biomass and nutritional aspects ofA. mearnsii. This helps in understanding why it is necessary to quantify the allometry and biomass ofA. mearnsii at a stand-level. It also explains why it is necessary to assess nutrient contents and develop estimates of nutrient losses through various harvesting practices. Chapter two describes the methodology used in this study, the sampling, lab analysis and data analysis, including a description of the study areas. Chapter three presents and discusses results of the allometry and biomass determinations with alternative light-based estimates of stand attributes. Chapter four presents and discusses nutrient concentrations and distributions found in this study, where harvesting practices and nutrient removal, with a simple nutrient budgeting, are used to assist in the interpretation of the results.
Chapter five deals with conclusions and recommendations from this study.
1.3 Literature Review 1.3.1 Introduction
Literature on allometry, biomass and nutritional sustainability of plantation-grown A. mearnsii is reviewed, particularly considering the effects of site quality, soil fertility, soil water availability, rotation age and stand density. Methods for developing allometric relationships and estimating plantation biomass are described in this review. Growth and physical characteristics of A. mearnsii are reviewed with reference to past research. Methods for estimation of plantation biomass and nutrient contents are outlined in this chapter. The effects of site quality and management in terms of fertility, soil water availability, rotation age and stand density are discussed. Nutritional sustainability, the loss of nutrient capital or soil fe11ility with various harvesting intensities is described with reference to losses and gains from natural processes and management practices. Past studies are referred to with some results presented from limited black wattle work showing the disttibution of biomass and nutrients between various tree components. This chapter ends with the aims and objectives of this study, with some key questions that are relevant to the study.
1.3.2 A brief review ofAcacia meamsii
A. mearnsii is a leguminous tree native to Australia, initially used as structural timber for fences or houses. A. mearnsii is also referred to as A. mollissima Que!. (non Willd) and A. deeurrens var. mollis Lindl. It grows in many areas of Australia ranging from the wanner southern Queensland, to the cooler Tasmania up to elevations of 1100 m. The species was introduced into Africa in the early 20lh century and is now widely distributed both naturally and in plantations.
This tree is an efficient nitrogen-fixer and good source of green manure, yielding up to 200 kg ha-I y(1 of fixed nitrogen (Sherry, 1971), and may be used to restore and regenerate soils low in nitrogen and organic carbon. Black wattle can tolerate steep slopes with shallow soils and grows well on poor acidic soils. Itcan also be used effectively in preventing soil erosion on susceptible sites (Dunlop and MacLennan, 2002).
Growth in South Africa
InSouth African commercial plantations, black wattle is grown as a drought-resistant hardwood on sites with a mean annual precipitation (MAP) of 750 to 850 mm and a mean annual temperature range (MAT) of 16QC to 20QC (Sherry, 1971; Smith et al., 2002). This crop is conunercially grown along the eastern escarpment between altitudes of 400 m and 1200 m in the cool mist belt region of South Africa, stretching from south eastern Mpu111ulanga through northern KwaZulu-Natal, and the KwaZulu-Natal midlands into southern KwaZulu-Natal (Herbert, 1993).
Establishment
Black wattle can be established uSlllg seedling transplants, direct seeding or vegetative propagation. Plantations are commercially established at 2400 trees per hectare and thinned over two successive operations to 2000 then 1500 trees when the trees are 4 m and 7 111 tall, respectively (Smith and Dunlop, 2002). Trees grow rapidly, generally reaching a height of 20 m and have blackish coloured bark and feathery foliage. Height growth has been reported to reach over 10 m in three years at 2000 ma.s.l. in Kenya with a mean annual temperature range of 13 QC to 17 QC (Schonau, 1972). This tree crop is moderately frost-tolerant and exhibits vigorous growth at high elevations (above 1000 ma.s.l.) in India and East Africa.
Uses of black wattle
Originally grown as a source of tannin, black wattle is now also used for pulpwood for the production of paper, fuel wood, rayon or hardboard, poles, props, green manure and windbreaks. In South Africa the area under wattle is 132 000 ha producing approximately 1.6
million tonnes of timber, 2.0 million tonnes of fibre and 186 000 tonnes of wet (50% moisture content) bark per annum. A fraction of the timber is used in the manufacture of charcoal, and most is used for pulp production (Dunlop and MacLennan, 2002; Edwards, 2000). The wood has a calorific value (dry) of 19259 kJ kg-) and ash content of about 1.5%. The timber has a high density in relation to other tree crops (approximately 600 kg m-") and yields a high-quality charcoal (Sherry, 1971; Duke, 1981; Dunlop and Hagedorn, 1998). A Zimbabwean study found thatA. mearnsii produced 323 kg of pulp per cubic m of wood compared with 224 kg per cubic m for Eucalyptus grandis (Muneri, 1997). The ability to produce a higher pulp yield may result in this species being grown more extensively in the future.
South African black wattle research
South African research efforts have been at the forefront of black wattle research for many years, and have been undertaken with comprehensive empirical understanding, but often not exploring the physiological processes underlying the observed responses. Past studies focussed on issues such as tree improvement, fertilisation, vegetation management, silviculture, disease and pests, talmin extraction, timber qualities and soil hydrological impacts. The tree improvement work has concentrated on bark and tannin yields, but now focuses on fibre quantity and quality with a limited understanding of other tree processes such as tree dry mass partitioning and site sustainability (Dunlop and MacLennan, 2002). Little allometry and biomass distribution work has been done on black wattle and even less is known with regards to nutrient contents of the various biomass components.
1.3.3 Allometry and biomass
Relationships between stem, bark, branch and leaf components can be described with allometric relationships. As allometric relationships are empirical, describing the relative growth of a plant paIi in relation to the growth of another plant part (Medhurst et aI., 1999), a single attribute of a tree component may be lIsed to predict biomass or attributes of other tree components. Such relationships may be compared spatially, temporally and between different species, from which simple or complex relationships for predicting the allocation or partitioning of growth resources between the plant parts may be developed. Allocation is defined by Bartelink: (1998) as the dynamic apportionment of assimilates among plant parts. Some authors use the terms allocation and partitioning interchangeably. Distribution describes a static tree or stand state in tenns of the dry biomass of tree components and the relative mass relationships between them. Biomass accumulation and allocation patterns in stands are affected by species, stocking, rotation length and variations in thinning operations (Van Laar, 1982). Site location, soil water, nutrient
availability and silvicultural practices may also have an effect on carbon allocation (Naidu et al., 1998). The distribution of biomass between the tree components changes with age as the storage and structural organs become larger. Leaf biomass, relative to total biomass, for example, decreases with age, contributing the largest propOliion of the total biomass in a young stand, and the lowest contribution in older stands (Cromer et al., 1985).
1.3.4 Forest resources
The increased pressure on forest resources over the past few decades has resulted in an increased use of plantation forestry to meet demands for renewable energy (charcoal), pulpwood fibre, sawlogs, mining timber and poles. Merchandisable bole wood (debarked wood within a specified size range), branches, bark, and sometimes the leaves, are used commercially or by communities living in and around the plantations. Obtaining estimates of the mass or dimensional attributes of these tree components at the stand level is essential in estimating the quantity of resources in forest plantations, and adding to the understanding of plantation growth.
The rate and volume of carbon dioxide absorption and storage in forest products is very impoliant in estimating the extent to which trees are countering the global greenhouse effect (Thompson and Matthews, 1989).
Over the past few decades the focus on biomass estimation in forest stands, and variables controlling the allocation, partitioning and distribution of carbon to various tree and forest components has increased (van Laar, 1982; Snowdon, 1985; Pan-esol, 1999; Moller, 2000;).
Biomass predictions, estimates of plantation yield and residue loads are essential in assisting management decisions with respect to site productivity estimations and the effect of harvesting practices on the sustainability of a site. The prediction of plantation residue loads after harvesting is a useful output of biomass estimations, as it can be added to estimates of plantation fuel loads in order to determine the risk of fire after harvesting (Catchpole and Wheeler, 1992), or to model fire behaviour under controlled buming conditions. The ability of a plantation to support the firewood fuel needs of the surrounding local population may be estimated if the quantity of branches and non-utilisable trees remaining on a site after harvest is known (Alien et aI., 1988; Chavangi et al., 1992).
1.3.5 Leaf area index and light interception
Forest biomass growth may be linearly related to intercepted plant available radiation (PAR), and light interception by forest canopies is largely dependent on leaf area index (LAI), defined
as the single-sided leaf area per unit ground area (Pierce and Rutming, 1988; Gower and orrnan, 1991; Deblonde et aL., 1994). Linder (1985) shows how above-ground biomass (AGB) production is related to intercepted PAR (iPAR) by demonstrating how an increase in leaf area results in an increase in light interception and a subsequent increase in growth. Leaf area is directly related to net primary production (NPP) and an increase in LAl can therefore be directly translated into increased yield (Cromer et al., 1993). Leaf area index, an important component of forest growth process-based models, is used to calculate net primary production, rainfall interception, transpiration and ecosystem processes such as CO2 flux and dry deposition (Chason et aI., 1991; McMurtrie et al., 1994; Battaglia et aL., 1998). Leaf area index may be used as an integrated measure of site, soil and climatic factors, allowing for the detection of spatial and temporal changes in forest ecosystems as attributed to soil fertility, water balance and long-tenn stress (Battaglia et al., 1998; Waring and Running, 1998; Nackaerts et aL., 2000).
Leaf area index alone may also be used to assess differences between experimental treatments, the impact of site distw-bance, drought effects and disease and pest defoliation (ChetTy et al., 1998; Waring et al., 1998).
Biomass sampling may also be used for the purpose of testing, i.e. "ground-truthing" and calibrating indirect or remotely sensed measures of plantation structure. The measurement of plant area index using an optical gap-fraction based instrument, such as the LICOR LAI-2000, may be calibrated with data collected from such a study (Cherry et al., 1998). Remote sensing via satellite imagery or low flying aircraft can be used to gather data that may be correlated with some measw-e of forest biomass or LAl. A relationship between the remotely gathered spatial imagery and the biomass of a forest stand component may be used to make further spatial predictions of other biomass components.
1.3.6 Process-based growth models
Models may be developed from empirically-derived allometric relationships to predict physiological processes and ultimately tree growth. These models may be used to estimate timber growth, above-ground primary production, tree architecture, carbon cycling and total standing biomass (Bond-Lamberty et al., 2002). The models, for example, simulate biological processes that determine the growth of a forest as affected by climatic and edaphic factors. They are primarily used to predict the effects of environmental and management effects on forest growth (Cromer et al., 1995). Levels of efticiency in terms of growth output per unit of water, nutrients, tight and management costs may be estimated and compared across sites. Studying the effects of site quality, rotation age, stocking and silvicultural practices may be useful in
developing an understanding of the influence these factors have on growth and biomass distribution.
Parameters required for these process-based models may be estimated with the data and information from simple biomass studies. A process based model such as 3-PG (Physiological Principles in Predicting Growth), can be parameterised using empirical relationships from biomass estimation studies and long-term measurements in forest plantations (Landsberg and Waring, 1997). This model calculates gross primary production (GPP) from absorbed utilisable iPAR and canopy quantum efficiency (Landsberg and Waring, 1997). Dimensionless modifiers, reflecting the envirorunental constraints determining stomatal closure and stand age, are used to reduce absorbed PAR. et primary production is estimated from a constant ratio of NPP to GPP and is allocated as carbon to various plant pa11s by using allometric ratios. Rainfall interception, transpiration, water use and many other forest growth parameters are also calculated by the model (McMUI1rie et aI., 1994; Battaglia et al., 1998;). A simple validation of the 3-PG model was done for A. mearnsii in South Africa for three sites (Dicks, 2001).
Predictions by the model in this study were adequate, although needed improvement by the inclusion of more sites and age groups, as many of the parameters were either set intuitively or to a default value.
1.3.7 utrients held in the biomass
Estimations of yield of all the utilisable components and the impact on their removal of nutrients from the areas where they are grown, is very important in managing issues around site sustainability. In order to assess the nutrients removed from a site, the total AGB has to be estimated with the nutrient concentrations for each tree component. The mass of timber, bark and branches may be predicted using allometric relationships, and their nutrient contents summed for each harvested tree product. Once the nutlient removals have been estimated, the impact on the site can be assessed in tenns of the supply potential of the site, in addition to considering any additional inputs such as atmospheric deposition and N-fixation, where necessary. The supply potential involves the fluxes of available nutrients within and between various nutrient pools and the additions and losses of nutrients to the forest system. The cycling, release and immobilisation of nutrients between and within these pools are termed the nutrient fluxes. The magnitude of these fluxes results in temporally divided pools of nutrients that constitute availability (or lack thereof) to the trees over the short to long term. Nutrient removals by harvesting must be considered in relation to forest system losses and gains of nutrients by other processes. Simple nutrient budgets or balances may be constructed that
compare the inputs and removals from the forest system over a rotation period. A negative budget will imply a net loss of nutrients from the system and give an indication of the risk of nutrient depletion and growth decline if expressed in relation to the system supply potential (du Toit and Scholes, 2002). The system supply potential involves the rate at which nutrients become available to the trees through natural processes, such as weathering and atmospheric deposition. However, a nutrient will become limiting only if the forest system becomes incapable of supplying the nutrient demand. The supply potential of a forest system depends on the sizes of the nutrient pools, the availability of the nutrients in the pools, and the rate at which the nutrients become available. The magnitude of the depletion and a knowledge of the quantity of nutrients stored in the soil can be used to ultimately indicate risk of nutrient depletion and growth decline (du Toit and Scholes, 2002).
1.3.8 Estimating the plantation biomass and nutrients
In order to estimate stand biomass and associated nutrient concentrations or contents, an adequate sampling procedure needs to be selected. The basic steps of the entire procedure are the selection of a sample area and sample trees, the destructive harvesting and weighing of the sample tree masses and the individual components thereof, fom1ulation of relationships between tree components, and the scaling up from the single tree level to the stand level. Sampling involves the destructive and orderly removal of individually selected trees for measuring purposes. The procedure for selecting sample trees and the number of trees selected is dependent on the final objectives, financial costs involved in the exercise, as well as available time. Depending on the proposed outcome of the sampling exercise, various components may be measured, weighed, dried, reweighed and analysed. The wet mass of the tree components that are too large to oven dry are converted to dry mass by recording the in-field wet mass of the component, and then taking a sub-sample which is oven dried to determine the wet: dry mass ratio. This ratio is used to convert the in-field wet mass to a dry mass. Nutrient analyses may also be conducted on sub-samples of the tree components to detennine nutrient concentrations ( ewbould, 1967).
The sample area
Harvesting an entire sample area of a stand will produce the most accurate estimates of the population, provided that the area is representative of the population and the conversions from wet mass to dry mass are done correctly (Hitchcock and McDonnell, 1995). As this is often not practical, being costly and time consuming, smaller sample sets have to be taken, involving the selection of single sample trees.
Sample tree selection
The trees that are sampled need to be selected to represent the entire stand. Sample tree selection often begins with the measurement of tree diameter at breast height (dbh) and tree heights (h) over a set sampling area. Data collected from this sampling area are used to conveli the individual sample tree attributes to an attribute value per unit area. A distribution of the dbh, height or a function such as dbll x h is then generated from these data. The distribution may be split into size classes with sample trees selected from each size class.
Trees may be selected randomly from each class or at the centre point of each class. Choosing the number of sample trees is a compromise between the cost of sampling, time taken for sampling and data processing, and obtaining lowest possible sampling en"or. A stratified selection may be used in some cases where more trees are taken from the classes representing the largest pOliion of trees and less from the classes with the lowest number of trees from the sample population. The number of trees assigned to each class is dependent on the range of the distribution and the type of distribution found. Large trees may necessitate the use of sub- sampling, involving taking representative samples from the sample trees (Newbould, 1967).
Scaling up to the stand level
Converting fresh mass to dry mass, individual tree sampling w'lits to the stand attribute and total biomass to utilisable biomass is the next step in achieving the set objectives. Allometric relationships used for these conversions usually need to be developed for each sampling event as they may not be applicable between different ages or sites. Once allometric relationships have been established, estimations of the biomasses of the plantation components can be done.
Scaling up entails applying derived allometric equations to all trees in a sample stand to produce stand level attributes (Cromer and Williams, 1982). Six methods have been listed by Art and Marks (1971) to convert sample tree attributes with field data to a whole stand attribute. The technique used is dependent on the proposed outcome, although regression methods are the most widely used. Regression techniques that describe the allometric relationships between the simple dimensional measures of the sample trees and their weight or areas may be generated. In order to obtain good statistically sound relationships, it may be necessary to transforn1 the dependent and independent variables (Snowdon, 1992).
A ratio method is an alternative method where the ratios between various tree components are used to predict the mass of a component on other trees, i.e. the ratio between basal area (BA)
and stem mass of a sample tree is used with the BA of other trees to predict their stem mass (AJi and Marks, 1971). Total BA of the stand is multiplied by these ratios to achieve stand level mass values of the biomass component (Cromer and Williams, 1982). In each case, final results of the biomass estimation are expressed per unit area, e.g. dry mass in tons per hectare. The ratio method may be used to convert nutrient concentrations in sample trees to whole stand nutrient contents.
1.3.9 Allometry and biomass of plantations Age,site and silvicultural effects
Total biomass generally increases with improved silviculture, site quality and stand age. The general distribution of tree component masses in plantations can be summarised as 55-65%
bole, 15-25% crown (leaves and branches) and 17-23% roots with moisture contents of around 50% of the fresh mass (Hitchcock and McDonnell, 1995). Site quality, stocking and silvicultural treatment have been attributed to differences in the distribution of biomass between the stem, branches and leaves. As stocking increases, final total biomass increases up to a maximum level. In Pinus radiata (Birk, 1992) decreased stocking has been found to increase the proportion of biomass in branches, while improved site quality and silviculture increased the proportion of foliage biomass. A similar decrease in branch biomass at higher planting densities was found in a P. radfata study (Madgwick et aI., 1977). This study showed an increase in branch weight with age and an increase in foliage biomass with stocking. Bradstock (1981) and Judd et al. (1996) found that foliage mass increased to a maximum with age and then declined.
Bark and branches increased in mass with increased age with branch mass stabilising at a maximum level.
Fertility effects
When comparing high and low fertility sites in British Columbia, Compton and Cole (1991) found that the more fertile sites resulted in a greater nutrient accumulation in the trees only as a result of a higher biomass, i.e. there was no significant change in concentration. These authors also showed a resultant growth reduction in the subsequent rotation. They pointed out how poor sites with a low nutrient storage capacity are in greater danger of being depleted as a similar quantity of nutrients were removed from the soil per unit biomass as with fertile sites. High risk of nutrient depletion on these poor sites was mostly due to nutrients being tied up in the biomass and therefore unavailable for plant growth requirements.
Gr'owth manipulation through management practices
itrogen fertiliser treatments in eucalypts and pines have been shown to increase the crown allocation, with an increase in leaf mass related to an increase in production (Schonau and Boden, 1982; Negi and Shanna, 1985; Misra et aI., 1998). Fertiliser application in pines was fow1d to produce less below-ground biomass and more AGB (Misra et aI., 1998; Xu et aI., 2002). Application of fertiliser has also been shown to increase the total AGB in Australian experiments, especially with respect to leaf area. Seedling experiments have shown similar results with the application of fertiliser resulting in an increase in relative leaf mass and a decrease in relative root mass, thereby increasing the photosynthetic capacity of the plant (Cromeret al., 1993).
Management practices that increase production will often also result in greater nutrient depletion (Ranger and Turpault, 1999; Santanaet al., 2000). Birk (1993) demonstrated that the addition of fertiliser increases nutrient export, as a result of both increased biomass production and higher nutrient concentrations. This author shows how nutrients accumulate in relation to biomass accumulation independent of site fertility. Experiments on a few Eucalyptus species in India by Hunter (2001) demonstrate how nutrient content increased with increased dry weight, but nutrient concentrations decrease with added fertiliser and irrigation. Although Cromer et al.
(1993) found no significant improvement in growth with irrigation, Hunter (2001) showed that an in'igation growth response can result in greater nutrient export due to a greater biomass production. This author goes on to show that irrigation also increases total dry weight with more above-ground allocation of dry mass to stems and canopy branch portions, relative to below- ground components.
These studies show that a manipulation of site resources can result in a change in total biomass and a switch in biomass and nutrient allocation pattems in the tree crop. An increase in plant available resources may result in a biomass increase, with greater allocation to canopy and structural components and less to below-ground components. An increase in harvestable biomass will also result in an increase in the mass of nutrients removed from a site.
1.3.10 Nutrient concentrations and distributions inplantations Concentrations of nutrients
Predicting tree and stand biomass in conjunction with nutrient concentrations is imp0l1ant in deriving estimates of the nutrients held in the living tree biomass pools. Knowing the quantities of nutrient held in the utilisable plantation products is essential in creating estimates of the
quantities of the various nutrients being removed through harvesting practices. A large amount of work has been done on the biomass and nutrient distributions of many commercial tree species (Hitchcock and McDonnell, 1995). The total mass of nutrients contained in the biomass can be calculated by multiplying the concentrations of the nutrients by the total biomass.
Concentrations of particular nutrients in the various plant components are dependent on the component and nutrient in question; each component must therefore be analysed separately.
Concentrations differ in different tree tissues, being generally lowest in the stem wood and highest in the bark and foliage. The general order of concentrations from lowest to highest is usually stem, branches, bark then leaves, with some exceptions for those that accumulate in various plant organs (Tandon et al., 1988). Foliar nutrient concentrations also vary with leaf age and position in the canopy, with the extent of this variation being element specific (Grove et aI., 1996). Eucalyptus ,P, K and Mg are highest in the leaves, while Ca is the highest in the bark (Laclau et al., 2000, Judd et al., 1996). A Eucalyptus clone study in the Congo (Laclau et aI., 2000) showed P, Ca and Mg concentrations to be higher in the live branches than in the stem. A South African E. gram/is study by du Toit (2003) showed N, P, and K to increase in concentration from the stem to the branches, bark and foliage respectively. Calcium and Mg followed the same trend, except that the bark concentrations were higher than the foliar concentrations.
Nutrient concentration may also differ with site quality, season and stand age (Binkley, 1986).
Jorgenson et (11. (1975) showed that maximum nutrient accumulation coincided with canopy closure in Pinus taeda. The nutrient concentration also decreased with age in the stems and branches of Pinus radiata, except for Mn and Ca (Switzer and Nelson, 1972). In a Congo Eucalyptus clone study, a change in concentration of all elements, especially K in the stem wood, occurred with age. All nutrient concentrations tended to decrease in the leaves, except for N. A general increase in P and a decrease in K and Mg were found in the rest of the tree, with N and Ca remaining relatively stable with age (Laclau et al., 2000).
Nutrient distribution
The proportions of each nutrient held in each tree component with respect to the total mass held in the AGB varies between species, with soil supply, and with tree size or age (Jorgenson et aI., 1975; Grove et aI., 1996). This is due to an increase in relative masses of tree components with age. Initially more nutrients are held in the foliage than in any other tree component. As a stand grows, the proportion of stem and bark increases, resulting in a greater proportion of nutrients
being held in these components. In mature trees, the foliage comprises the smallest portion of the AGB (2% - 10%), but contains a large relative portion of both Nand P (20% - 45%), although these values are species dependent (Grove et al.. 1996). The bark, stem and branches are major stores of nutrients, while the foliage is a sink and a major source of nutrients for new growth. A E. grandis study by du Toit (2003) revealed decreasing amounts of N and P in the stem, foliage, branches and bark respectively. Potassium followed the same pattern, but more was held in the branches than in the foliage. Half of the P and a third of the Nand K are held in the stem wood alone. Calcium and Mg had the greatest fractions in the branches, followed by the bark, stem and foliage respectively. These fractional quantities of nutrients held in the various biomass components need to be considered in assessing the removal of nutrients through various harvesting intensities.
1.3.11 Sustainability in forestry management
Sustainable forest management is the economically viable management of forests without having a present or future negative impact on the ecological or social environment (Higman et al.. 2000). In the South African context, five sustainability issues are outlined by Olbrich et al.
(1997), these being water, site fertility, labour, environmental and national and international market forces. True sustainability encompasses a balance between all of these factors together with a detailed understanding and quantification of each factor and how they interact (Nambiar, 1996).
The ecological sustainability of a plantation is related to the maintenance of the site's capacity to supply all of the necessary resources for photosynthesis and growth. Incoming photosynthetically active radiation, atmospheric carbon dioxide, soil water and nutrients are the resources that the trees draw on. Soil water availability to some extent and soil feliility are the only resources that can be manipulated by site management operations (du Toit and Scholes, 2002). The nutrients held in individual tree components and entire plantations have been used to an increasing extent for predicting of the impact of forestry on ecological and economic sustainability (Madgwick et al.. 1977; Santana et al., 2000). High nutrient losses in short rotation, fast-growing plantations raise much concern about long-tenn site productivity and sustainability.
Soilfertility
Many South African forest soils are low in feliility and occur on ancient weathering surfaces in relatively high rainfall areas, especially the sandstone, qUaJizite and acid crystalline rock-
derived soils, with P and K as the key limiting nutrients (Olbrich et al., 1997). Soil fertility as defined by Ranger and Turpault (1999), is the sum of physical, chemical and biological soil factors characterising the capacity for biomass production. Fertility can be separated into two temporal components; the short-term and the medium-to long-term. The short-term, characterised by soil analysis, is related to the present pools of nutrients available to the plants.
Medium-to long-term fertility is represented by fluxes of elements that are held in the soil and slowly made available to plants, as well as additions to the soil through atmospheric deposition and mineral weathering (Ranger and Turpault, 1999). Plantation soils lose nutrients through the export of wood and bark from a site, burning of residues, soil erosion and leaching (Spangenberg et al., 1996; du Toit and Scholes, 2002). These losses are often not compensated for by the inputs to the system pools. Maintaining soil fertility can, in theory, be done by using fe11ilisers, but may not be desirable due to economic constraints or by the risk of the negative environmental impacts of fertiliser addition (Nambiar, 1996).
Increasing demand for tree products is resulting in an increase in the plantation areas and a shortening of rotation lengths, with a consequent loss of soil fel1ility. Shortening a rotation can increase the rate of nutrient export and result in increased nutrient depletion rates, as the proportion of nutrient rich sapwood is higher in yowlger trees than in older trees (Richards and Charley, 1983). Renewable energy production demands have often forced the use of whole tree harvesting with the non-stem tree p011ions used for fuel wood. Stem-only harvesting has been shown in numerous cases, to be the most effective method of site conservation, having the lowest potential nutrient removal. Harvesting studies looking at varying intensities and different rotational ages show potentially more rapid nutrient depletion with shorter rotation lengths and increased harvesting intensity (Moller, 2000; Ranger et aI., 1995). On sites where whole tree harvesting is the only option, it has been recommended to leave the trees to dry out, allowing the nutrient-rich leaves and twigs to fall to the ground before tree removal (Moll er, 2000).
Removal of more biomass from plantations, especially by whole tree harvesting, may result in substantial system nutrient and soil carbon losses from the system as shown by Parrotta (1999) in Eucalyptus plantations. Losses to soil carbon pools are especially important, as this is difficult to replace (Nobleet al., 1991). The soil carbon pool is the principle source and sink of plant nutrients and holds the major portions of soil nutrients, especially N (Fisher and Binkley, 2000). The best ways to reduce these losses include altering the rate of removal, changing the components that are removed and by selecting low nutrient removing species (Kumar et al.,
1998; Moller, 2000). Optimising silvicultural practices specific to various site class ranges will ensure optimal wood production and environmental protection (Ranger and Turpault, 1999).
Understanding the potential long-term impacts of nutrient loss as a result of vanous management practices or harvesting intensities, in conjunction with site factors, may help managers to select the most ecologically and economically sound management practices, while understanding the potential long-term impacts (Santana et aI., 2000). Creating a budget-type balance of nutrients entering and leaving a site, is essential in detennining the impact of commercial operations on the nutritional sustainability of the site. The subsequent development of nutrient budgets to examine and predict the changes in biomass and hence nutrient content across sites, rotation ages and stand densities is highly desirable for the comparison of nutrient removal between different conuTlercial operations.
1.3.12 Nutrient budgeting
Nutrient budgeting involves the quantification of nutrients entering and leaving the forest nutrient cycle by drawing up a comparative input-output budget (Moll er, 2000). The nutrient budget attempts to quantify the nutrient cycle and encompasses the inputs, movement within the cycle and outputs from the cycle, with inputs usually nearly balancing outputs in a natural ecosystem. The rates at which nutrients enter and exit systems are commonly presented on a per year basis in order to compare systems of different ages and different management practices.
Additions of nutrients to the system
utrients are added to the system by atmospheric deposition, mineral weathering, nitrogen fixation, and anthropogenic inputs. Lateral fluxes are of lesser importance and include processes such as movement of fauna, colluvial movement and lateral drainage. Nitrogen enters the system via wet and dry atmospheric deposition and by soil microbial N fixation in the forms of NO" N02, and NH3 •Although geological weathering is not an impoliant short-term source of minerals, many nutrients such as K, Ca, Mg and especially P, become available to the trees through mineral weathering (Jorgenson et al., 1975) whereas addition of N by this process is often negligible. Deposition is also an important source of P, Ca, Mg, and K (Binkley, 1986;
Morris, 1992; Ranger and Turpault, 1999).
Fertilisation, an impoliant Nand P source, is an anthropogenic input, although Binkley (1986), shows, on average, only 20% of added nutrients to be taken up by the trees. Much of the feliiliser will become immobilized by adsorption through geochelnical processes and microbes,
and only become available in the long-term. Immobilisation of nutrients in the organic soil layer may also result in the unavailability of these nutrients for a time (Olbrichet al., 1997). The cost of fertilisers and the risk of polluting rivers and ground water are important considerations if this method of nutrient replacement is to be used. The supply and rate at which nutrients become available is important for the ability of the soil to supply nutrients for tree growth. For example, small nutrient pools may not be a limitation to growth rate of the CUITent tree crop, provided that sufficient quantities of nutrients become available to supply tree demands.
Losses of nutrients from the system
Losses occur through leaching of nutrients out of the rooting zone, soil erOSlOn, burning of harvesting residues or wildfires, and biomass harvesting (Binkley, 1986; Ranger and Turpault, 1999; du Toit and Scholes, 2002). Losses also occur naturally, varying from site to site, as a result of overland flow, subsurface flow and groundwater movement (OlbrichetaI., 1997).
Fire and biomass removal are the two most important ways by which nutrients can be lost, with the latter often being the largest removal mechanism (Binkley, 1986). Black wattle sites may be prone to high levels of losses due to the intensity at which they are harvested and as a result of burning being used for residue management. This burning may result in large nutrient losses through exports in smoke, volatilisation and oxidation. Oxidation is the major loss mechanism, while lesser quantities of Nand S may volatilise (Fisher and Binkley, 2000). Smoke contains large amounts of ash, which contains all nutrients (Binkley, 1986). Loss of ash by water and wind erosion can also add to the nutrients lost. However, Beard (1961) points out that a decline in the growth of subsequent rotations ofA. mearnsii after burning could be detected only if ash is lost through erosion. Losses are lower with low intensity fires; losses rise quickly with temperature increases above 200°C (Binkley, 1986). Temporally immobile nutrient stores in the organic matter may also be lost tlu'ough fire either by volatilisation or subsequent leaching (Olbrichet al.. 1997). Black wattle growers have moved away from burning of residues (Norris el al.. 1995), and the retention of plantation residue has resulted in silvicultural operations being more difficult, especially with the preparation of planting position, planting and fire risk management (Littleet aI., 1996).
Leaching losses in the rotational period are dependent on soil water movement and soil water balance (Ranger and Turpault, 1999). These losses are most impOltant for ,K, Ca, and Mg.
Processes that increase water percolation or the quantity of mobile anions in the soil may lead to increased base cation losses through leaching. Nitrate ions may increase in soil through
increased mineralization or N fixation, followed by nitrification in both cases (Fisher and Binkley, 2000). itrogen fixation by black wattle may also accelerate soil acidification and base cation leaching if the trees do not take up the N. Atmospheric deposition will supply NO}- and SO/, which could increase leaching losses (du Toit, 2002b). Losses are accelerated in the interim period between harvesting and re-establishment by the increase in decomposition, leaching and soil erosion rates (Binkley, 1986). A decrease in water uptake increases soil temperatures with greater water movement through the soil. This adds to the losses, which can last up to five years after re-establishment (Worrell and Hampson, 1997). These losses need to be considered when estimating the losses associated with harvesting.
Studies of whole tree harvesting effects on site soil nutrient capital show variable results; Mroz et al. (1985) found losses in soil N, Ca, Mg and K, while P was unaffected. The loss ofN in the upper soil layers may have been the result of soil disturbance through harvesting. Greater nutrient loss has been reported from higher quality sites through the extraction of a larger biomass (Birk, 1993). The impact of harvesting removals may be more severe for sites that are climatically more favourable than for poor sites, especially for sites with a low nutrient capital.
A reduction in productivity as a result of biomass and hence nutrient removal is dependent on the site in question, the frequency of biomass removal and the quantity of biomass removed (Ranger et al., 1995; Moller, 2000). Sites with low proportions of soil nutrients relative to the biomass such as shallow sandy soils may be more rapidly depleted (Compton and Cole, 1991).
Analyses balancing nutrient inputs and outputs in southern African plantations in general have shown mixed results. Morris (1992) found that the export of nutrients in P. patl/la logs should be balanced by all nutrient inputs into the system, while Scholes et al. (1995) concluded that there was a high potential for nutrient depletion, pal1icularly of magnesium. Each forest ecosystem must be considered individually in drawing up a nutrient budget, as each site has a unique set of species, site factors and harvesting practices.Inmost cases where nutrient budgets have been completed, N, P and K have been found to have the greatest risk of depletion (Norton and Young, 1976; du Toit and Scholes, 2002).
1.3.13 Past biomass and nutrient studies on A. mearnsii
Although a vast amount of work has been done on allometry and biomass for many species, including a few commercial tropical plantation species, only a limited number of studies provide nutritional information (Santana et al., 2000). Allometric relationships from studies on species and sites cannot be used onA. mearnsii in South Africa, as these relationships may not
be transferable between species, sites or growing conditions (Waring and Schlesinger, 1985).
Complete studies of biomass production and allometry of many Australian acacia species are also limited. However, work has been done onA. mearnsii provenances in Brazil (Pereira et aI., 1997; Caldeira et al.. 1999; Caldeira et al., 2000a; Caldeira et al., 2000b; Pereira et aI., 2000;
Caldeira et al., 2001;), India (Tandon et al.. 1988) and South Africa (Dicks, 2001; Williams, 1927). The studies in Brazil describe dry masses of the various tree components, bole, bark, dead and live branches, and foliage. These studies together with those in India include information on the nutrient content of the total AGB and individual tree components. However, the work in India does not include dead branches, and foliage was sampled together with small twigs.
South African biomass and leaf area estimation studies were carried out for firewood fuel estimation (Garbutt et al., 1978), pest and disease assessment (Veldtman et aI., 1995) and 3-PG model parameterisation (Dicks, 2001). Dicks (2001) performed a preliminary estimation of 3- PG parameters using a small sample data set covering three sites. Veldtman et al. (1995) attempted to estimate leaf areas using non-destructive techniques, and Garbutt (1978) used a biomass study to estimate the firewood fuel yields of a wattle plantation. Another biomass estimation study in South Africa used 10.5-year-old trees 011poor and "average" quality sites, with foliage including small twigs (Schonau, 1978). One important factor that was excluded in most of these studies was LAI, only attempted by Veldtman et al. (1995), with limited success.
Although little has been published on the analysis of nutrient concentrations and contents, the earliest works found on South African black wattle were completed in 1927 and 1937 (Williams, 1927; Steyn, 1937). Williams (1927) analysed concentrations of iron (Fe), Ca, Mg, K and P in each of the various plant components and calculated the potential removal of these elements by bark and wood harvesting. His work focus sed on the bark yield and quality for an eight-year-old stand, with nutrient analyses to estimate potential rates of soil nutrient exhaustion. The work by Steyn (1937) lists only the foliar concentrations of nutrients in wattle leaves. Advances in laboratory techniques and the effect of recent breeding studies on A.
mearnsii may have reduced the validity of this past work. A comprehensive study in South Africa on allometry and biomass estimation with nutrient distributions sites has not yet been done.
Findings from past studies
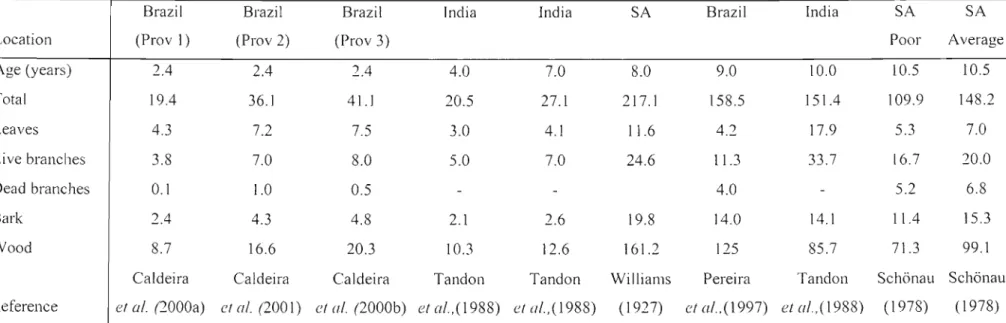
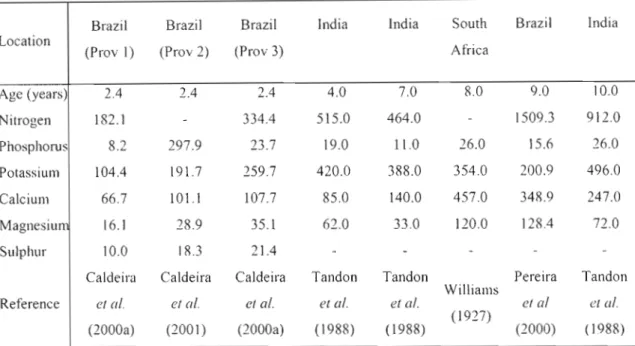
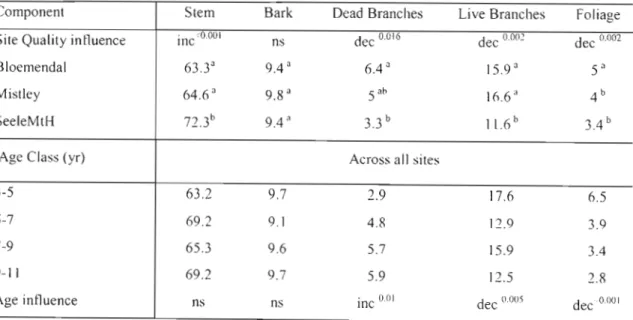
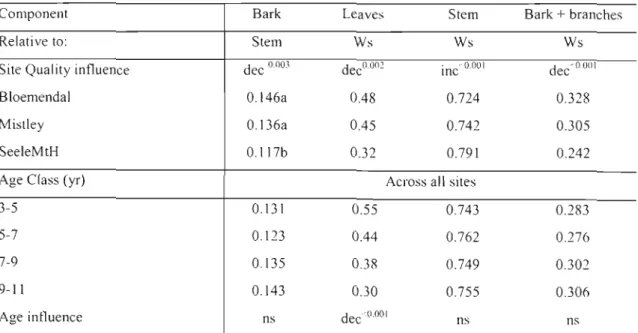
Table I and Table 2 details results obtained from international and local biomass sampling exercises showing biomass of individual tree components and total aboveground nutritional content. Total harvesting removals (Table 3) were estimated for each nutrient using nutrient content (Table 2), for total AGB removal (Table 1). No further calculations were performed by these authors to estimate the quantities of nutrients removed by various harvesting practices, although all the necessary data are available. Logarithmic conversions and linear regression tec1miques were used to generate allometric equations, predicting each of the tree component masses. The con-elation coefficients and significance levels were high in each study, although no other statistical data was shown for the derived relationships. The proportion of wood mass to total biomass is greater in older trees and on sites that are more productive, while the proportion of leaves and branches decreases in both cases. The stem wood contributed the most to total biomass with contributions decreasing in the following order; branches, leaves with twigs, and bark respectively.
Foliar element concentrations in the younger wattle trees were higher than those in the branches and bark, except for Ca, where bark concentrations in four-year-old trees exceeded those in the foliage (Tandon et a/., 1988). Pereira et al. (2000) and Tandon et al. (1988) demonstrated that older wattle trees have the highest concentrations of elements in the leaves, except for Ca and Mg, which are highest in the bark. The lowest concentrations of nutrients were found in the wood, although stem wood is the largest contributor to total AGB. Wood and bark combined contain the greatest proportion of the above-ground nutrient mass, comprising a total of 75%
(Pereira et a/., 2000; Tandon et al., 1989).
Nutrients contained in the AGB (Table 2) have high levels of variability between ages and locations, hence making it difficult to compare the resultant data, although the masses of nutrients held in the biomass seems to be strongly related to the mass of the biomass.
Table 1: Biomass of above-ground components of A. mearnsii (t ha-I) at different ages and locations.
Brazil Brazil Brazil India India SA Brazil India SA SA
Location (Prav ]) (Prav 2) (Prov 3) Poor Average
Age (years) 2.4 2.4 2.4 4.0 7.0 8.0 9.0 10.0 10.5 10.5
Total 19.4 36.1 41.1 20.5 27.1 217.1 158.5 151.4 109.9 148.2
Leaves 4.3 7.2 7.5 3.0 4. I 11.6 4.2 17.9 5.3 7.0
Live branches 3.8 7.0 8.0 5.0 7.0 24.6 11.3 33.7 16.7 20.0
Dead branches 0.1 1.0 0.5
-
- 4.0-
5.2 6.8Bark 2.4 4.3 4.8 2.1 2.6 19.8 14.0 14.1 11.4 15.3
Wood 8.7 16.6 20.3 10.3 12.6 16] .2 125 85.7 71.3 99.1
Caldeira Caldeira Caldeira Tandon Tandon Williams Pereira Tandon Schonau Schonau
Reference et al. (2000a) et al. (200]) et af. (2000b) etaf.,(l988) el a/.,(1988) (1927) et a/.,(1997) et aI.,(I988) (1978) (1978) Prov. = provenance; SA
=
South AfricaTable 2: Nutrient contents of the above-ground biomass ofA. mearnsii (kg ha-I) at different ages and locations.
Brazil Brazil Brazil India India South Brazil India
Location
(Prov 2) (Prav 3) Africa
(Prov 1)
Age (years) 2.4 2.4 2.4 4.0 7.0 8.0 9.0 10.0
Nitrogen 182.1 334.4 515.0 464.0 1509.3 912.0
Phosphorus 8.2 297.9 23.7 19.0 11.0 26.0 15.6 26.0
Potassium 104.4 191.7 259.7 420.0 388.0 354.0 200.9 496.0
Calcium 66.7 101.1 107.7 85.0 140.0 457.0 348.9 247.0
Magnesiu 16.1 28.9 35.1 62.0 33.0 120.0 128.4 72.0
Sulphur 10.0 18.3 21.4
Caldeira Caldeira Caldeira Tandon Tandon Pereira Tandon
Williams
Reference et at. et at. et al. et al. et al. et al et al.
(1988) (1988) (1927)
(2000) (1988) (2000a) (2001) (2000a)
The potential removal of N, P, K, Ca, and Mg may be calculated as a sum of the nutrients contained in the harvested pmis (Table 3). Pereiraet al. (2000) and Tandonet a!. (1988) showed large differences in potential nutrient removals, which may be attributed to higher nutrient concentrations found by the former author. Very large differences are evident between values displayed in Table 3, especially with N and Ca in the wood. These differences (underlined in Table 3) may indicate that a very large range is possible from such studies as a result of different ages, site growing conditions or silvicultural practices. They may also be due to analytical or calculation errors.
Table3: utrient removals for wood, bark and branches (kg ha-I) inA. mearnsii stands.
Component
I
N P K Ca Mg9-year-old stand in Brazil (Pereiraet al., 2000)
Wood 1088.7 2.5 26.3 117.5 55.0
Bark 160.8 3.4 52.3 133.8 25.3
Branch 111.7 5.1 83.6 49.6 26.0
7-year-old stand in India(Tandonet aI., 1988)
Wood 171.3 6.0 60.0 .llJ. 25.7
Bark 106.0 0.6 91.8 251.2 12.7
Branch 107.7 2.7 148.1 37.0 10.1
8-year-old stand in South Africa (Williams, 1927)
Wood 9.0 154.0 208.0 69.0
Bark 4.0 56.0 135.0 14.0
Branch 9.0 47.0 53.0 16.0
Large amounts of nutrients are removed with harvesting; extraction of stem wood, bark and branches can result in losses of over 80% of the nutrients held in the AGB. Large amounts of nutrients may potentially be removed from a black wattle site if whole tree harvesting is practiced or if firewood collection (branch harvesting) is w1dertaken. With ern-rent South African fertiliser recommendations of 19 - 36 kg P ha-I and 0 - 29 kg K ha-I as a general application at planting (du Toit, 2002a), it is clear that fertilisation alone cannot replace harvesting losses. Although P addition by fertilisation is close to the maximum lost through harvesting, P fixation and limited P uptake may result in a net loss of P from the system.
Demonstrating a high nutrient depletion rate may be misleading as other natural system inputs may be amending these losses to soil nutrient stores, although a proper assessment cannot be done for the sites in Table 3 without knowing the supply potential of each site. The pressures exerted on the plantation forest ecosystems and hence the sustainability of forestry practices may b