AT HIGH ALTITUDE SITES IN THE EASTERN CAPE PROVINCE
by
George Frederik Theart B.Sc For. (Stellenbosch)
Submitted in fulfillment of the requirements for
the degree of
MASTER OF SCIENCE
Forestry Programme
School of Agricultural Services and AgriBusiness University of Natal
PIETERMARITZBURG
This thesis is the result of the author's own work and contains, to the best of his knowledge, no other work accepted for any other degree or diploma at any University, nor any material which has previously been published except where due reference is made in the text.
\
G.F. THEART
Date:
ABSTRACT
The growth of four pine species Pinus patula, P. greggii, P. elliottii and P. taeda was investigated on first rotation high altitude sites in the north-eastern region of the Eastern Cape Province. The study area encompass a broad range of sites in terms of soils (texture, drainage, depth) and climate (temperature and precipitation). Afforestation across the study area proved challenging and there is a need to better understand survival, tree growth and site variables that contribute to the unique forestry environment.
Enumeration data of 539 compartments totalling 11 380 ha with an age-class distribution from 4 to 13 years were analysed using statistical analyses techniques, interpretation based on other research results and personal field experience. The dataset represents the first commercial scale growth information for the four species in the study area.
The research was designed to study the survival of the four pine species and to analyse if there were any seasonal impacts on the latter. Furthermore, the tree growth, expressed as a site index at age 10years (51 10) and basal area at age 10 years (SAlO), was analysed to investigate the performance of the four pine species. Lastly, the relationship between tree growth expressed in site index(5110) and basal area (BA10) and site characteristics was investigated.
On average the best survival species were P. elliottii and P. greggii yielding 69%
and 68% respectively, with P. patula yielding a 56% survival. There was no
statistically significant difference in the survival between the planting months for all species combined, however, P. patula showed significant differences between planting months. In addition there are statistically significant differences between the species in terms of Site Index and Basal Area and there is a relationship between growth and site variables.
Evidence leading to the following conclusions is provided:
i) P. patula is the worst species planted in North East Cape Forests (NECF) in terms of survival;
ii) August is the best and November the worst planting month for P. patula;
iii) the importance of species selection and site matching;
iv) the successful introduction ofP. greggii;
v) tree performance can be explained with site variables, especially those derived from climatic information.
ACKNOWLEDGEMENTS
The motivation for undertaking this study stems from the many challenges experienced as an operational forester, as well as the many unanswered questions stemming from interaction with amongst others Malcolm Hensley, Karl Monnik, Janusz Zwolinski, Mike Wingfield, Keith Little, Martin Herbert, Mike Howard, Eric Droomer and my fellow foresters at North East Cape Forests.
I thank Professor Janusz Zwolinski for his patience, friendship, mentorship and support during the supervision of the study.
I am indebted to Hendrik Bouwer, Anton Botha, Raff Matthews, Karl Monnik and Lorette Stander for their assistance with maps and data sets.
Ben Pienaar, Karen Chiswell and Winston Groenewald for their advice and help with the data organisation and the running of the statistical analyses.
I would also like to extend my special thanks to Bruce Hulett, Doggy Kewley, Neville Brummer and Kerry Davies for their support and understanding during this study.
To my wife, Ansa, for the typing, editing and many late nights, espescially her support when motivation levels dwindled.
To so many other valued collegues and friends who contributed through valued support.
This study was carried out with support from Mondi Forests Ltd.
CONTENTS
ABSTRACT
ACKNOWLEDGEMENTS CONTENTS
LIST OF TABLES LIST OF FIGURES LIST OF PLATES
iii
v
vi ix xi xii
1. INTRODUCTION 1
1.1 Forest Plantations in Retrospect 1
1.2 North East Cape Forests 5
2. OBJECTIVES AND HYPOTHESES 7
3. CHARACTERISTICS OF THE STUDY ARItA AND SITE FACTORS 9 ) 3.1 Description of the Study Area
3.2 Vegetation and Previous land Use 3.3 Geology and Soils
3.4 Climate
3.4.1 Temperatwe 3.4.2 Precipitation
3.4.3 Comparative Climate
4. OTHER FACTORS POTENTIALLY INFLUENCING TIMBER PRODUCTIVITY
4.1 Old Land Syndrome including Soil Characteristics, Toxic Characteristics, Pests and Pathogens
4.
f1')
Soil Physical Properties4.1.2 Soil Nutrient Status and Fertilization 4.1.3 Toxic Chemicals
4.1.4 Rodent Damage
9 14 15 23 23 26 32
35
35
36 38 39 40
4.2 4.3 4.4
4.5
4.6 4.7 4.8.--"-\-,
) '-4.9..-_...
4.10 4.11 4.12
4.-13;
4.1.5 Pathogenic Fungi 4.1.6 Soil Insects 4.1.7 Soil Nematodes 4.1.8 Weed Control
4.1.9 Methyl Bromide Fumigation Root Development
Tree Breeding and Species Choice
Growth of Pines and their Timber Properties at North East Cape Forests
Silvicultural Practices 4.5.1. Site Preparation
4.5.2. Quality of Plants and Planting Operations 4.5.3. Weed Management
4.5.4. Fertilization Abiotic Risk
Human Factor
Products and Regimes
Land Acquisition and SUitability of Soils Top Die-back
Road Construction
Socio-Economic Parameters
Drought, Wind, Soil Temperature, Snow and Hail
41 42 43 44 44 45 49
50 55 55 58 61 65 67 67 68 68 69 72 73 73
6. THE SURVIVAL OF FOUR PINE SPECIES 98
6.1 Introdu~tion and Objectives 98
6.2 Methods 100
6.3 Results 102
6.4 Discussion and Conclusion 107
5. SAMPLING METHODS
5.1 Sampling
5.2 The Circular Plot Method 5.3 Error factors
92
92 94 97
7. THE PRODUCTIVITY OF FOUR PINE SPECIES 111
7.1 Introduction and Objectives 111
7.2 Methods 112
7.3 Results and Discussion 115
7.4 Conclusion 120
8l
)
9.
THE RELATIONSHIP BETWEEN THE GROWTH OF PINE AND SITE CONDITIONS
8.1 Introduction and Objectives 8.2 Methods
8.3 Results and Discussion 8.4 Conclusion
RECOMMENDATIONS FOR FURTHER RESEARCH
121 121 121 132 142
149
10. REFERENCES
11. APPENDIX 1 Example of site variables investigated
150
170
LIST OF TABLES
Table Page
1 Change in mean annual precipitation (MAP) due to altitude and
distance from the Indian Ocean 12
2 Characteristics of the respective management units (estates) 13 3 Records and model-based monthly maximum, mean and
minimum temperatures 25
4 Average monthly maximum, mean and minimum precipitation 30 5 Tree and stand characteristics at NECF estimated at 18 years of
age 51
6 Basic wood characteristics and thermo mechanical pulping (TMP) results for timber samples from six P. patula and two P. elliottii stands
7 Summary of thermo mechanical pulping characteristics 8 Districts which reported severe snow damage to commercial
forest plantations ranked in order of decreasing severity 9 Snow depth values for various locations in KwaZulu-Natal,
53 54
82
July 1996 86
10 Potential risk of snow damage to commercial forest plantations
in relation to altitude for the KwaZulu-Natal region 86 11 Resistance to snow damage of various tree species 88
12 Summary of tree survival by species 102
13 Summary of tree survival by planting month 102 14 Results of the analysis of variance for arcsine transformed survival
for the four species of pines 104
15 Means of tree survival for the four pine species (different letter index shows statistically different means at ps0,05, using Tukey's H8D Test) 105 16 Results of the analysis of variance of tree survival with planting month
as the treatment, for all pine species 106
17 Results of the analysis of variance for P. patula survival with
planting month 106
18 Mean survival of P. patula for various planting months 107 19 Basic summary statistics for site index (8110) by species 116 20 Analysis of variance of site index (8110) with pine species as the
treatment 116
21 Mean site index (8110)for the four pine species and results of Tukey's H8D
test 117
22 Basic summary statistics for basal area (BAlO) for all four pine species 118 23 Analysis of variance of basal area with the pine species as the
treatment 118
24 Mean basal area (BAlO) for the four pine species and results of
Tukey's H8D test 119
25 General descriptive statistics for the variables used in the analysis 127 26 Correlation analysis for BAlO, 8110, survival and site variables for all
species combined 132
27 Pearson's correlation coefficients analysis for BAlO, 8110, survival and site variables for each of the four pine species
28 Multiple regression models of site and growth relationships for all pines combined and by individucal pine species investigated
136
141
LIST OF FIGURES Figure
1 Location of study area
Page 10 2 Location of midpoints for all enumerated compartments overlayed
on geology
3 Maximum wind, monthly average maximum temperature and
16
monthly average rainfall occurrence during 1998 23 4 Annual rainfall for the north-eastern part of the Eastern Cape
Province 26
5 Seasonal rainfall for the north-eastern part of the Eastern Cape
Province 28
6 Schematic diagram of plot layout 96
7 Schematic diagram of a plot with trees 96
LIST OF PLATES Plate
1 Illustrating of the study area
Page 11
1. INTRODUCTION
South Africa is a country of low mean annual rainfall where only 16% of the land is climatically suiTable for commercial timber production (Forestry Guidelines for South Africa, 1982). As a result, most of the natural vegetation is non-woody, with natural forests only occurring along the southern and eastern seaboards and open canopy savanna woodlands in the north-eastern interior of the country. Compared to a world mean forest cover in excess of 30% of land area, the natural closed canopy forest covers only 0,5% and savannah woodlands 19% of the total land area in South Africa (Owen and van der Zel, 2000). Historically efforts were made to conserve the remnant closed canopy forests, while developing a thriving industry based on introduced exotic timber plantation resources. These plantations presently cover slightly less than 1,4% of South Africa (Owen and van der Zel, 2000). Minimal attention was given to the natural woodlands, except in areas primarily conserved for the protection of fauna (Owen and van der Zel, 2000).
1.1. Forest Plantations in Retrospect
In 1488, when the Portuguese navigator/explorer Bartholomew Diaz and his crew sailed along the western and southern coasts of South Africa, they saw evergreen mixed-species, tall forests similar to Mediterranean macchia and sclerophylous shrubs (fynbos) being the dominant groups. One hundred years later the Dutch East India Company started exploitation of this forest to supply its base in Cape Town. Irrespective of the political powers governing the region (Portuguese, British, Dutch or Africans), the need for timber was constantly rising. The giant
yellovvwoods (Podocarpus spp.) and stinkwoods (Dcotea bullata) were harvested first to provide construction materials for ships, houses, bridges, railway lines, ~tc.
The growing population also placed an increased demand on the resource through the clearing of land for agriculture and firewood.
At the turn of the last century, when Kimberley's diamonds and the Witwatersrand's gold were discovered, the demand for timber exceeded the production rates of the indigenous forests, of which only around 360 000 ha remained (Owen and van der Zel, 2000). A pioneer plantation was established in the Western Cape in 1876 to produce fuelwood for the railroads leading to the interior. This was followed by the introduction of many exotic tree species in extensive trials with the aim of selecting high production and quality merchantable timber (Forestry Guidelines for South Africa, 1982).
South African forests gained real significance in 1652 with the arrival of the Dutch in the Cape and again in 1820 when the English arrived in the Eastern Cape and Natal. Woodlands increased in significance with the colonising of the interior after 1836 (Owen and van der Zel, 2000).
The early history of the closed canopy forests was one of uncontrolled exploitation and devastation. It was not until the early 1700s and the mid 1800s that attempts were made to protect the forests of the South-Western Cape and the Eastern Cape respectively. The first Forest Act, for the Cape Colony, was promulgated in 1888 after the appointment of the first formally trained forest officer in 1880. Prior
to the Union in 1910 there were four Provincial Forest Services, with the most active being in the Cape Colony (Owen and van der Zel, 2000).
Though Governor van der Stel had established a plantation of oaks at Newlands in 1670, it was not till 1875 that the first real planting of exotic timber species began.
Black wattle (Acacia mearnsii) had been introduced from Australia in 1864 and by 1880 the bark extract was recognised as a superior tanning material. Plantings expanded into the early nineteen hundreds. By 1910 an area of 60 000 ha was commercially planted to wattle (Forestry Guidelines for South Africa, 1982; Owen and van der Zel, 2000).
After the Union in 1910, a Chief Conservator of Forests was appointed and the provincial services were brought under federal control. In the early years, up to the Second World War, forestry was almost exclusively a State affair and strongly associated with agriculture. The one exception was the wattle industry in KwaZulu-Natal, which was largely private. After the Second World War an independent Department of Forestry was established within the State. The early Union forestry services pursued a protectionist strategy towards the remaining closed canopy forests, whilst moving forward with the establishment of exotic timber plantations. During these years many small plantations (mostly large woodlots) were established along the eastern seaboard, especially in the Eastern Cape. Many of these were associated with small remnants of natural forest and made use of wattle to produce building materials for rural housing, thus protecting the forest remnants. Qlln 1938 it was recorded that 150 000 ha of "commercial"
timber plantations and the first sawmill had been established by the State. The
private planted areas had increased to 370 000 ha, including 220 000 ha under wattle (Owen and van der Zel, 2000).
The Second World War brought into focus South Africa's geographic vulnerability in respect of timber supplies and in the early 1950s the State set about expanding the timber resources, especially by encouraging the private sector to plant trees.
This brought about an immense surge in afforestation. By 1960 the total planted area had reached 981 640 ha, of which 720 320 ha, including 355000 ha wattle, were privately owned (Owen and van der Zel, 2000).
By 1975 the total planted area had reached just over 1,1 million ha, of which 769000 ha were privately owned. International markets for wattle bark peaked in 1962 and as the market declined later, large areas of wattle were converted to eucalypts or agricultural crops such as sugar cane (Owen and van derle', 2000).
By 1985 the Department of Forestry controlled 1,6 million ha of land, of which 263 000 ha were under commercial timber plantations. In terms of the Government of the day's policy, the eight independent and self-governing administrations controlled a further 350 000 ha of land, of which more than 150 000 ha were under plantations. The officially recorded public planted area was 333 776 ha and the area under private ownership was 800 000 ha. In 1986, 1,0 million ha of unplanted State forest mountain catchment area, along with a small plantation area, was transferred from the Department of Forestry to the Provincial Nature Conservation authorities.
In 1990 the Government decided to commercialise its timber production activities.
The South African Forestry Company Limited (SAFCOL) took over approximately 500 000 ha of State forest land, of which 263 000 ha were timber plantations. The State retained 86 000 ha of land, most of which was under closed canopy natural forests, whilst the independent and self-governing administrations had a commercial and community plantation area in excess of 160 000 ha. The official total planted public plantation area was 418 023 ha. The plantations under private ownership were 952 870 ha, including a wattle area of 124117 ha (Owen and van der Zel, 2000).
After the democratic election in 1994, the plantations of the former independent and self-governing administrations returned to the control of the Department of Water Affairs Forestry. This was intended to be a temporary measure with the objective to privatise the commercial timber interests of both SAFCOL and the Department (Owen and van der ZeI2000).
1.2. North East Cape Forests
A shortage of suitable land, competition between various land use sectors and legislation and social realities in the late 1980's led to afforestation projects in areas outside traditional forestry regions. One of these projects was the North East Cape Forests (NECF) Joint Venture, established in the districts of Elliot and Maclear in 1989. The initial project plan was to establish 66 000 ha of which 60%
would consist of Pinus species and 40% of Eucalyptus species (Botha, 1996).
Following a strategic review in 1993 (Zobel, 1991 and 1993), it was decided to focus on pines only. The NECF holdings encompass a broad range of sites in
relation to soils (texture, drainage, depth) and climate (temperature and precipitation) (Herbert, 1997). In general, however, they differ markedly from other forestry areas in South Africa, particularly with regard to the presence of mudstone and basaltic soil parent materials, specific hydrological features, low temperatures, snow and strong winds. Afforestation across the landholdings has proven challenging and there is a need to evaluate timber growth in terms of performance across the landholdings, therefore, an understanding of the site factors and their relationship to yield of timber is necessary. The first large scale enumeration undertaken during 1998 and 1999 thus afforded me the opportunity to evaluate and test my understanding and experiences acquired as an operational forester at NECF. It furthermore presented the unique opportunity to evaluate the first large scale deployment of P. greggii from Mexico. This, coupled with the unique geology and often challenging climatic conditions, presented an opportunity to evaluate the unique and promising timber growth parameters of the Eastern Cape Highlands.
2. OBJECTIVES AND HYPOTHESES
Whilst it was clear that the site types are unique, there was a necessity to understand, quantify, and calibrate exactly what this uniqueness comprised. This information was needed for the development of site-specific management recommendations. Furthermore, a better understanding of the site growth parameters would assist foresters to select and optimise current available species and indicate where the highest quantity and quality timber was likely to occur.
The objective of this study was to analyse and interpret the results of the first widespread enumeration of pine stands conducted in NECF with special reference to P. greggii from southern Mexico. The dataset refers to 539 compartments totalling 11 379,23 ha across stands with ages ranging from 4,42 to 13,5 years.
The data were evaluated through analysis and interpretation based on existing research and personal field experience during my tenure as a forester in the region. This dataset represents the first commercial scale growth information for these species in the north-eastern portion of the Eastern Cape Province.
The research was designed to address the following hypothesis:
1. There is no difference in the survival of the four pine species.
2. There is no difference in the survival of the four pine species when planted in different months.
3. There is no difference in height and basal area growth of the four species of pine.
4. There is no relationship between height growth (site index (8110) and basal area (SAlO)) of P. patula, P. greggii, P. elliotlii, P. taeda and site characteristics.
3. CHARACTERISTICS OF THE STUDY AREA AND SITE FACTORS
3.1. Description of the Study Area
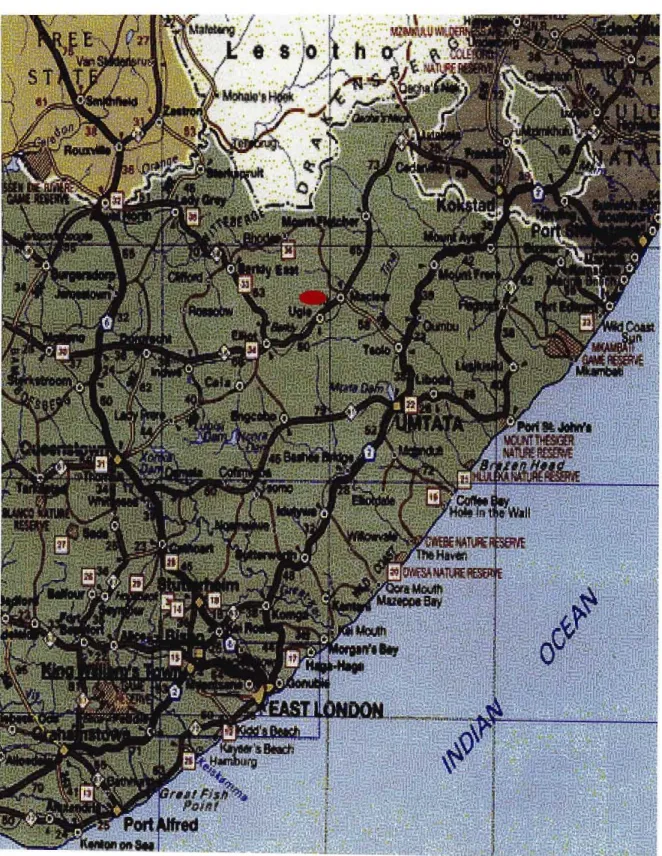
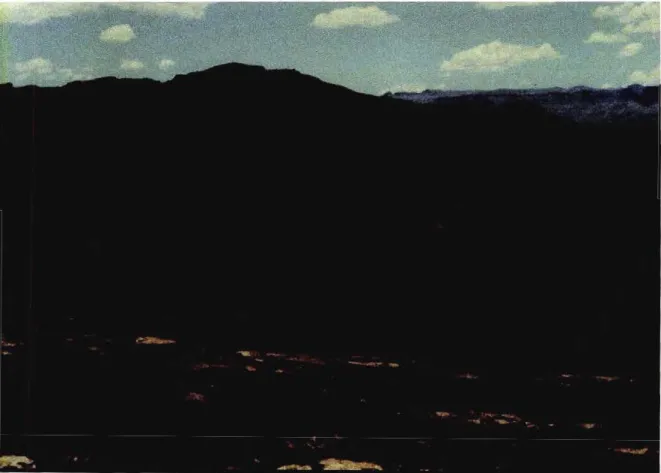
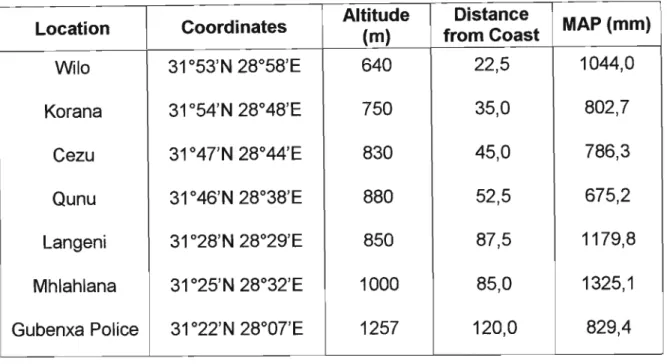
The study area lies between latitudes 30°55' and 31 °27' south and longitudes 28°02' and 28°21' east, along the south-eastem escarpment of the Drakensberg Mountains, as illustrated in Figure 1 and Plate 1. The Drakensberg dominate the regional topography and rise sharply from about 1 200 m 8.s.1 to over 2731 m a.s.1 (Cobels Kop) above the broken inland plains (1 000 -1 100 m a.s.l.) of the Qumbu and M1. Fletcher districts. The high escarpment is orientated approximately east- west in the vicinity of Elliot, becoming more south-west to north-east towards Ugie and then shifting to north-south in the eastern part of the North East Cape. The Tsitsa River, a tributary of the Mzumvubu River that enters the Indian Ocean approximately 140 km away at Port 51. Johns, drains the eastern portion of the land. Wind from the south-east comes off the coast near Coffee Bay, a distance of some 240 km. It has to cross a series of plateaus between 1 500 m and 1 700 m 8.s.1 south of the study area. Altitude, distance from the coast and topographic position has a pronounced effect on rainfall as illustrated in Table 1 (Herbert, 1997). Higher rainfall occurs closer to the coast, as· well as on the plateau ridges and southern aspect slopes. The relationship between altitude and rainfall, however, is complicated by topography, and microclimatic differences are influenced by rain shadows on the northern slopes (Herbert, 1997).
Figure 1. Location of the study area.
Plate 1. Illustration of the study area.
Table 1. Change in mean annual precipitation (MAP) due to altitude and distance from the Indian Ocean (Herbert 1997).
Coordinates Altitude Distance
MAP (mm)
Location (m) from Coast
Wilo 31 °53'N 28°58'E 640 22,5 1044,0
Korana 31 °54'N 28°48'E 750 35,0 802,7
Cezu 31°4TN 28°44'E 830 45,0 786,3
Qunu 31 °46'N 28°38'E 880 52,5 675,2
Langeni 31 °28'N 28°29'E 850 87,5 1179,8
Mhlahlana 31 °25'N 28°32'E 1000 85,0 1325,1
Gubenxa Police 31 °22'N 28°0TE 1257 120,0 829,4
The study area covers nine plantation management units referred to as estates.
On a north-east south-west axis, they are in order: Elands Heights, Killarney, Commonage, Chillingly, Glen Cullen, Wildebees, Inglewood, Roseg and Funeray.
As illustrated in Table 2, the key characteristics of the respective estates are different. Due to the geographic spread, evolution in management objectives over time and various management structures with resulting reconfiguration of boundaries, it was not possible to quantify or reflect these details in this review . except for reflecting broad based parameters. Elands Heights, with its basalt soils and high altitude landscape, is different from the lower altitude estates towards Maclear, Ugie and Elliot. Funeray and Inglewood represent the drier areas specifically to the south of the main tar road between Elliot and Maclear.
Commonage consists of properties leased from the municipality and due to its protected siting (from the prevailing wind), deep soils and proximity to
infrastructure, is considered to represent some of the optimal growth sites in NECF. The central estates (Chillingly, Glen Cullen, Wildebees and Roseg) are geographically consolidated with diverse site conditions including a significant percentage of post-agricultural (old) lands. Killarney is the most eastern estate in the study area with a wide range of sites. The later acquisitions consist of properties with a high afforestation· potential, with some of the initial acquired northern boundary properties being more marginal.
Table 2. Characteristics of the respective management units (estates).
Area Sub
Management Northern Southern Dominant
Planted Dominant
Unit Coordinate Coordinate Geology
(ha) Geology
Elands 30055'N 30054'N
1975,8 Drakensberg Clarens/Elliot Heights 28°14'E 28°11'E
30054'N 31°03'N
Killarney 3195,2 Molteno Clarens
28°21'E 28°16'E 31°01'N 31°0TN
Commonage 1474,4 Molteno Elliot
28°20'E 28°21'E 31°04'N 31°11'N
Chillingly 2046,4 Molteno -
28°1TE 28°16'E 31°02'N 31°09'N
Glen Cullen 4936,3 Elliot/Molteno -
28°11'E 28°12'E 31°0TN 31°13'N
Wildebees 2291,1 Elliot Molteno
28°11'E 28°1TE 31°09'N 31°15'N
Inglewood 1817,4 Molteno -
28°13'E 28°21'E 31°12'N 31°19'N
Roseg 4493,6 Elliot Molteno
28°04'E 28°06'E 31°16'N 31°2TN Funeray
28°02'E 3709,3 Molteno Elliot
28°04'E
3.2. Vegetation and Previous Land Use
According to Acocks (1975), the area is dominated by Highland Sourveld (unit 44a), but may also include areas transitional to drier and warmer Dohne Sourveld (unit 44b) in the lower elevations. The climate of Highland Sourveld is characterised by summer rainfall with severe winter frosts and snow at higher elevations. Hail storms are common in summer. The growing season is short and this land unit is considered to be difficult terrain for farming (Nel, 1998).
Remnants of indigenous forests suggest that, in the past, the area was dominated
;
by forest and scrub-forest vegetation with species such as Podocarpus latifolius, in the main forest canopy, Canthium ciliatum as undergrowth and Leucosidea sericea in forest margins. The grassveld replaced such forests in level topography, but this has become colonized with Protea multibracteata and/or P.
rouppeliae on slopes. The dominant grasses are Themeda triandra, Tristachya hispida, Trachypogon spicatus, Heteropogon contorutus and Eragrostis racemosa.
This grass composition can easily be reduced to Eragrostis planana through trampling or Acalypa schinzii through over-grazing by sheep (Herbert, 1997;
Forsythet al., 1996).
Prior to afforestation in 1989, the area was used extensively for livestock farming consisting of mixed cattle, sheep and goats. Maize cultivation was introduced, and is still practised successfully today in areas free from hail damage. Scattered woodlots ofAcacia meamsii, Eucalyptus camaldulensis, E. pauciflora, E. viminalis, Pinus elliottii, P. patula, P. pinaster, P. radiata and Populus spp. were planted (Herbert, 1997; Nel, 1996; Forsyth et al., 1996). Tree growth has ranged from
good to very poor according to a study of old stands (Zwolinski et al., 1997).
Overall, it is clear that species capable of withstanding freezing temperatures, snow and periodic drought have succeeded more consistently than the others.
Trees damaged by frost, wind, drought and/or hail may be found throughout the district.
3.3. Geology and Soils
The geology of the study area is underlain by Triassic sedimentary strata belonging to the Karoo Sequence, intruded in places by sills and dykes of Jurassic dolerite (Karpeta and Johnson, 1979; L10yd and Whitfield, 1990; Brink, 1983).
Structurally there is a gentle dipping of the strata inwards towards the Drakensberg escarpment, owing to the downward force from the mass of volcanic basalt. Different sediments are typically exposed on steep south-facing slopes, while long gently sloped northern slopes may be underlined by the same sediment type or lithology for considerable distances. Quaternary alluvia (Qa) are deposited by floods in the major drainage lines, often constituting wetlands or river terraces (Herbert, 1996b and 1997).
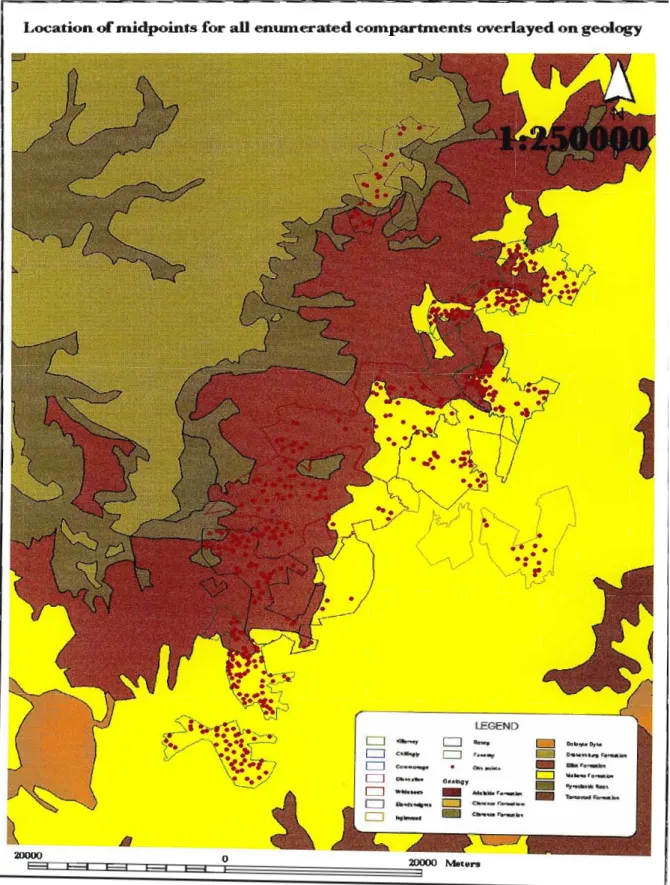
Across the region, the Karoo Sequence sediments are divided into Molteno Formation (Trm) sandstones, mudstones and shales, and Elliot Formation (Tre) mudstones and sandstones as illustrated in Figure 2. The Molteno Formation appears from an elevation of about 900 m a.s.1. in the Maclear District and has a total thickness of 400 - 500 m. Near Chillingly and Glen Cullen, the Elliot Formation above 1 340 - 1 360 m a.s.1 overlies it. These latter sediments may have a total thickness of up to 500 m (Herbert, 1997).
Figure 3. Location of midpoints for all enumerated compartments overlayed on geology.
LocationofIDidpoints forallenumerated cOIDpartIDents overlayed on geology
LEGEND
,,~.~.,. CJ lIa_u c::J Dab.,... D,.",
Clti';~.~ CJ r._.y ~ D. ___ nh"" f"a •••a.
C"' ...-ee 010"..,...
-
IilbJ"a r_b"Cl 1,ki . .'ICIJ"Q . . . .icIoI
G~elogy
-
I'y-..dn\klloo:..... - -
M<l~Idc,.._...-
T~J"Q._i:a."-'Od...'1tS lEl C~..
_r.._...
C. . ._f"Q.-i. .
E3 E3 F3 o
E'3 E3 I
20000 !'dete....
I
The Molteno Formation consists of 10 - 12 upward cycles, layers of alternating sandstones and mudstones, sometimes followed by a coal or carbonaceous shale horizon. The sandstone is medium to coarse-grained, often pebbly, and light grey to yellowish-grey in colour. The sandstone is largely composed of quartz which glitters in the sun. The (softer) feldspar content is usually below 5%. The lower 1 - 2 m of sandstone is coarse-grained and poorly sorted with numerous mudstone pebbles and rounded quartzite, chert and granite c1asts. This is followed by cross- bedded finer-grained sandstone grading into the over-lying mudstone. The pale- olive coloured mudstone is massive and soft. It may also contain subordinate grey shale. Each cycle of sandstone to mudstone has an average thickness of 40 - 50 m, and gives rise to large "steps" in the topography, often capped with a resistant quartzitic sandstone layer (Herbert, 1997; Karpeta and Johnson, 1979).
The Elliot Formation also consists of upward-fining cycles of sandstone, siltstone and mudstone, each cycle being about 60 m thick. Each cycle commences with approximately 1 m of poorly bedded fine to medium-grained greyish-red sandstone with mudstone clasts, followed by 20 m of fine-grained and cross-bedded sandstone. The sandstone may have up to 10% feldspar (Herbert, 1997; Karpeta and Johnson, 1979).
The sandstones pass upward into 40 m of siltstone and mudstone units of a greyish-red or (less commonly) greenish-grey colour. The Molteno sedimentary layers weathers into steep and rapidly stepped topography (Herbert, 1997;
Karpeta and Johnson, 1979).
Intrusions of Jurassic Karoo dolerite (Jd) occur as occasional sills and dykes within the Molteno and Elliot sediments. Where it has made contact with mudstone, it forms a black and flinty rock called Iydianite. The dykes are typically 3 - 10 m wide and are usually porphyritic in texture. Boulders of this basic, dark blue-grey, fine to medium-grained crystalline rock brake off and colluviate down-slope occasionally (Herbert, 1997; Karpeta and Johnson, 1979; Uoyd and Whitfield, 1990).
At high elevations, the pale-orange to pink fine-grained Clarens Formation sandstone is mainly in evidence as near-vertical cliffs on the edge of the escarpment and thus does not give rise to much plantable soils in most of the study area. In addition, it occurs discontinuously, unlike the other Karoo sediments. Its tendency to form sheer cliffs is due to it being well sorted in grain size and massive in form with poorly developed bedding. It has a fine to very fine- grained feltspathic sandstone or coarse siltstone content (Herbert, 1997).
The Drakensberg Formation Jurassic basalt consists of alternating bands of hard, massive, coarsely-crystalline rock and easier-weathering vesicular (air-bubble holes) varieties (de Decker, 1981). These alternations of harder and softer layers have given rise to the typically stratified or terraced appearance of the high Drakensberg. Individual flow of lavas average from 3 - 5 m in thickness, but may increase up to a maximum of 100 m. The thicker flows are generally more compact and non-vesicular and grey to greenish-black in colour as seen at Elands Heights (Herbert, 1997).
The vesicular lava is brownish-red or purple in colour and not as fresh as the massive non-vesicular bands. Thin flows of devitrified rhyolite also occur at Elands Heights on the farm Swithland. The blackish lavas appear to have weathered slowly, giving rise to shallow, often rocky yellow-brown apedal and structured subsoils. The vesicular brownish-red lavas have produced somewhat deeper soils, red apedal or weakly structured sub-soils, underlain by partially weathered rock and saprolite. The lavas weather to yield clay textured soils and are very base-rich, smectitic clays which are evident on the sticky and slippery roads (Herbert, 1997; L10yd and Whitfield, 1990).
This diverse geology results in differences in topsoils, subsoils and saprolite depending on lithology, topography and climate. The vessiculated basalt, being more porous, weathers faster, giving rise to deeper soils and softer and better- drained saprolite than the massive non-vesicular species. The least conducive to soil formation is (the fortunately scarce) de-vitrified rhyolite. The greater resistance of non-vessiculated basalt not only gives rise to a stepped landscape with irregular ledge formation, but also to soils and saprolite of variable depth and drainage.
Since local geology provides the parent material for soil formation at a particular site, it plays an important role in soil quality (Zwolinski et al., 1997). The geological parent material strongly affects soil texture, therefore the Jurrasic dolerite forms clay and silty clay textures and the Molteno and Elliot sandstones produce the sandy clay loam to sandy loam textured soils. Mudstones and siltstones of both formations have typically given rise to silty clay loam and clay
loam textured soils. The most common soil texture is clay loam followed by sandy clay loam and loam, clay and sandy loam. A small area of silty clay and silty clay loam soils occur as well (M.A. Herbert, pers. comm., Fractal Forest Africa,1997 and M. Hensley, pers. comm., Institute for Soil, Climate and Water, 2000).
Topography includes all landscape positions from valley bottom to scarp and plateau, while numerous ridges descend from the escarpment to form narrow buttresses overlooking the plains. The slopes are mostly steep, especially on the flanks of ridges and spurs and soil depth appears to decrease as the slope increases. This is probably related to soil surface and sub-surface drainage.
Accordingly, soil depth increases markedly on foot slopes and floodplains, but becomes shallow on ridgebacks and upper-mid slopes as illustrated by numerous rocky outcrops. It is particularly noticeable that southern slopes are frequently markedly steeper than northern ones, with generally shallow and very rocky soils.
Climate has a major influence on soil formation, both as regards precipitation and temperature. While the top of the escarpment (>2 500 m a.s.I.) is clearly the wetter site, its soils are shallow and rocky due to the mean annual temperature (MAT) being estimated below 8,9 °C. The low temperatures markedly reduce chemical weathering, the principle process for the breakdown of igneous (i.e. non- particulate) rocks. On the other hand, weathering also increases with precipitation, not only providing water for chemical solution, but also providing the deepest soil and saprolite, while the opposite applies to dry and cold sites. It is interesting to note that more concretions and plinthic subsoils are to be found along the long north facing slopes of Templer Horne and Swithland at Elands
Heights, even on deeper soils. This would suggest that their air temperatures are relatively high (increased solar radiation), but that they have a lower leaching rate (less precipitation) and are periodically very dry.
The combined effects of lithology, topography and climate find combination expression in soil development. As the rate of weathering increases, soils deepen and become more friable, developing apedal subsoils with uniform red or yellow- brown colour. The accompanying biotic conditions are conducive to higher rates of plant and animal growth, which in turn are reflected in thicker and more organic- rich soils.
Soil forms common to the North East Cape include Inanda, Hutton, Bloemdal, Magwa, Cartref, Nomanci, Kranskop, Clovelly, Glencoe, Glenrosa, Mispah, Longlands, Constantia and Bainsvlei. The Inanda, Magwa and Nomanci forms have humic topsoils with at least 1,8% organic carbon content. These soils constituted 58% of the soils encountered by Herbert (1997), normally indicating a reasonably moist, cool environment. However, the organic carbon content generally only slightly exceeded 2%, which is relatively low in comparison with traditional forestry soils (Herbert, 1997). In the Elands Heights area, the Inanda, Nomanci and Kranskop soil forms are associated with igneous basaltic parent materials, while the Magwa and Clovelly forms are exclusively found on Elliot and Clarens Formation sandstone and mudstones (Herbert, 1999). The Hutton and Mispah soil forms are mostly associated with drier and more sandy site conditions as reflected in their low topsoil organic carbon status. The poorly drained Cartref, Longlands, Constantia, Bainsvlei and Bloemdal soil forms are found in concave
and lower landscape positions and have noticeably more sandy textures (Herbert, 1997). During a study at higher altitude in Elands Heights, Herbert (1999) showed that there are major differences between the basaltic soils prevalent in this area in comparison with the landholdings towards Maclear, Ugie and Elliot where sedimentary soils are prevalent. Herbert (1999) furthermore found that basaltic lithology could be further sub-divided into "normal" and ultra-basic material. The ultra-basic basalt-derived soils have clay textured A and B-horizons, with a marked increase in clay and silt content in the B-horizon i.e. luvic subsoils. The topsoil organic carbon content is very similar to that of "normal" basalt soils, however, their ultra-basic chemistry results in an exchangeable cation content of over 18 cmol(+)/kg clay, i.e. eutrophic. They have a particular high magnesium (Mg) content, even higher than that of calcium (K). The high base status of the basalt soils may also be an indication of relatively young soils with a constant input of fresh weathering material. Available phosphate (P) averages 3 mg/kg in both A and B-horizons (Herbert, 1999).
In contrast, the Clarens and Elliot Formation sandstones and mudstones have sandy clay loam to clay loam textures, often with a slight decrease in clay from A to B horizons. They are invariably dystrophic in the subsoil, with exchangeable cation contents of 4,1 and 2,7 cmol (+)/kg clay respectively. Their low pH reflects low exchangeable calcium content. Their coarser soil texture and occurrence at lower elevations (less precipitation) results in lower topsoil organic carbon (QC) contents averaging about 2,8% (Herbert, 1999).
3.4. Climate 3.4.1. Temperature
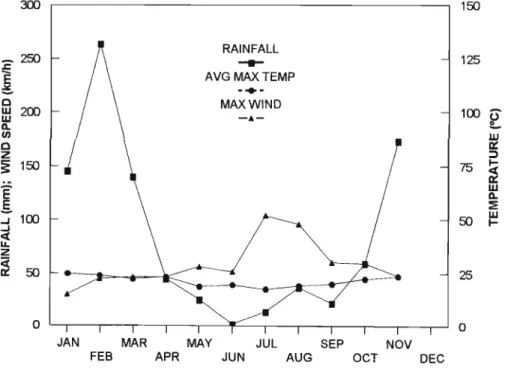
The climate of the study area is warm temperate and is typical of the high elevation summer rainfall areas of South Africa. Summers are warm with regular thunderstorms bringing most of the high annual rainfall while winters are cold and dry with frequent frosts and occasional snowfalls. Figure 3 is an example of the temperature and rainfall occurrence during 1998.
Figure 3. Maximum wind, monthly average maximum temperature and monthly average rainfall occurrence during 1998.
300 , - - - , 150
_ 250
i
Q ltl 200CLIII Q
~Z 150 :;100
~
..Jet
~z
~ 50
RAINFALL
--
AVGMAXTEMP
-+-
MAXWIND
-.-
JAN MAR MAY JUL SEP NOV
FEB APR JUN AUG OCT DEC
125
100 0'
~
25
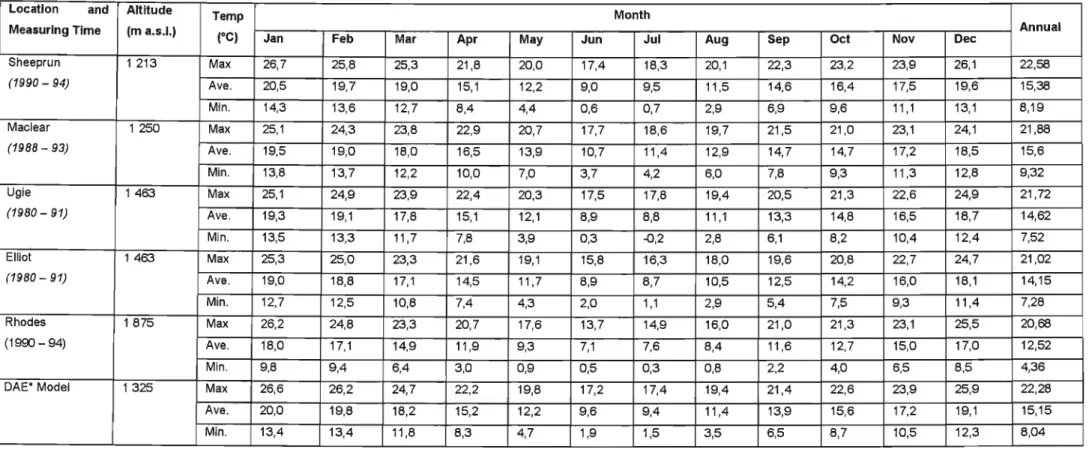
In the study area, temperature recording stations are located at Sheeprun (1 213 m asl.), Maclear (1 250 m asl.), Ugie (1 310 m asl.), Elliot (1 463 m as!.) and Rhodes (1 875 m as!.). Their long term average monthly maxima, means and minima are given in Table 3. The mean annual temperature (MAT) for Maclear is 15,60 °c and that for Elliot 14,15 °c, a difference of 1,45 °C. Their minimum
temperatures for June are 3,70 °C and 2,00 °C respectively, a difference of 1,70 °C, but the maximum January temperature of 25,10 °C in Maclear is 0,20 °C cooler than at Elliot (25,30 CC). Thus it would appear that the temperature regime in Maclear is different to that at Elliot.
From the monthly temperature data it is evident that the warmest month is January and the coolest weather occurs during June and July. Following uniform higher temperatures from December to February, there is a steady change in air temperatures from March to November, with a moderately high annual mean monthly range of 10,30 °C (Elliot) to 11,50 °C (Sheeprun), indicating little moderating coastal influence (Herbert, 1999).
Minute by minute maximum, mean and minimum temperature, generated by the Department of Agricultural Engineering (DAE) at the University of Natal by using altitude and distance from the sea (Schulze and Maharaj, 1994), were compared with the relatively reliable records for Ugie and Elliot by Herbert (1999). These show that the model-generated MAT data appear on average to be 0,60 °C higher.
The average decrease in MAT with altitude of 0,42 °C per 100 m between 1 200 m and 1 500 m is in favourable agreement with the records. Thus the DAE model appears to apply reasonably well to the study area (Herbert, 1999).
The maximum monthly temperature responds somewhat more rapidly to changes in altitude than does the minimum. This tallies with experience in the study area of high day temperatures in the valley bottoms, whereas the· cold nights are more universally accounted for.
Table 3. Records and model-based monthly maximum, mean and minimum temperatures (Herbert 1997).
Location and Altitude Temp Month
Measuring Time (m a.s.!.) Annual
(OC) Jan Feb Mar Apr May Jun Jul Aug Sep Oct Nov Dec
Sheeprun 1 213 Max 26,7 25,8 25,3 21,8 20,0 17,4 18,3 20,1 22,3 23,2 23,9 26,1 22,58
(1990 - 94) Ave. 20,5 19,7 19,0 15,1 12,2 9,0 9,5 11,5 14,6 16,4 17,5 19,6 15,38
Min. 14,3 13,6 12,7 8,4 4,4 0,6 0,7 2,9 6,9 9,6 11,1 13,1 8,19
Maclear 1250 Max 25,1 24,3 23,8 22,9 20,7 17,7 18,6 19,7 21,5 21,0 23,1 24,1 21,88
(1988 - 93) Ave. 19,5 19,0 18,0 16,5 13,9 10,7 11,4 12,9 14,7 14,7 17,2 18,5 15,6
Min. 13,8 13,7 12,2 10,0 7,0 3,7 4,2 6,0 7,8 9,3 11,3 12,8 9,32
Ugie 1463 Max 25,1 24,9 23,9 22,4 20,3 17,5 17,8 19,4 20,5 21,3 22,6 24,9 21,72
(1980 - 91) Ave. 19,3 19,1 17,8 15,1 12,1 8,9 8,8 11 ,1 13,3 14,8 16,5 18,7 14,62
Min. 13,5 13,3 11,7 7,8 3,9 0,3 -0,2 2,8 6,1 8,2 10,4 12,4 7,52
Elliot 1463 Max 25,3 25,0 23,3 21,6 19,1 15,8 16,3 18,0 19,6 20,8 22,7 24,7 21,02
(1980 - 91) Ave. 19,0 18,8 17,1 14,5 11,7 8,9 8,7 10,5 12,5 14,2 16,0 18,1 14,15
Min. 12,7 12,5 10,8 7,4 4,3 2,0 1,1 2,9 5,4 7,5 9,3 11,4 7,28
Rhodes 1875 Max 26,2 24,8 23,3 20,7 17,6 13,7 14,9 16,0 21,0 21,3 23,1 25,5 20,68
(1990- 94) Ave. 18,0 17,1 14,9 11,9 9,3 7,1 7,6 8,4 11,6 12,7 15,0 17,0 12,52
Min. 9,8 9,4 6,4 3,0 0,9 0,5 0,3 0,8 2,2 4,0 6,5 8,5 4,36
DAE* Model 1325 Max 26,6 26,2 24,7 22,2 19,8 17,2 17,4 19,4 21,4 22,6 23,9 25,9 22,28
Ave. 20,0 19,8 18,2 15,2 12,2 9,6 9,4 11,4 13,9 15,6 17,2 19,1 15,15
Min. 13,4 13,4 11,8 8,3 4,7 1,9 1,5 3,5 6,5 8,7 10,5 12,3 8,04
3.4.2. Precipitation
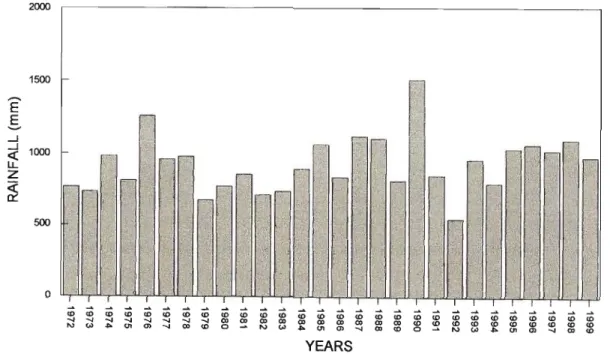
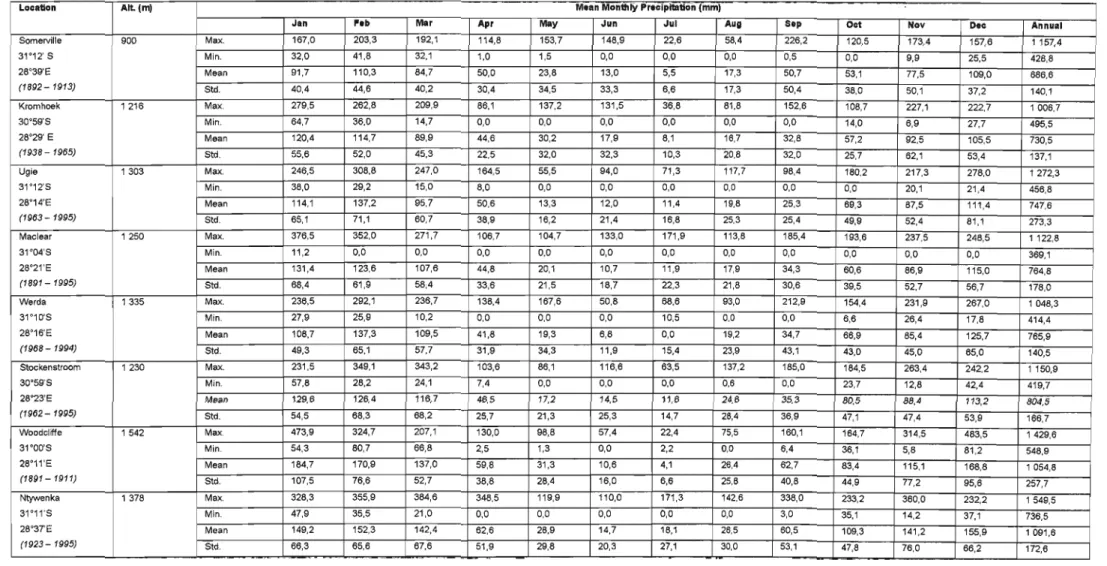
Monthly maximum, mean and minimum precipitation and the standard deviation of the mean are shown in Table 4 for Somerville, Kromhoek, Ugie, Maclear, Werda, Stockenstroom, Woodcliffe and Ntywenka. These weather stations have long term (more than 15 years) and reliable records. They were also selected to show a range of land types, with Ntywenka located on the first major inland escarpment, Somerville on the lower plains before the Drankensberg foothills, Kromhoek, Maclear and Stockenstroom in outer foothills, Ugie and Werda on the plateau beneath the Drakensberg escarpment and Woodcliffe at the higher foothills of the Drakensberg range. Figure 4 reflects the long term rainfall from 1972 - 1999 for the region.
Figure 4. Annual rainfall for the north-eastern part of the Eastern Cape Province.
2000 r - - - ,
1500
E
E-
500 ...J
~ 1000
Z
~
to to <0 <0 <0 <0 to to <0 <0 to to to to <0 <0 <0 <0 <0 <0 <0 <0 <0 <0 <0 <0 to to ..., ..., ..., ..., ..., ..., ..., ..., CD CD CD CD CD CD CD CD CD CD to to ID to to to to to to to
'" to .... 01 CD ..., CD to 0
-
'" to .... 01 CD ..., CD to 0-
'" to .... 01 CD ..., CD toYEARS
In Maclear, a variation in annual precipitation was studied by Herbert (1999). The outstanding feature was the variation from year to year. The annual precipitation
has varied by 753,7 mm, and ranged from 369,1 mm to 1 122,8 mm (99% of MAP), and the standard deviation of MAP was 178,0 mm about the mean of 764,8 mm.
The distribution of average monthly precipitation for Ntywenka, Somerville, Maclear, Werda and Kilmeny (similar to Woodcliffe, but a longer recording period) showed that there were three types of sites in terms of precipitation amount and distribution, (i) on the high escarpment (Ntywenka, Kilmeny, Woodcliffe), (H) on the foothills of the Drakensberg (Maclear, Stockenstroom) and (iii) on the plateau adjacent to the Drakensberg (Werda, Somerville, Ugie). Rainfall on the plateau below the escarpment peaks in November and February with a drop in January.
In contrast, sites closer to the major escarpments have a clear peak of precipitation in January. Precipitation on the high (south-facing) escarpments is the greatest of all sites in any month, but is most markedly so between October and March when some 82% of annual precipitation falls. Maclear, Werda, Ugie and Stockenstroom also receive almost identical percentages (82%) of rain in these months, but the drier areas such as Somerville and Kromhoek receive only 77% and 69% of their precipitation in summer (Herbert, 1999).
Except where MAP is close to 1 100 mm, less than 50 mm of rain falls in any of the six winter months with under 25 mm per month between May and August.
There is thus a regular and marked winter drought in nearly all areas. An occurrence of no rainfall has been recorded at Maclear for every month except January (wettest month). Good rains start only after September (Herbert, 1999).
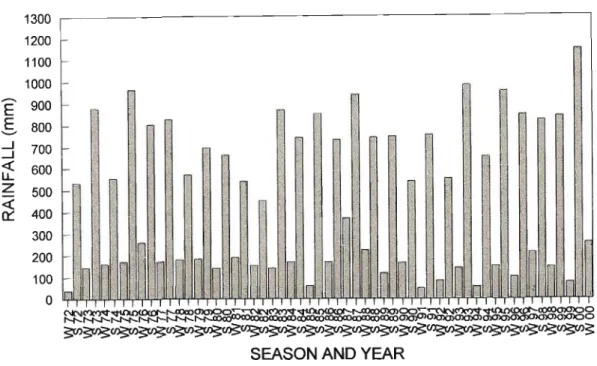
Figure 5 illustrates the seasonal change in precipitation from 1972 to 2000.
Figure 5. Seasonal rainfall for the north-eastern part of the Eastern Cape Province (w
=
April - September; s=
October - March)1300 1200
1100 1
1000 i~
... '~ ~ m
E 900 ~, ~:~ ~
E 800 m l\r
~ ~ ~ ~~
,
...- I~
...J 700 ~l14 ~~
~
i ~I
~1 ~ ~ ~~...J ~ ~~ {\ W ~i~ ~ ~~ '~ t~
«
600 ~ lIi(\.\ ~ jl ~ :t< ~ ;''''~ .tI
:i'i , 1;LL. '~ '~ f1 ~ r l .,! ~ !f!. t ~'
z
500 l{\' ~ ~ ;~ ~i
,~ J'~ ~ ~ '1 'J. v'«
'I!,
~ ~ M, ~' '"I
""~ If 'A ~0:: 400300 ~ \f~ ,,'." " ~ !] 'i~J; iiI'~
200 100 0
~~~~~~~~g
?P>~~~~~~~~~~~Cli?Jn3:
SEASON AND YEAR
Table 4 shows that high monthly precipitation may occur, with 367,5 mm being recorded in January at Maclear, 483,5 mm in December at Woodcliffe and 384,6 mm at Ntywenka in March. These heavy rainfalls will reduce the effectiveness of rainfall due to surface runoff as well as increasing the soil erosion hazard, especially on steep slopes with sandy soils, however, they are not as disastrous as those recorded following cyclonic events in KwaZulu Natal and Mpumalanga (Herbert, 1999).
The records show that precipitation tends to increase with altitude. Low elevation areas, further from the escarpment (e.g. Somerton) have a MAP of about 660 mm.
This falls mainly in the form of thundershowers and cold front rains and is not overly influenced by topography. Precipitation also generally decreases with
distance from the coast and from the leading southern crest of the escarpment.
These phenomena are related to the fact that moist air tends to be directed inland mainly from the south and south-east, and is accordingly intercepted as orographic rainfall and mists by escarpments facing into this direction of air mass movement.
Precipitation thus decreases on the northern side of escarpments where the topography drops away, especially where there is no high ground immediately to the northwest, however, close to the Drakensberg there is less of an influence of broken topography on precipitation as clouds and mist tend to over-hang the southern aspects of the escarpment and cause widespread rain and drizzle (Herbert, 1999).
Table 4. Average monthly maximum, mean and minimum precipitation (Forsyth et al., 1996).
Location Alt.(m) Mean Monthly Precipitation (mml
Jan feb Mar Apr May Jun Jul AUlI Sep Oct Nov Dac Annual
Somerville 900 Max. 167,0 203,3 192,1 114,8 153,7 148,9 22,6 58,4 226,2 120,5 173,4 157,6 1157,4
31'12' S Min. 32,0 41,8 32,1 1,0 1,5 0,0 0,0 0,0 0,5 0,0 9,9 25,5 428,8
28'39'E Mean 91,7 110,3 84,7 SO,O 23,8 13,0 5,5 17,3 50,7 53,1 77,5 109,0 686,6
(1892 - 1913) Std. 40,4 44,6 40,2 30,4 34,5 33,3 6,6 17,3 50,4 38,0 50,1 37,2 140,1
Kromhoek 1216 Max. 279,5 262,8 209,9 86,1 137,2 131,5 36,8 81,8 152,6 108,7 227,1 222,7 1 006,7
30'59'S Min. 64,7 36,0 14,7 0,0 0,0 0,0 0,0 0,0 0,0 14,0 6,9 27,7 495,5
28'29' E Mean 120,4 114,7 89,9 44,6 30,2 17,9 8,1 16,7 32,8 57,2 92,5 105,5 730,5
(1938 - 1965) Std. 55,6 52,0 45,3 22,5 32,0 32,3 10,3 20,8 32,0 25,7 62,1 53,4 137,1
Ugie 1303 Max. 246,5 308,8 247,0 164,5 55,5 94,0 71,3 117,7 98,4 180,2 217,3 278,0 1272,3
31'12'S Min. 38,0 29,2 15,0 8,0 0,0 0,0 0,0 0,0 0,0 0,0 20,1 21,4 456,8
28'14'E Mean 114,1 137,2 95,7 50,6 13,3 12,0 11,4 19,8 25,3 69,3 87,5 111,4 747,6
(1963- 1995) Std. 65,1 71,1 60,7 38,9 16,2 21,4 16,8 25,3 25,4 49,9 52,4 81,1 273,3
Maclear 1250 Max. 376,5 352,0 271,7 106,7 104,7 133,0 171,9 113,8 185,4 193,6 237,5 248,5 1122,8
31'04'S Min. 11,2 0,0 0,0 0,0 0,0 0,0 0,0 0,0 0,0 0,0 0,0 0,0 369,1
28'21'E Mean 131,4 123,6 107,6 44,8 20,1 10,7 11,9 17,9 34,3 60,6 86,9 115,0 764,8
(1891 - 1995) Std. 68,4 61,9 56,4 33,6 21,5 18,7 22,3 21,8 30,6 39,5 52,7 56,7 178,0
Werda 1335 Max. 236,5 292,1 236,7 138,4 167,6 50,8 68,6 93,0 212,9 154,4 231,9 267,0 1 048,3
31 '1 O'S Min. 27,9 25,9 10,2 0,0 0,0 0,0 10,5 0,0 0,0 6,6 26,4 17,8 414,4
28'16'E Mean 108,7 137,3 109,5 41,8 19,3 6,8 0,0 19,2 34,7 66,9 85,4 125,7 765,9
(1968 - 1994) Std. 49,3 65,1 57,7 31,9 34,3 11,9 15,4 23,9 43,1 43,0 45,0 65,0 140,5
Stockenstroom 1230 Max. 231,5 349,1 343,2 103,6 86,1 116,6 63,5 137,2 185,0 184,5 263,4 242,2 1150,9
30'59'S Min. 57,8 28,2 24,1 7,4 0,0 0,0 0,0 0,6 0,0 23,7 12,8 42,4 419,7
28'23'E Mean 129,6 126,4 116,7 46,5 17,2 14,5 11,6 24,6 35,3 80,5 88,4 113,2 804,5
(1962 - 1995) Std. 54,5 68,3 68,2 25,7 21,3 25,3 14,7 28,4 36,9 47,1 47,4 53,9 166,7
Woodclrrfe 1542 Max. 473,9 324,7 207,1 130,0 98,8 57,4 22,4 75,5 160,1 164,7 314,5 483,5 1429,6
31'OO'S Min. 54,3 80,7 66,8 2,5 1,3 0,0 2,2 0,0 6,4 36,1 5,8 81,2 548,9
28'11'E Mean 184,7 170,9 137,0 59,8 31,3 10,6 4,1 26,4 62,7 83,4 115,1 168,8 1054,8
(1891- 1911) Std. 107,5 76,6 52,7 38,8 28,4 16,0 6,6 25,8 40,8 44,9 77,2 95,6 257,7
Ntywenka 1378 Max. 328,3 355,9 364,6 348,5 119,9 110,0 171,3 142,6 338,0 233,2 360,0 232,2 1 549,5
31'11'S Min. 47,9 35,5 21,0 0,0 0,0 0,0 0,0 0,0 3,0 35,1 14,2 37,1 736,5
28'3TE Mean 149,2 152,3 142,4 62,6 28,9 14,7 18,1 26,5 60,5 109,3 141,2 155,9 1091,6
(1923 - 1995) Std. 66,3 65,6 67,6 51,9 29,8 20,3 27,1 30,0 53,1 47,8 76,0 66,2 172,6