Health Risk of Growing and Consuming Vegetables Using Greywater for Irrigation
By
SIOBHAN ANN FORBES JACKSON
Submitted in fulfilment of the academic Requirements for the degree of
Master of Science in the School of Biological &
Conservation Sciences.
University of KwaZulu-Natal Durban
Oct 2010 As the candidate’s supervisor I have/have not approved this dissertation for submission.
Signed:... Name:... Date:...
Signed:... Name:... Date:...
ABSTRACT
Two of the challenges facing Africa in the 21st Century are effective use of restricted water resources and ensuring food security especially for poor communities. In line with these aims, the eThekwini municipality has introduced a multi-tier system of water supply ranging from full pressure reticulated systems along with flush toilets to standpipes and dry toilet systems. In the latter case, it was soon recognized that the disposal of greywater presented a problem.
Bearing in mind that South Africa is already a water scarce region, research was initiated into finding means of using this water as a resource rather than as a waste. Initial on-site trials using the greywater to irrigate crops proved popular and it was then regarded as necessary to test the possible health effects on the communities of such a system.
A controlled field trial using pot plantings of a selected range of edible vegetables was initiated at the University of KwaZulu-Natal. Crops were tested both internally and externally for a range of indicator and potentially pathogenic organisms. Quantitative Microbial Risk Assessment (QMRA) techniques were used to assess the health risk to communities from growing and eating the greywater- irrigated vegetables. Although there was a health risk related to most of the activities, especially the handling of the greywater itself, the risks could be brought within the World Health Organisation guidelines of less than one case of disease per 10 000 people per year by the implementation of simple barrier interventions. The greywater irrigated crops themselves, did not present a statistically higher risk of infection than the crops irrigated with either hydroponic solution or tap water. These findings show the importance of applying QMRA to each case to determine health risk. This would allow the productive use of greywater and other water sources in the correct circumstances, thus providing food sustainability for people who currently do not have access to the levels of high purity water currently recommended for agriculture.
PREFACE
The experimental work described in this dissertation was carried out at the laboratories of eThekwini Water and Sanitation Scientific Services, Durban from November 2004 to December 2009, under the supervision of Dr N. Rodda and Dr D. Muir.
These studies represent original work by the author and have not otherwise been submitted in any form for any degree or diploma to any tertiary institution. Where use has been made of the work of others it is duly acknowledged in the text.
DECLARATION 1 – PLAGIARISM
I, Siobhan Ann Forbes Jackson declare that
1. The research reported in this dissertation, except where otherwise indicated, is my original research.
2. This dissertation has not been submitted for any degree or examination at any other university.
3. This dissertation does not contain other persons’ data, pictures, graphs or other information, unless specifically acknowledged as being sourced from other persons.
4. This dissertation does not contain any other person’s writing, unless specifically acknowledged as being sourced from other researchers. Where other written sources have been quoted, then:
a. Their words have been re-written but the general information attributed to them has been referenced
b. Where their exact words have been used, then their writing has been placed in italics and inside quotation marks and referenced.
5. This dissertation does not contain text, graphics or tables copied and pasted from the Internet, unless specifically acknowledged, and the source being detailed in the dissertation and in the Reference sections.
Signed: ...
DECLARATION 2 – PUBLICATIONS
DETAILS OF THE CONTRIBUTION TO PUBLICATIONS that form part and/or include research presented in this dissertation
Salukazana, L., Jackson, S., Rodda, N., Smith, M., Gounden, T., Macleod, N. and Buckley, C.
(2005). Plant growth and microbiological safety of plants irrigated with greywater. Paper presented at the 3rd International Conference on Ecological Sanitation, 23-26 May, Durban.
Jackson, S., Rodda, N., Salukazana, S. and Macleod, N. (2006). Microbiological assessment of food crops irrigated with domestic greywater. Paper presented at the biennial conference of the Water Institute of South Africa, 21-25 May, Durban.
Jackson, S., Rodda, N and Salukuzana, L. (2006). Microbiological assessment of food crops irrigated with domestic greywater. Water SA 32(5) pp. 700-704
Jackson, S., Muir, D. and Rodda, N. (2010). Use of domestic greywater for small-scale irrigation of food crops: health risks. 11th Waternet/WARFSA/ Symposium
TABLE OF CONTENTS
ABSTRACT ... i
PREFACE... ii
DECLARATION 1 – PLAGIARISM ... iii
DECLARATION 2 – PUBLICATIONS ... iv
FIGURES... ix
TABLES ... xvii
ACKNOWLEDGEMENTS... xxv
DEDICATION ... xxvi
LIST OF ABREVIATIONS ... xxvii
1. INTRODUCTION ... 1
1.1 Study context ... 1
1.2 Greywater ... 5
1.3 Drivers for re-use ... 5
1.4 Guidelines for re-use in terms of health impact ... 8
1.5 Environmental impacts ... 9
1.6 Greywater re-use ... 10
1.6.1 Benefits of greywater re-use ... 10
1.6.2 Quality of greywater / wastewater irrigated produce... 11
1.7 Health risk assessment... 12
1.7.1 Hazard identification ... 13
1.7.2 Dose response assessment... 15
1.7.3 Exposure assessment ... 20
1.8 Exposure routes... 23
1.8.1 Parameters required for modelling ... 24
1.8.2 Risk characterisation ... 25
1.9 Research question and hypotheses ... 26
1.10 Aims ... 26
1.11 Delineations and limitations ... 27
1.12 Outline of dissertation ... 27
2. METHODS ... 29
2.1 Experimental setup ... 29
2.1.1 Site selection ... 29
2.2 Greywater characterisation ... 30
2.3 Crop selection, setup and harvesting ... 31
2.4 Microbial analysis ... 33
2.4.1 Selection of faecal indicators / pathogens to be monitored ... 33
2.4.2 Microbiological analyses ... 34
2.4.3 Analysis limitations ... 35
2.5 Statistical analysis ... 35
2.6 Health risk assessment... 36
3. RESULTS ... 41
3.1 Factors contributing to microbiological quality of crops ... 41
3.1.1 Rainfall ... 41
3.1.2 Soil microbiology and chemistry ... 42
3.1.3 Greywater... 43
3.2 Microbiological quality of above-ground crops ... 45
3.2.1 Swiss chard ... 45
3.2.2 Green peppers ... 49
3.2.3 Chillies ... 53
3.3 Microbiological quality of below-ground crops ... 54
3.3.1 Beetroot ... 54
3.3.2 Potato ... 58
3.3.3 Onion ... 60
3.3.4 Carrots ... 63
3.4 Risk assessment ... 66
3.4.1 Greywater... 70
3.4.2 Soil ... 71
3.4.3 Risk of infection from consuming above ground crops ... 72
3.4.3.1 Swiss chard ... 72
3.4.3.2 Green peppers ... 75
3.4.3.3 Chillies ... 77
3.4.4 Risk of infection from consuming below-ground crops ... 78
3.4.4.1 Beetroot ... 78
3.4.4.2 Potato ... 81
3.4.4.3 Onions ... 83
3.4.4.4 Carrots... 86
4. DISCUSSION... 89
4.1 Irrigation water ... 89
4.2 Soil ... 90
4.3 Above-ground crops ... 91
4.3.1 Swiss chard ... 91
4.3.2 Green peppers ... 91
4.3.3 Chillies ... 92
4.4 Below-ground crops ... 92
4.4.1 Beetroot ... 92
4.4.2 Potato ... 93
4.4.3 Onions ... 93
4.4.4 Carrots ... 94
4.5 Overall assessment of health risk ... 94
5. CONCLUSIONS AND RECOMMENDATIONS ... 100
6. REFERENCES ... 103
7. APPENDIX 1 ... 111
7.1 Detection and enumeration of helminth ova ... 111
7.2 Detection and enumeration of Escherichia coli and total coliforms on Chromocult agar ... 116
7.3 Detection and enumeration of Enterococcus on Enterococcus selective agar ... 123
7.4 Detection and enumeration of Pseudomonas species ... 129
7.5 Detection of Salmonella or Shigella sp. ... 133
7.6 Detection and enumeration of Staphylococcus ... 142
7.7 Detection and enumeration of somatic coliphage ... 147
7.8 Ringers Solution... 151
8. APPENDIX 2 ... 152
FIGURES
Figure 1.1: Photograph taken by eThekwini staff of surface disposal of greywater leading to
poor sanitary conditions. ... 3
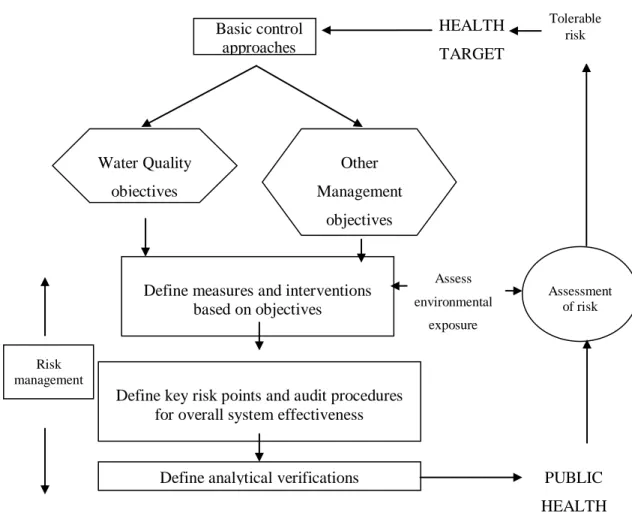
Figure 1.2: Flowchart of risk management adapted from WHO, 2006a... 9
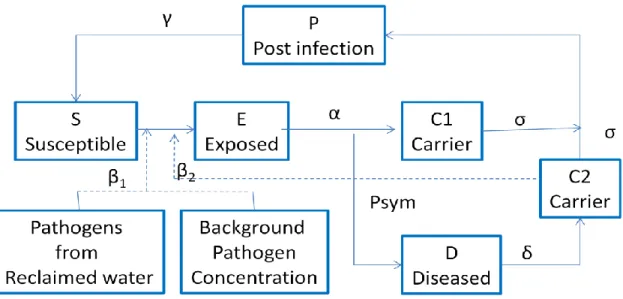
Figure 1.3: Dynamic risk assessment conceptual model from Roesner et al., 2006 ... 17
Figure 1.4: Static risk assessment model from Roesner et al., 2006 ... 18
Figure 1.5: Graphical summary of model evaluation from Soller, 2006 ... 19
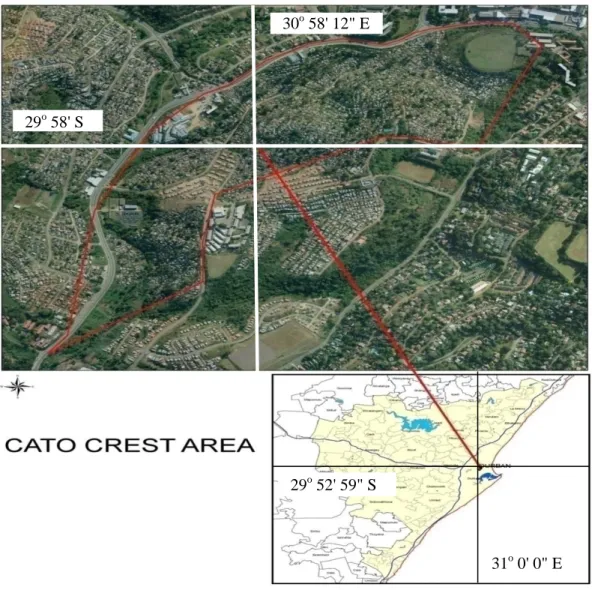
Figure 2.1: Location of the Cato Crest sampling site. (eThekwini Water and Sanitation, GIS Department) ... 29
Figure 2.2: 200L potable water ground tank ... 30
Figure 2.3: Greywater storage tanks at pilot site ... 30
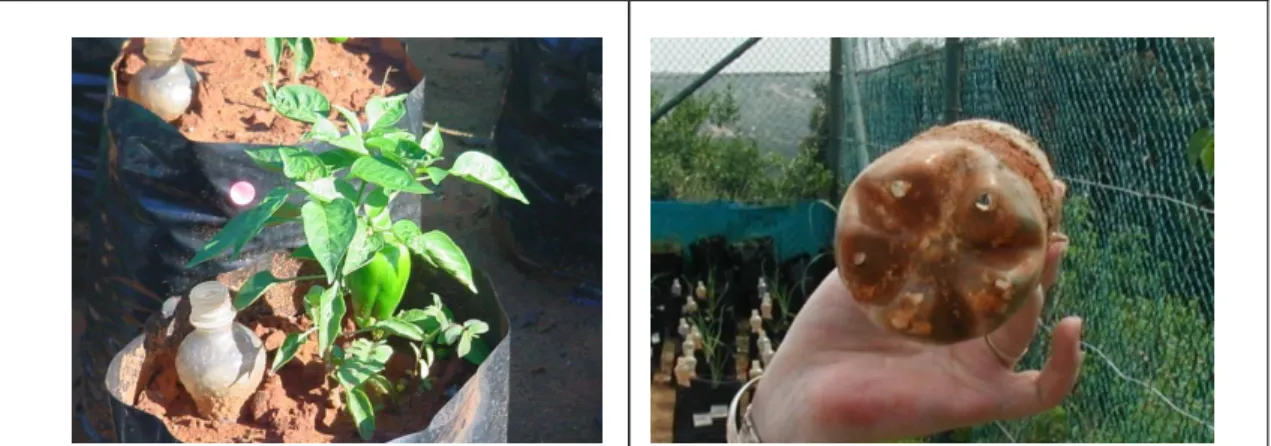
Figure 2.4: Example of the technique used to provide sub-surface irrigation of crops using a perforated 500 mL plastic bottle ... 32
Figure 2.5: Example of perforated bottle used to deliver irrigation sub-surface ... 32
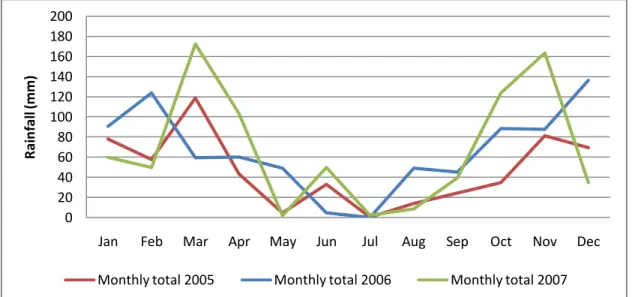
Figure 3.1: Rainfall during the period January 2005 to December 2007 measured at the Botanic Gardens, Durban. Average monthly rainfall over the three year period showed no statistical difference among equivalent months (p=0.05), but the overall rainfall in 2007 was statistically greater (p=0.05, n=2334) than that for 2005 (n=1899) and 2006 (n=2907). Seasonal variation is clearly indicated. Supplied by eThekwini Parks, Recreation and Culture Department. ... 41
Figure 3.2: Box and whisker plot of E. coli counts on external surfaces (ext) or the interior (int) of Swiss chard plants irrigated with greywater (G), hydroponic solution (H), tap water (T) or purchased commercially (C). Results are based on all samples taken over the complete trial period. No statistical difference was found between the three water treatments for either the internal or external sets when tested using the Kruskal-Wallis test (p=0.05) ... 47 Figure 3.3: Box and whisker plot of Enterococcus counts on external surfaces (ext) or the interior (int) of Swiss chard plants irrigated with greywater (G), hydroponic solution (H), tap
water (T) or purchased commercially (C). Results are based on all samples taken over the complete trial period. No statistical difference was found between the three water treatments for either the internal or external sets when tested using the Kruskal-Wallis test (p=0.05) ... 47 Figure 3.4: Box and whisker plot of Staphylococcus counts on external surfaces (ext) or the interior (int) of Swiss chard plants irrigated with greywater (G), hydroponic solution (H), tap water (T) or purchased commercially (C). Results are based on all samples taken over the complete trial period. No statistical difference was found between the three water treatments for either the internal or external sets when tested using the Kruskal-Wallis test (p=0.05) ... 48 Figure 3.5: Box and whisker plot of total coliform counts on external surfaces (ext) or the interior (int) of Swiss chard plants irrigated with greywater (G), hydroponic solution (H), tap water (T) or purchased commercially (C). Results are based on all samples taken over the complete trial period. No statistical difference was found between the three water treatments for either the internal or external sets when tested using the Kruskal-Wallis test (p=0.05) ... 48 Figure 3.6: Examples of the green pepper crop showing the stunting of the tap water irrigated crop. Courtesy L. Salukazana... 50 Figure 3.7: Box and whisker plot of E. coli counts on external surfaces (ext) or the interior (int) of green pepper fruits irrigated with greywater (G), hydroponic solution (H), tap water (T) or purchased commercially (C). Results are based on all samples taken over the complete trial period. No statistical difference was found between the three water treatments for either the internal or external sets when tested using the Kruskal-Wallis test (p=0.05) ... 51 Figure 3.8: Box and whisker plot of Staphylococcus counts on external surfaces (ext) or the interior (int) of green pepper fruits irrigated with greywater (G), hydroponic solution (H), tap water (T) or purchased commercially (C). Results are based on all samples taken over the complete trial period. No statistical difference was found between the three water treatments for either the internal or external sets when tested using the Kruskal-Wallis test (p=0.05) ... 52 Figure 3.9: Box and whisker plot of total coliform counts on external surfaces (ext) or the interior (int) of green pepper fruits irrigated with greywater (G), hydroponic solution (H), tap water (T) or purchased commercially (C). Results are based on all samples taken over the complete trial period. No statistical difference was found between the three water treatments for either the internal or external sets when tested using the Kruskal-Wallis test (p=0.05) ... 52 Figure 3.10: Box and whisker plot of total coliform counts on external surfaces (ext) or the interior (int) of chillies irrigated with greywater (G), hydroponic solution (H) or purchased
commercially (C). Results are based on one growing season. No statistical difference was found between the treatments for either the internal or external sets when tested using the Kruskal-Wallis test (p=0.05) ... 54 Figure 3.11: Examples of tap water irrigated beetroot plants showing stunting of growth ... 55 Figure 3.12: Box and whisker plot of E. coli counts on external surfaces (ext) or the interior (int) of beetroot irrigated with greywater (G), hydroponic solution (H), tap water (T) or purchased commercially (C). Results are based on all samples taken over the complete trial period. No statistical difference was found between the treatments for either the internal or external sets when tested using the Kruskal-Wallis test (p=0.05) ... 56 Figure 3.13: Box and whisker plot of Enterococcus counts on external surfaces (ext) or the interior (int) of beetroot irrigated with greywater (G), hydroponic solution (H), tap water (T) or purchased commercially (C). Results are based on all samples taken over the complete trial period. No statistical difference was found between the treatments for either the internal or external sets when tested using the Kruskal-Wallis test (p=0.05) ... 56 Figure 3.14: Box and whisker plot of Staphylococcus counts on external surfaces (ext) or the interior (int) of beetroot irrigated with greywater (G), hydroponic solution (H), tap water (T) or purchased commercially (C). Results are based on all samples taken over the complete trial period. No statistical difference was found between the treatments for either the internal or external sets when tested using the Kruskal-Wallis test (p=0.05) ... 57 Figure 3.15: Box and whisker plot of total coliform counts on external surfaces (ext) or the interior (int) of beetroot irrigated with greywater (G), hydroponic solution (H), tap water (T) or purchased commercially (C). Results are based on all samples taken over the complete trial period. No statistical difference was found between the treatments for either the internal or external sets when tested using the Kruskal-Wallis test (p=0.05) ... 57 Figure 3.16: Box and whisker plot of Staphylococcus counts on external surfaces (ext) or the interior (int) of potatoes irrigated with greywater (G), hydroponic solution (H), tap water (T) or purchased commercially (C). Results are based on all samples taken over the complete trial period. No statistical difference was found between the treatments for either the internal or external sets when tested using the Kruskal-Wallis test (p=0.05) ... 59 Figure: 3.17: Box and whisker plot of total coliform counts on external surfaces (ext) or the interior (int) of potatoes irrigated with greywater (G), hydroponic solution (H), tap water (T) or purchased commercially (C). Results are based on all samples taken over the complete trial
period. No statistical difference was found between the treatments for either the internal or external sets when tested using the Kruskal-Wallis test (p=0.05) ... 59 Figure 3.18: Example of onion grown with greywater sub-surface irrigation at the UKZN test site ... 60 Figure 3.19: Box and whisker plot of E. coli counts on external surfaces (ext) or the interior (int) of onions irrigated with greywater (G), hydroponic solution (H), tap water (T) or purchased commercially (C). Results are based on all samples taken over the complete trial period. No statistical difference was found between the treatments for either the internal or external sets when tested using the Kruskal-Wallis test (p=0.05) ... 61 Figure 3.20: Box and whisker plot of Enterococcus counts on external surfaces (ext) or the interior (int) of onions irrigated with greywater (G), hydroponic solution (H), tap water (T) or purchased commercially (C). Results are based on all samples taken over the complete trial period. No statistical difference was found between the treatments for either the internal or external sets when tested using the Kruskal-Wallis test (p=0.05) ... 62 Figure 3.21: Box and whisker plot of Staphylococcus counts on external surfaces (ext) or the interior (int) of onions irrigated with greywater (G), hydroponic solution (H), tap water (T) or purchased commercially (C). Results are based on all samples taken over the complete trial period. No statistical difference was found between the treatments for either the internal or external sets when tested using the Kruskal-Wallis test (p=0.05) ... 62 Figure 3.22: Box and whisker plot of total coliform counts on external surfaces (ext) or the interior (int) of onions irrigated with greywater (G), hydroponic solution (H), tap water (T) or purchased commercially (C). Results are based on all samples taken over the complete trial period. No statistical difference was found between the treatments for either the internal or external sets when tested using the Kruskal-Wallis test (p=0.05) ... 63 Figure 3.23: Box and whisker plot of E. coli counts on external surfaces (ext) or the interior (int) of carrots irrigated with greywater (G), hydroponic solution (H), tap water (T) or purchased commercially (C). Results are based on all samples taken over the complete trial period. No statistical difference was found between the treatments for either the internal or external sets when tested using the Kruskal-Wallis test (p=0.05) ... 64 Figure 3.24: Box and whisker plot of Enterococcus counts on external surfaces (ext) or the interior (int) of carrots irrigated with greywater (G), hydroponic solution (H), tap water (T) or purchased commercially (C). Results are based on all samples taken over the complete trial
period. No statistical difference was found between the treatments for either the internal or external sets when tested using the Kruskal-Wallis test (p=0.05) ... 65 Figure 3.25: Box and whisker plot of Staphylococcus counts on external surfaces (ext) or the interior (int) of carrots irrigated with greywater (G), hydroponic solution (H), tap water (T) or purchased commercially (C). Results are based on all samples taken over the complete trial period. No statistical difference was found between the treatments for either the internal or external sets when tested using the Kruskal-Wallis test (p=0.05) ... 65 Figure 3.26: Box and whisker plot of total coliform counts on external surfaces (ext) or the interior (int) of carrots irrigated with greywater (G), hydroponic solution (H), tap water (T) or purchased commercially (C). Results are based on all samples taken over the complete trial period. No statistical difference was found between the treatments for either the internal or external sets when tested using the Kruskal-Wallis test (p=0.05) ... 66 Figure 3.27: Example of a best-fit distribution fitted to the E. coli data for Swiss chard irrigated subsurface with greywater. All data throughout the trial was used. The 95th percentile is indicated. ... 67 Figure 3.28: Distribution of the probability of infection based on the load of E. coli on Swiss chard for daily consumption of the vegetable. The following were used in the calculation α=- 0.126, β=42.86, d=distribution fitted to the untransformed data by @RISK. This data comprised an estimated daily consumption of the crop = 9.2g, the percentage of the population consuming the crop = 27.4%, estimated ration of indicator to pathogen = 0.01. The mode and 95th percentiles are indicated ... 68 Figure 3.29: Example of the annual risk based on the loading of E. coli on Swiss chard irrigated subsurface with greywater. The following were used in the calculation α=-0.126, β=42.86, d=distribution fitted to the untransformed data by @RISK. This data comprised an estimated daily consumption of the crop = 9.2g, the percentage of the population consuming the crop = 27.4%, estimated ration of indicator to pathogen = 0.01 and n=365. No risk mitigating factors were modelled. The mode and 95th percentiles are indicated ... 69 Figure 3.30: Example of the annual risk based on the loading of E. coli on Swiss chard irrigated subsurface with greywater and cooked before consumption. The following were used in the calculation α=-0.126, β=42.86, d=distribution fitted to the untransformed data by @RISK. This data comprised an estimated daily consumption of the crop = 9.2g, the percentage of the
population consuming the crop = 27.4%, estimated ratio of indicator to pathogen = 0.01, n=365 and risk mitigation factor=6 log. The mode and 95th percentiles are indicated... 70 Figure 3.31: Box-and-whisker plots of the annual probability of infection from the consumption of Swiss chard irrigated with greywater (G), hydroponic solution (H), or tap water (T) or purchased commercially (C). The following were used in the calculation α=-0.126, β=42.86, d=distribution fitted to the untransformed data by @RISK. This data comprised an estimated daily consumption of the crop = 9.2g, the percentage of the population consuming the crop = 27.4% (Nel and Steyn (2000), estimated ratio of indicator to pathogen = 0.001 for E. coli, 1 for Enterococcus, 0.001 for Staphylococcus and 0.0001 for total coliforms 0.01, n=365 . No significant difference (p=0.05) was found between the treatments. The risk was brought within the acceptable level of <1 in 10 000 by implementing mitigation measures resulting in a 5-log reduction of microbial load. The vertical line indicates the range, the box the 5th to 95th percentile and the mode is indicated by the numeric value. ... 73 Figure 3.32:Box-and-whisker plots of the annual probability of infection from the consumption of green peppers irrigated with greywater (G), hydroponic solution (H), or tap water (T) or purchased commercially (C). The following were used in the calculation α=-0.126, β=42.86, d=distribution fitted to the untransformed data by @RISK. This data comprised an estimated daily consumption of the crop = 2.5g, the percentage of the population consuming the crop = 12.5%, estimated ratio of indicator to pathogen = 0.001 for E. coli, 1 for Enterococcus, 0.001 for Staphylococcus and 0.0001 for total coliforms 0.01, n=365 and risk mitigation factor=6 log and this risk was brought within the acceptable level of <1 in 10 000 by implementing mitigation measures resulting in a 5-log reduction of microbial load. The vertical line indicates the range, the box the 5th to 95th percentile and the mode is indicated by the numeric value. ... 76 Figure 3.33: Box-and-whisker plots of the annual probability of from the consumption of chillies irrigated with greywater (G) or hydroponic solution (H). The following were used in the calculation α=-0.126, β=42.86, d=distribution fitted to the untransformed data by @RISK.
This data comprised an estimated daily consumption of the crop =0.6 g, the percentage of the population consuming the crop = 12.8% (Nel and Steyn (2000), estimated ratio of indicator to pathogen = 0.0001 for total coliforms, n=365 . No significant difference was found (p=0.05) for the risk presented by each of the three treatments and this risk was within the acceptable level of <1 in 10 000 even before implementation of mitigation measures.The vertical line indicates the range, the box the 5th to 95th percentile and the mode is indicated by the numeric value. ... 78
Figure 3.34: Box-and-whisker plots of the annual probability of from the consumption of beetroot irrigated with greywater (G), hydroponic solution (H), or tap water (T) or purchased commercially (C). The following were used in the calculation α=-0.126, β=42.86, d=distribution fitted to the untransformed data by @RISK. This data comprised an estimated daily consumption of the crop =3.9 g, the percentage of the population consuming the crop = 12.8% (Nel and Steyn (2000), estimated ratio of indicator to pathogen = 0.001 for E. coli, 1 for Enterococcus, 0.001 for Staphylococcus and 0.0001 for total coliforms, n=365 . No significant difference was found (p=0.05) for the risk presented by each of the three treatments and this risk was mainly brought within the acceptable level of <1 in 10 000 by implementing mitigation measures resulting in a 5-log reduction of microbial load. The vertical line indicates the range, the box the 5th to 95th percentile and the mode is indicated by the numeric value. The maximum risk based on total coliform concentration is boxed adjacent to the whisker for this treatment ... 80 Figure 3.35: Box-and-whisker plots of the annual probability of from the consumption of potato irrigated with greywater (G), hydroponic solution (H), tap water (T) or purchased commercially (C). The following were used in the calculation α=-0.126, β=42.86, d=distribution fitted to the untransformed data by @RISK. This data comprised an estimated daily consumption of the crop =45.4 g, the percentage of the population consuming the crop = 27.1% (Nel and Steyn (2000), estimated ratio of indicator to pathogen = 0.001 for E. coli, 1 for Enterococcus, 0.001 for Staphylococcus and 0.0001 for total coliforms, n=365 . No significant difference was found (p=0.05) for the risk presented by each of the three treatments and this risk was mainly brought within the acceptable level of <1 in 10 000 by implementing mitigation measures resulting in a 5-log reduction of microbial load. ... 82 Figure 3.36: Box-and-whisker plots of the annual probability of from the consumption of onion irrigated with greywater (G), hydroponic solution (H), or tap water (T) or purchased commercially (C). The following were used in the calculation α=-0.126, β=42.86, d=distribution fitted to the untransformed data by @RISK. This data comprised an estimated daily consumption of the crop =2.5 g, the percentage of the population consuming the crop = 12.8% (Nel and Steyn (2000), estimated ratio of indicator to pathogen = 0.001 for E. coli, 1 for Enterococcus, 0.001 for Staphylococcus and 0.0001 for total coliforms, n=365 . No significant difference was found (p=0.05) for the risk presented by each of the three treatments and this risk was brought within the acceptable level of <1 in 10 000 by implementing mitigation measures resulting in a 5-log reduction of microbial load. The vertical line indicates the range, the box the 5th to 95th percentile and the mode is indicated by the numeric value. ... 85
Figure 3.37: Box-and-whisker plots of the annual probability of from the consumption of carrots irrigated with greywater (G), hydroponic solution (H), or tap water (T) or purchased commercially (C). The following were used in the calculation α=-0.126, β=42.86, d=distribution fitted to the untransformed data by @RISK. This data comprised an estimated daily consumption of the crop =3.9 g, the percentage of the population consuming the crop = 30.8% (Nel and Steyn, 2000), estimated ratio of indicator to pathogen = 0.001 for E. coli, 1 for Enterococcus, 0.001 for Staphylococcus and 0.0001 for total coliforms, n=365. No significant difference was found (p=0.05) for the risk presented by each of the three treatments and this risk was brought within the acceptable level of <1 in 10 000 by implementing mitigation measures resulting in a 5-log reduction of microbial load. The vertical line indicates the range, the box the 5th to 95th percentile and the mode is indicated by the numeric value. The maximum risk based on total coliform concentration for the greywater (G) treatment is boxed adjacent to the whisker for this treatment... 87 Figure 4.1: Annual outcome for various risks per 10 million persons in South Africa. (Norman et al., 2000; South African Police Service (SAPS). http://www.saps.gov.za/; StatsSA, 2001) . 99
TABLES
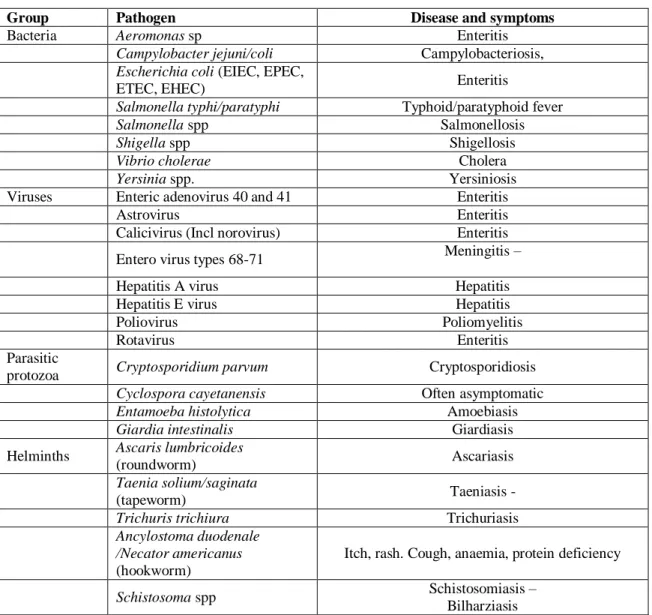
Table 1.1: Reported numbers of indicator bacteria in greywater (Adapted from Ottoson and Stenström, 2003 as used in WHO, 2006a). Different values for greywater were given by the various authors and reflect different conditions and habits ... 6 Table 1.2: Steps involved in QMRA of human health effects. (From WHO, 2006 a) ... 13 Table 1.3: Pathogens that may be excreted in faeces along with their related diseases. Extracted from (WHO, 2006a) and (Ottoson, 2005). ... 14 Table 1.4: Parameters required for modelling either the static or dynamic disease process.
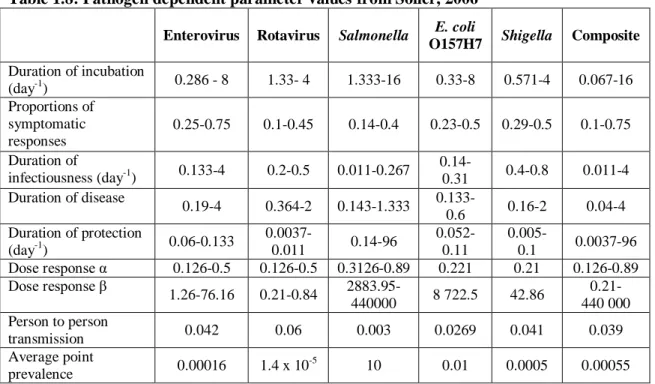
From Roesner et al., 2006 ... 18 Table 1.5: Reduction of pathogens on crops through use of barrier interventions. Extracted from WHO, 2006a ... 20 Table 1.6: Exposure to greywater in irrigation system extracted from (Ottoson, 2005) and (WHO, 2006a) ... 23 Table 1.7: Food and water consumption patterns in South Africa. From (Nel and Steyn, 2000) ... 23 Table 1.8: Pathogen dependent parameter values from Soller, 2006 ... 25 Table 2.1: Microorganisms selected for analysis based on locally prevalent diseases ... 33 Table 2.2: Factors used in the calculation of probability of infection from the consumption of crops ... 39 Table 2.3: Factors used in the calculation of health risk through exposure to greywater or soil during irrigation ... 40 Table 3.1: Results from Physico-chemical and microbial analyses performed on soil samples from unwatered plants and plants irrigated with greywater, hydroponic solution or tap-water respectively. Mean, maximum, minimum and Standard deviations are provided for all parameters. No statistical significance was found between parameters measured and treatments (p≤0.05) except in the case of Enterococcus where the level in greywater irrigated soil was statistically higher than for the other treatments (p≤0.05). ... 42
Table 3.2: Results from physico-chemical and microbial analyses performed on greywater, hydroponic solution or tap-water respectively. Mean, maximum, minimum and standard deviations are provided for all parameters. E. coli, Enterococcus and Staphylococcus were only detected in the greywater and were present at a statistically higher level than for hydroponic solution or tap water (p≤0.001). Total coliforms were significantly higher in the greywater than in either of the other two water types used for irrigation (p≤0.001). The conductivity of the greywater was significantly lower (p≤0.05) than that of the hydroponic solution. The level of ammonia in the greywater was not significantly different (p≤0.05) from that in the hydroponic solution and both were significantly higher than that in the tap water (p≤0.05). The significance of the difference between the Chemical Oxygen (COD) demand in greywater and the other two water treatments could not be tested as no COD was detected in the latter... 44 Table 3.3: Statistical values for the measurement of biological oxygen demand (BOD) and chemical oxygen demand (COD) in greywater. Approximately 30% of the oxygen demand could be attributed to Biological Oxygen Demand (BOD) which could be as a result of washings from the kitchen and bathroom or organic contamination from cleansing products in use by the households. Levels for both BOD and COD were significantly higher than for either hydroponic solution or tap water when tested at the p=0.05 level ... 45 Table 3.4: Median number of organisms per gram dry weight on external surfaces (ext) or the interior (int) of Swiss chard plants irrigated with greywater (G), hydroponic solution (H), tap water (T) or purchased commercially (C). Results are based on all samples taken over the complete trial period. No Ascaris ova, Pseudomonas, somatic coliphages, E. coli, Enterococcus or Staphylococcus were detected internally or externally for any of the water treatments. Total coliforms were detected for all treatments. ... 49 Table 3.5: Statistical comparison, using non-parametric (Kruskal Wallis test) methods, of means of bacterial load for the interior (int) and exterior (ext) of Swiss chard plants irrigated with greywater (G), hydroponic solution (H) or tap water (T). No significant differences were found at the p=0.05 level ... 49 Table 3.6: Median number of organisms per gram dry weight on external surfaces (ext) or the interior (int) of green peppers irrigated with greywater (G), hydroponic solution (H), tap water (T) or purchased commercially (C). Results are based on all samples taken over the complete trial period. No Ascaris ova, Pseudomonas, somatic coliphages, E. coli, Enterococcus or Staphylococcus were detected internally or externally for any of the water treatments. Total coliforms were detected for all treatments except externally for the commercial crop. ... 51
Table 3.7: Statistical comparison, using non-parametric ( Kruskal-Wallis) method, of means of bacterial load for the interior (int) and exterior (ext) of green peppers fruits irrigated with greywater (G), hydroponic solution (H or tap water (T). No significant differences were found at the p=0.05 level ... 53 Table 3.8: Median number of organisms per gram dry weight on external surfaces (ext) or the interior (int) of chillies irrigated with greywater (G),or hydroponic solution (H). Results are based on one growing cycle. No Ascaris ova, Pseudomonas, somatic coliphages, E. coli, Enterococcus or Staphylococcus were detected internally or externally for any of the water treatments. Total coliforms were detected externally and internally for crops irrigated with either greywater or hydroponic solution. ... 53 Table 3.9: Statistical comparison of means of bacterial load for the interior (int) and exterior (ext) of chillies irrigated with greywater (G), hydroponic solution (H), tap water (T) or purchased commercially (C), using non-parametric (Kruskall-Wallis) methods. No significant differences were found at the p=0.05 level ... 54 Table 3.10: Median number of organisms per gram dry weight on external surfaces (ext) or the interior (int) of beetroot irrigated with greywater (G), hydroponic solution (H), tap water (T) or purchased commercially (C). Results are based on all samples taken over the complete trial period. No Ascaris ova, Pseudomonas, somatic coliphages, E. coli was detected internally or externally for any of the water treatments. E. coli was detected externally for all three water treatments and internally for greywater irrigated crop. Enterococcus was detected internally and externally for greywater and hydroponic solution irrigated crop and externally for the commercial crop. Staphylococcus was detected internally and externally on crops from all three water treatments but not on the commercially bought crop. Total coliforms were detected internally and externally for all treatments. ... 55 Table 3.11: Statistical comparison, using non-parametric (Kruskal-Wallis) methods, of means of bacterial load for the interior (int) and exterior (ext) of beetroot irrigated with greywater (G), hydroponic solution (H) or tap water (T). No significant differences were found at the p=0.05 level ... 58 Table 3.12: Median number of organisms per gram dry weight on external surfaces (ext) or the interior (int) of potatoes irrigated with greywater (G), hydroponic solution (H), tap water (T) or purchased commercially (C). Results are based on all samples taken over the complete trial period. No Ascaris ova, Pseudomonas, somatic coliphages, E. coli or Enterococcus was detected internally or externally for any of the water treatments. Staphylococcus was detected
internally and externally on crops from all three water treatments and on the commercially bought crop. Total coliforms were detected externally for all treatments and internally for the commercially bought crop. ... 58 Table 3.13: Statistical comparison, using non-parametric (Kruskal-Wallis) methods, of means of bacterial load for the interior (int) and exterior (ext) of potatoes irrigated with greywater (G), hydroponic solution (H) or tap water (T). No significant differences were found at the p=0.05 level ... 60 Table 3.14: Median number of organisms per gram dry weight on external surfaces (ext) or the interior (int) of onions irrigated with greywater (G), hydroponic solution (H), tap water (T) or purchased commercially (C). Results are based on all samples taken over the complete trial period. E. coli was detected externally on all the samples, but not internally. Enterococcus was detected externally on all except the tap-water irrigated crop and was not detected internally in any of the samples. Staphylococcus was detected externally on all samples and internally on all except the commercially purchased crop. Total coliforms were detected internally and externally on all crops.... 61 Table 3.15: Statistical comparison, using non-parametric (Kruskal-Wallis) methods, of means of bacterial load for the interior (int) and exterior (ext) of onions irrigated with greywater (G), hydroponic solution (H) or tap water (T). No significant differences were found at the p=0.05 level ... 63 Table 3.16: : Median number of organisms per gram dry weight on external surfaces (ext) or the interior (int) of carrots irrigated with greywater (G), hydroponic solution (H), tap water (T) or purchased commercially (C). Results are based on all samples taken over the complete trial period. E. coli was detected externally for crops grown with hydroponic solution and internally and externally for crops grown with greywater. No Enterococcus was found internally for any of the samples but was found externally for crops grown with greywater or purchased commercially. Staphylococcus was detected in all crops except for those grown with tap water.
Total coliforms were detected internally and externally for all treatments except externally for the commercially purchased crop ... 64 Table 3.17: Statistical comparison, using non-parametric (Kruskal-Wallis) methods, of means of bacterial load for the interior (int) and exterior (ext) of carrots irrigated with greywater (G), hydroponic solution (H) or tap water (T). No significant differences were found at the p=0.05 level ... 66
Table 3.18: Mode value for annual probability of infection from the accidental consumption of irrigation water by field workers based on total coliform load. The following factors were used in the calculation α=-0.126, β=42.86, d=distribution fitted to the untransformed data by
@RISK. This data comprised an estimated daily consumption of water = 1 mL, the percentage of the population consuming the crop = 100%, estimated ratio of indicator to pathogen = 0.0001, n=200. Risk both with a 5-log reduction of risk by the implementation of mitigating measures and with no risk abatement are presented. When no mitigation measures are implemented there is a certainty of health risk to workers using greywater whereas there is negligible risk from hydroponic solution or tap water. This risk is brought to twice the acceptable level of risk by implementing a 5-log barrier intervention ... 71 Table 3.19: 95th percentile value for annual probability of infection from the accidental consumption of soil irrigated with one of the three water types based on load of the various microorganisms. The following factors were used in the calculation α=-0.126, β=42.86, d=distribution fitted to the untransformed data by @RISK. This data comprised an estimated daily accidental consumption of soil = 1g, the percentage of the population consuming the crop
= 100%, estimated ratio of indicator to pathogen = 1 for Enterococcus, 0.001 for Staphylococcus and 0.0001 for total coliforms, n=200. Risk both with a 5-log reduction of risk by the implementation of mitigating measures and with no risk abatement are presented. When no mitigation measures are implemented the health risk to workers using greywater is not significantly different to that from the other two treatments (p=0.05). This risk is brought within the acceptable level of risk by implementing a 5-log barrier intervention. ... 72 Table 3.20: 95th percentile value for annual probability of infection from the consumption of Swiss chard irrigated with greywater (G), hydroponic solution (H), tap water (T) or purchased commercially (C) based on load of the various microorganisms. The following were used in the calculation α=-0.126, β=42.86, d=distribution fitted to the untransformed data by @RISK.
This data comprised an estimated daily consumption of the crop = 9.2g, the percentage of the population consuming the crop = 27.4% (Nel and Steyn (2000), estimated ratio of indicator to pathogen = 0.001 for E. coli, 1 for Enterococcus, 0.001 for Staphylococcus and 0.0001 for total coliforms 0.01, n=365. No significant difference (p=0.05) was found between the treatments.
The risk was brought within the acceptable level of <1 in 10 000 by implementing mitigation measures resulting in a 5-log reduction of microbial load. ... 73 Table 3.21: 95th percentile value for annual probability of infection from the consumption of green peppers irrigated with greywater (G), hydroponic solution (H), or tap water (T) or purchased commercially (C) based on load of the various microorganisms. The following were
used in the calculation α=-0.126, β=42.86, d=distribution fitted to the untransformed data by
@RISK. This data comprised an estimated daily consumption of the crop =2.5g, the percentage of the population consuming the crop = 12.5% (Nel and Steyn (2000), estimated ratio of indicator to pathogen =0.001 for E. coli, 1 for Enterococcus, 0.001 for Staphylococcus and 0.0001 for total coliforms 0.01, n=365 . No significant difference was found (p=0.05) for the risk presented by each of the three treatments and this risk was brought within the acceptable level of <1 in 10 000 by implementing mitigation measures resulting in a 5-log reduction of microbial load. ... 75 Table 3.22: 95th percentile value for annual probability of infection from the consumption chillies irrigated with greywater (G) or hydroponic solution (H) based on load of the various microorganisms. The following were used in the calculation α=-0.126, β=42.86, d=distribution fitted to the untransformed data by @RISK. This data comprised an estimated daily consumption of the crop =0.6 g, the percentage of the population consuming the crop = 12.8% (Nel and Steyn (2000), estimated ratio of indicator to pathogen = 0.0001 for total coliforms, n=365 . No significant difference was found (p=0.05) for the risk presented by each of the three treatments and this risk was within the acceptable level of <1 in 10 000 even before implementation of mitigation measures. ... 77 Table 3.23: 95th percentile value for annual probability of infection from the consumption of beetroot irrigated with greywater (G), hydroponic solution (H) tap water (T) or purchased commercially (C) based on load of the various microorganisms. The following were used in the calculation α=-0.126, β=42.86, d=distribution fitted to the untransformed data by @RISK.
This data comprised an estimated daily consumption of the crop =3.9 g, the percentage of the population consuming the crop = 12.8% (Nel and Steyn (2000), estimated ratio of indicator to pathogen = 0.001 for E. coli, 1 for Enterococcus, 0.001 for Staphylococcus and 0.0001 for total coliforms, n=365 . No significant difference was found (p=0.05) for the risk presented by each of the three treatments and this risk was mainly brought within the acceptable level of <1 in 10 000 by implementing mitigation measures resulting in a 5-log reduction of microbial load. No significant difference was found between the treatments for any indicator at the p=0.05 level. 79 Table 3.24: 95th percentile value for annual probability of infection from the consumption of potato irrigated with greywater (G), hydroponic solution (H), or tap water (T) or purchased commercially (C). The following were used in the calculation α=-0.126, β=42.86, d=distribution fitted to the untransformed data by @RISK. This data comprised an estimated daily consumption of the crop =45.4 g, the percentage of the population consuming the crop = 27.1% (Nel and Steyn (2000), estimated ratio of indicator to pathogen = 0.001 for
Staphylococcus and 0.0001 for total coliforms, n=365 . No significant difference was found (p=0.05) for the risk presented by each of the three treatments and this risk was mainly brought within the acceptable level of <1 in 10 000 by implementing mitigation measures resulting in a 5-log reduction of microbial load. ... 82 Table 3.25: 95th percentile value for annual probability of infection from the consumption of onions irrigated with greywater (G), hydroponic solution (H), tap water (T) or purchased commercially (C) based on load of the various microorganisms. The following were used in the calculation α=-0.126, β=42.86, d=distribution fitted to the untransformed data by @RISK.
This data comprised an estimated daily consumption of the crop =2.5 g, the percentage of the population consuming the crop = 12.8% (Nel and Steyn (2000), estimated ratio of indicator to pathogen = 0.001 for E. coli, 1 for Enterococcus, 0.001 for Staphylococcus and 0.0001 for total coliforms, n=365 . No significant difference was found (p=0.05) for the risk presented by each of the three treatments and this risk was brought within the acceptable level of <1 in 10 000 by implementing mitigation measures resulting in a 5-log reduction of microbial load. ... 84 Table 3.26: 95th percentile value for annual probability of infection from the consumption of carrot irrigated with greywater (G), hydroponic solution (H), or tap water (T) or purchased commercially (C) based on load of the various microorganisms. The following were used in the calculation α=-0.126, β=42.86, d=distribution fitted to the untransformed data by @RISK.
This data comprised an estimated daily consumption of the crop =3.9, the percentage of the population consuming the crop = 30.8% (Nel and Steyn (2000), estimated ratio of indicator to pathogen = 0.001 for E. coli, 1 for Enterococcus, 0.001 for Staphylococcus and 0.0001 for total coliforms, n=365 . No significant difference was found (p=0.05) for the risk presented by each of the three treatments and this risk was brought within the acceptable level of <1 in 10 000 by implementing mitigation measures resulting in a 5-log reduction of microbial load. ... 86 Table 4.1: Reported number of organisms in 100 mL of greywater or sewage water respectively (Ottosson and Stenström, 2005). ... 89 Table 4.2: Comparison of the mean greywater analysis values with the General Authorisation values for irrigation with used water or effluent ... 96 Table 4.3: Water quality guidance for use of greywater for small-scale irrigation in South Africa. From South African Water Quality Guidelines for Irrigation, 2nd edition DWAF, 1996 and Rodda et al. 2010 (in preparation) ... 97
Table 8.1 Probability of infection from single exposure and annual probability of infection for an individual agricultural worker irrigating crops subsurface... 152 Table 8.2: Probability of infection from single exposure and annual probability of infection for an individual working with sub-surface irrigated soil ... 153 Table 8.3: Probability of infection as a result of individual or annual consumption of Swiss chard irrigated subsurface with greywater (G), hydroponic solution (H), tap water (T) or purchased commercially (C) calculated according to the selected indicator organisms ... 155 Table 8.4: Probability of infection as a result of individual or annual consumption of green peppers irrigated subsurface with greywater (G), hydroponic solution (H), tap water (T) or purchased commercially (C) calculated according to the selected indicator organisms ... 158 Table 8.5: Probability of infection as a result of individual or annual consumption of chillies irrigated subsurface with greywater (G) or hydroponic solution (H) calculated according to the load of total coliforms ... 161 Table 8.6: Probability of infection as a result of individual or annual consumption of beetroot irrigated subsurface with greywater (G), hydroponic solution (H), tap water (T) or purchased commercially (C), calculated according to the selected indicator organisms ... 162 Table 8.7: Probability of infection as a result of individual or annual consumption of potato irrigated subsurface with greywater (G), hydroponic solution (H), tap water (T) or purchased commercially (C), calculated according to the selected indicator organisms ... 165 Table 8.8: Probability of infection as a result of individual or annual consumption of onion irrigated subsurface with greywater (G), hydroponic solution (H), tap water (T) or purchased commercially (C) calculated according to the selected indicator organisms ... 167 Table 8.9: Probability of infection as a result of individual or annual consumption of carrot irrigated subsurface with greywater (G), hydroponic solution (H), tap water (T) or purchased commercially (C) calculated according to the selected indicator organisms ... 170
ACKNOWLEDGEMENTS
I would like to express my gratitude to the following:-
My adult children, Edmund and Nuala, for your unfailing patience and encouragement. Without your loving support I would be lost. I cannot express my gratitude for your confidence in me and my pride in your achievements.
To my youngest child Pearce, you have borne the brunt of my academic efforts with love and understanding, looking-up words for me, typing and making me endless cups of coffee. I hope to do the same for you when you get to the same stage.
Dr Nicola Rodda and Dr David Muir for their supervision, encouragement and critical advice, particularly when the going got rough.
Professor Mike Smith, Professor Chris Buckley and Chris Brouckaert for their encouragement, support and advice at all stages given freely although I was not their student.
eThekwini Water and Sanitation for their financial contribution to my studies and for allowing me to do this project using their facilities.
The staff and students of eThekwini Water and Sanitation Scientific Services for all their help with obtaining the bacterial data. I am sure if you never see a blended vegetable again, it will be too soon!
DEDICATION
To the memory of my beloved brother-in-law Peter, murdered in his home on 2nd June 2008.
You lived a life of Christian goodness, sharing your immense knowledge, humour and wisdom with all you met and your worldly goods with those in need. In your retirement you dedicated yourself to teaching disadvantaged youth in Diepsloot and were a staunch member of the Saint Vincent de Paul Society in Rosebank.
Every student should have a friend and teacher like you at least once in their lives. You said you would not come to another of my graduations until my gown changed colour – I am not there yet, and I don’t know if I have it in me to make it to the end, but I will do my best.
Rest in peace great man.
LIST OF ABREVIATIONS
BOD5 Five day biological oxygen demand cfu Colony forming units
COD Chemical oxygen demand mS/m milli-Siemens per metre
NH3-N Ammonia concentration as nitrogen NO3-N Nitrate concentration as nitrogen PFU Plaque forming units
QMRA Quantitative microbial risk assessment TKN Total Kjeldahl nitrogen
E. coli Escherichia coli
BOD Biological oxygen demand
1. INTRODUCTION
“The key lies in asking the right questions, challenging existing paradigms and ultimately, changing the way we think about water” (Turton 2008)
1.1 Study context
The world is becoming increasingly aware that water is a vital resource, not to be squandered or abused. In many areas, the availability of clean water is a critical issue and economic development is being delayed as a result of its lack (CSBE, 2003; Adewumi et al., 2008).
South Africa is not immune to these problems as its rainfall level of 497 mm/year is well below the global average of 860 mm/year (Turton 2008). Dr Kader Asmal, a previous South African Minister of Water Affairs and Forestry, in his budget speech to the National Assembly in 1997 and in his keynote address to the Stockholm Water Symposium in 1999, expressed the wish with respect to water that there would be ―some for all forever‖. This seemingly simple wish is not as straightforward as it sounds when burgeoning populations, climate change and increasing levels of pollution are taken into account. South Africa is widely regarded as being a water scarce country (Adewumi et al, 2008; Turton, 2008). It must be recognised that this generous wish may therefore not be realised unless every drop of water is carefully husbanded, both for human use and for the environment. According to the National Water Resource Strategy report (DWAF, 2004a), around 98% of the total South African national water resource had been allocated, with over-allocation in some areas being as high as 150%. These figures were based on data from 1998 and may have worsened since: according to data from the Department of Water Affairs and Forestry quoted in Discussion Document D0405, (StatsSA, 2009), the water balance for the year 2000 was 186 million cubic meters and the prediction for 2025 is a deficit of 234 million cubic meters. It is therefore vital to change the thinking on water use and reuse.
With the change of political dispensation in 1994, it was recognized that the vast majority of South Africa’s citizens did not have access to adequate services and that this would need to be rectified. The provincial statistics indicate that Gauteng has the largest share of the national population with 21.4%, closely followed by KwaZulu-Natal with 21.2% (StatsSA, 2009). The rapid urbanisation seen in South Africa and particularly in the eThekwini area (previously
Durban Metro) has resulted in informal areas of varying degrees of sophistication, from shacks built from cardboard boxes and plastic sheeting to more permanent corrugated iron and brick structures. Population growth in the eThekwini municipal area, resulting from urbanisation, natural growth and migration, has led to difficulties between socio-economic groups in terms of service provision, with many seeing the ―norm‖ of waterborne sanitation as the only acceptable service level for all economic strata. Informal settlements, poverty, unemployment and water demands are on the increase and a culture of non-payment for and vandalisation of services threatens the economic sustainability of service provision, especially the provision of potable water (Moodliar, pers. comm. 2009)1. Moreover, uncontrolled wastewater disposal in informal and peri-urban settlements and rural areas on the outskirts of the city is a problem that impacts negatively on the environment and public health. In line with the guidelines set out by the Department of Water Affairs and Forestry (DWAF, 2004a), progress has been made in the supply of potable water to these areas, but often the provision of sanitation lags behind. When strategic development plans were being discussed for the Metropolitan Integrated Development Plan, a great deal of effort was put into obtaining feedback from communities with regard to what they saw as the most urgent needs in terms of service provision (Pfaff, pers. comm., 20082). It was soon found that generally, the most urgent need with regard to service provision was seen as access to potable water. Originally, the provision of sanitation did not make it into the top five.
With this in mind, the eThekwini Municipality was the first municipality in the country to implement the free delivery of six kilolitres of potable water per household per month (N.
Macleod pers. com3. with reference to eThekwini water Services Development Plan (Ethekwini, 2003). This has now been increased to nine kilolitres per month. This delivery ranged from the full pressure delivery common in the urban centres, to semi-pressure roof tanks, ground tanks and community standpipes. According to Winter et al., (2008 a and b), 92% of the South African population now has access to an improved source of potable water but only 65% has access to improved sanitation. For eThekwini Municipality, the provision of water and sanitation is also affected by the topography of the region. The area rises steeply from sea level in the east and, in the western areas in particular, soon becomes very steep and inaccessible. Partially as a result of this and with available logistics in mind, a ―waterborne edge‖ has been instituted which delineates the area to which waterborne sanitation can be provided, at least in the short term (Pfaff, pers. comm. 20094). With the easing of access to
1 Moodliar, S. eThekwini Water and Sanitation, P.O. Box 1038 Durban 4000
2 Pfaff, W. eThekwini Water and Sanitation, P.O. Box 1038 Durban 4000
3 Macleod, N eThekwini water and sanitation P.O. Box 1038 Durban 4000
4 As above
treated potable water came the problem of disposal of sewage and greywater in areas outside the waterborne edge or in areas which did not have sewerage infrastructure. The full pressure systems within the previous urban areas had waterborne sanitation with the necessary infrastructure of sewerage pipes, pump stations and wastewater treatment plants, but in many informal settlements and rural areas there was no means of disposing of sewage and greywater other than into the latrine or onto the surrounding ground. In higher density settlements this soon led to malfunctioning latrine-type toilets or health hazards from surface pooling of discarded used water with the resulting increase in flies, mosquitoes and other vectors and the concomitant increase in risk of disease. An example of these conditions is presented in Figure 1.1, a photograph taken at an informal settlement in the eThekwini area.
Figure 1.1: Photograph taken by eThekwini staff of surface disposal of greywater leading to poor sanitary conditions.
This is not a problem peculiar to eThekwini and was investigated by Carden et al., (2007 a and b) in relation to the Western Cape where conditions in the Khayelitsha settlement were discussed. Development of a better sanitation system, which would address the problems of greywater disposal, was therefore seen as a priority in eThekwini and became the focus of several Water Research Commission projects.
In any sanitary intervention, the Bellagio principles (Hurst et al., 2002; WHO, 2006a) need to be kept in mind to ensure acceptability of the intervention and long term economic and environmental sustainability. These principles were drawn up in 2000 by the Environmental Sanitation Working Group of the Water Supply and Sanitation Collaborative Council and are stated as four points, covering:
Human dignity, quality of life and environmental security at the household level Decision making involving all stakeholders
Consideration of waste as a resource with holistic management
Keeping the resolution of environmental sanitation problems to the minimum practical size
Any intervention would therefore have to address more than just the obvious one of waste removal. Interventions would need to explore possibilities which could result in closing the water loop, and at the same time improving the condition of the community. In addition, the United Nations Millennium Development Goals clearly state that extreme poverty and hunger must be eradicated, child mortality reduced, maternal health improved, HIV/AIDS, malaria and other diseases must be combated, and environmental sustainability ensured (www.un.org).
KwaZulu-Natal arguably has the highest rate of HIV infection in the world (Cullinan, 2004;
Thurlow et al., 2009) with a level of 36.5% antenatal prevalence, and as such its decision- makers have to be very aware of the increased health risk faced by people infected with this disease and the effect on families of the loss or incapacity of breadwinners. In many cases, the parents of a family are bedridden or have died and the household is headed either by an elder sibling or a grandparent, usually a grandmother (Biancallani, pers. comm., 2010)5. Disposable income is negligible and the risk of malnutrition is high. As such, food security is vital and any improvement in household access to nutritious food at low cost should be encouraged so long as the health risk can be minimized, as those suffering from the disease are extremely susceptible to other infections. The possibility of turning the problem of greywater disposal into a means of improving the nutritional situation of households was viewed with interest by both the municipality and local communities. In 2003, a pilot trial was started in a small community in eThekwini where household greywater was used to irrigate above ground crops for household consumption (T. Gounden, 2003. pers. comm.6). On visual inspection, the crops appeared to do well and the community was interested in extending their enterprise. It was however recognized that there might be health risks associated with growing crops in this manner and investigation was necessary before official sanction could be given to a larger project or range of crops. A joint project to investigate this was therefore initiated between eThekwini Water and Sanitation and the University of KwaZulu-Natal. This dissertation forms part of a larger project conducted under the auspices of the Water Research Commission as Project K5/1639.
5Biancallani, M. Right to Life Campaign. P.O. Box 50299, Durban4062
6 T. Gounden, eThekwini Water and Sanitation, P.O. Box 1038 Durban 4000
1.2 Greywater
Greywater is often regarded as untreated household effluent water from baths, showers, wash basins and laundries but not including toilet water (Otterpohl et al., 1997; Dixon et al., 1999;
Ledin et al., 2001; Eriksson et al., 2002; Ottoson and Stenström, 2003; WHO, 2006a and b;
Rodda, et al, 2010 in press). Some authors however, exclude kitchen wastewater from the general greywater as a result of its high concentration of oil and biodegradable compounds (Christova-Boal et al., 1996; Little, 2002; Al-Jayyousi, 2003; Wilderer, 2004). Because domestic greywater does not generally include wastes from toileting, except by cross- contamination, it is expected that, while it may still contain pathogens (Cassanova et al., 2001;
Birks and Hills, 2005), these are likely to be lower than for black water (Ottoson, 2005; WHO 2006a; Brown, 2009). Greywater will therefore present less health risk to communities using it for irrigation. The World Health Organisation guidelines for greywater re-use (WHO, 2006a and b) also present a spectrum of bacterial loading figures for greywater which show that the standard faecal indicator organisms are present at a range of levels in the various types of greywater and also within the same type from a different source. These data are presented in Table 1.1 and the use of faecal indicators is presented in Section 1.7.1. Greywater is remarkable for its variability and Eriksson et.al (2002) clearly present this. It is also likely to contain chemicals from household cleaning agents and medications as well as cosmetics, all of which may contribute to toxicity or produce endocrine disrupter by-products.
1.3 Drivers for re-use
Nationally, the re-use of greywater is unlikely to solve problems of water scarcity as the volumes involved are relatively small in the overall picture. In eThekwini however, approximately 60% of the potable water sold is used domestically (S. Moodliar 2009, pers.
comm.7), so widespread re-use could have an influence on the local need for increased spending on water purchases and infrastructure such as impoundments, reservoirs and piping.
For individual households and even small communities, water re-use can mean the difference between food security and malnutrition. EThekwini Municipality has increased the cost of water by approximately 10% for the 2010 – 2011 financial year and this will impact poor households in spite of the current level of 9kL free water per household (EThekwini, 2010).
7 S. Moodliar, eThekwini Water and Sanitation, P.O. Box 1038, Durban 4000