HYDRATE PHASE EQUILIBRIUM STUDIES FOR Xe, Ar, Kr, AND CF
4IN THE PRESENCE OF TBAB AQUEOUS
SOLUTIONS
By
Saeideh Babaee
MSc (Chemical Engineering), Shiraz University of Technology, Iran
This thesis is submitted in fulfilment of the academic requirements for the degree of Doctor of Philosophy (PhD) in Chemical Engineering at the School of Engineering, University of KwaZulu-Natal.
Supervisor: Prof. Deresh Ramjugernath
Co-Supervisors: Prof. Amir H. Mohammadi, and Prof. Paramespri Naidoo
September 2015
i
DECLARATION 1 – PLAGIARISM
I, Saeideh Babaee, declare that:
(i) The research reported in this thesis, except where otherwise indicated, is my original work.
(ii) This thesis has not been submitted for any degree or examination at any other university.
(iii) This thesis does not contain other persons’ data, pictures, graphs or other information, unless specifically acknowledged as being sourced from other persons.
(iv) This thesis does not contain other persons’ writing, unless specifically acknowledged as being sourced from other researchers. Where other written sources have been quoted, then: a) their words have been re-written but the general information attributed to them has been referenced; b) where their exact words have been used, their writing has been placed inside quotation marks, and referenced.
(v) Where I have reproduced a publication of which I am an author, co-author or editor, I have indicated in detail which part of the publication was actually written by myself alone and have fully referenced such publications.
(vi) This thesis does not contain text, graphics or tables copied and pasted from the internet, unless specifically acknowledged, and the source being detailed in the thesis and in the References sections.
Saeideh Babaee Date
_________________________ _______________
As the candidate‘s supervisor I agree/do not agree to the submission of this thesis.
Prof. Deresh Ramjugernath Date __________________________ _______________
Prof. Amir H. Mohammadi Date __________________________ _______________
Prof. Paramespri Naidoo Date
__________________________ _______________
ii
DECLARATION 2 - PUBLICATIONS
DETAILSOFCONTRIBUTIONTOPUBLICATIONSthat form part and/or include research presented in this thesis(include publications in preparation, submitted, in press and published and give details of the contributions of each author to the experimental work and writing of each publication)
Publication 1: Journal of Chemical Thermodynamics 81 (2015) 52–59.
Journal Title: Kinetic and thermodynamic behaviour of CF4 clathrate hydrates.
Authors: S. Babaee,H. Hashemi,A. H. Mohammadi, P. Naidoo, D. Ramjugernath Publication 2: Journal of Chemical and Engineering Data 2014, 59 (11), 3900–3906.
Journal Title: Experimental Measurement and Thermodynamic Modeling of Hydrate Dissociation Conditions for the Argon + TBAB + Water System.
Authors: S. Babaee,H. Hashemi,A. H. Mohammadi, P. Naidoo, D. Ramjugernath Publication 3: Journal of Chemical Engineering Data 2015, 60 (5), 1324–1330.
Journal Title: Experimental Measurements and Thermodynamic Modeling of Hydrate Dissociation Conditions for the Xenon + TBAB + Water System.
Authors: S. Babaee,H. Hashemi,A. H. Mohammadi, P. Naidoo, D. Ramjugernath Publication 4: The Journal of Supercritical Fluids 2016, 107, 676–681.
Journal Title: Experimental Measurements and Thermodynamic Modelling of Hydrate Dissociation Conditions for the Krypton + TBAB + Water System.
Authors: S. Babaee,H. Hashemi,A. H. Mohammadi, P. Naidoo, D. Ramjugernath Publication 5: Journal of Chemical Engineering (Manuscript in preparation).
Journal Title: Hydrate Kinetic Behavior for the System of Argon and Aqueous Solution of TBAB + SDS
Authors: S. Babaee,H. Hashemi,A. H. Mohammadi, P. Naidoo, D. Ramjugernath Publication 6: Journal of Chemical Thermodynamics (Manuscript in preparation).
Journal Title: Experimental Measurement and Thermodynamic Modelling of Hydrate Phase Equilibrium Condition for CF4 + TBAB Aqueous Solution
Authors: S. Babaee,H. Hashemi,A. H. Mohammadi, P. Naidoo, D. Ramjugernath
iii Additional Journals
Publication 1: The Journal of Chemical Thermodynamics 2015, 90, 193-198.
Journal Title: Clathrate Hydrate Dissociation Conditions of Refrigerants R404A, R406A, R408A and R427A: Experimental Measurements and Thermodynamic Modeling.
Authors: H. Hashemi, S. Babaee, P. Naidoo, A.H. Mohammadi, and D. Ramjugernath Publication 2: The Journal of Chemical Thermodynamics 2015, 80, 30-40.
Journal Title: Experimental measurements and thermodynamic modeling of refrigerant hydrates dissociation conditions
Authors: H. Hashemi, S. Babaee, P. Naidoo, A.H. Mohammadi, and D. Ramjugernath Publication 3: The Journal of Chemical Thermodynamics 2015, 82, 47-52.
Journal Title: Experimental study and Modeling of the Kinetics of Refrigerant Hydrate Formation.
Authors: H. Hashemi, S. Babaee, P. Naidoo, A.H. Mohammadi, and D. Ramjugernath Publication 4: Journal of Chemical and Engineering Data 2014, 59, 3907–3911.
Journal Title: Experimental Measurements and Thermodynamic Modeling of Clathrate Hydrate Dissociation Conditions for Refrigerants R116, R23, and Their Mixture R508B.
Authors: H. Hashemi, S. Babaee, P. Naidoo, A.H. Mohammadi, and D. Ramjugernath Publication 5: Fluid Phase Equilibria 2015, 388, 182-187.
Journal Title: A Thermodynamic Consistency Test for Experimental Isobaric Data of Wax Solubility in Gaseous Systems.
Authors: J. Kondori, H. Hashemi, S.Babaee, P. Naidoo, A. H. Mohammadi, and D.
Ramjugernath
Publication 6: Fluid Phase Equilibria 2013, 360, 161-168.
Journal Title: Gas hydrate phase equilibrium in porous media: An assessment test for experimental data.
Authors: P. Ilani-Kashkouli, H. Hashemi, F. Gharagheizi, S. Babaee, A. H. Mohammadi, and D.Ramjugernath
Publication 7: Fluid Phase Equilibria 2013, 360, 68-76.
Journal Title: An assessment test for phase equilibrium data of water soluble and insoluble clathrate hydrate formers.
Authors: P. Ilani-Kashkouli, S. Babaee, F. Gharagheizi, H. Hashemi, A. H. Mohammadi, and D. Ramjugernath
Publication 8: Journal of Chemical Engineering Data 2014, 59 (9), 2914–2919.
iv Journal Title: Phase Equilibria of Clathrate Hydrates of Ethyne + Propane.
Authors: K. Tumba, S. Babaee, P. Naidoo, A. H. Mohammadi, and D. Ramjugernath Publication 9: Fluid Phase Equilibria 2013, 349, 71-82.
Journal Title: Assessment of Clathrate Hydrate Phase Equilibrium Data for CO2 + CH4/N2 + Water System.
Authors: A. Eslamimanesh, S. Babaee, F. Gharagheizi, J. Javanmardi, A. H. Mohammadi, and D. Richon
Publication 10: Journal of Chemical Engineering Data, (to be submitted)
Journal Title: Kinetics of the hydrate formation of Acethyene, Ethyne, Propene, propylene, ethane, ethylene.
Authors: H. Hashemi, S. Babaee, P. Naidoo, A.H. Mohammadi, and D. Ramjugernath Publication 11: The Journal of Chemical Thermodynamics, (to be submitted).
Journal Title: Application of clathrate hydrate in energy systems: A review.
Authors: H. Hashemi, S. Babaee, P. Naidoo, A.H. Mohammadi, and D. Ramjugernath Publication 12: The Journal of Chemical Thermodynamics, (to be submitted)
Journal Title: Kinetics of the hydrate formation of the refrigerants R404A, R406A, R408A and R427A.
Authors: H. Hashemi, S. Babaee, P. Naidoo, A.H. Mohammadi, and D. Ramjugernath Publication 13: Fluid Phase Equilibria Journal 2016, 413, 99-109.
Title: Clathrate Hydrate Dissociation Conditions for Refrigerant + Sucrose Aqueous Solutions:
Experimental Measurement and Thermodynamic Modelling.
Authors: A. Smith, S. Babaee, A. H. Mohammadi, P. Naidoo, D. Ramjugernath Book chapters
Publication 1: Advances in Chemistry Research (Volume 25); 2015; Nova Science Publishers, Inc., NY, USA, Editors: James C. Taylor, pp.177-198.
Chapter Title: A Thermodynamic Consistency Test for Experimental Data of Salt Deposition in Saline Water.
Authors: S. Babaee, H. Hashemi, J. Kondori, A. H. Mohammadi, and D. Ramjugernath
Publication 2: Advances in Chemistry Research (Volume 24), 2014; Nova Science Publishers, Inc., NY, USA, Editors: James C. Taylor. pp.73-78.
Chapter Title: Evaluation of the Experimental data for Gas Solubility in Liquid Water in Equilibrium with the Gas Hydrates. Authors:P. Ilani-Kashkouli, S. Babaee, F. Gharagheizi, H.
Hashemi, A. H. Mohammadi, and D. Ramjugernath
v
ACKNOWLEDGEMENTS
All praises and thanks to God, the most gracious the most merciful, for all his apparent and unapparent graces and helps.
I would like to express my deepest gratitude to my parents, Mr. Azad Babaee and Mrs. Shirin Ghayour, for their continuous and unconditional support, patience, love and dedication. It was really impossible to go for this whole PhD study without their support.
I would like to express my sincere gratitude to my supervisors: Prof. Deresh Ramjugernath, Prof. Amir H. Mohammadi and Prof. Paramespri Naidoo for their non-stop support of my research, for their patience, inspiration, enthusiasm, and broad knowledge. It was truly an honour and a great experience to work with such talented, skilled experimentalists.
I want to express my wholehearted appreciation to my husband, Mr. Hamed Hashemi, for his love and his care in my life and in my PhD study. He was always around encouraging and supporting me during all difficult moments.
I would like to express my deepest gratitude to Prof. Giancarlo Contrafatto and Mrs. Elaine Contrafatto for their admirable support, patience, and providing me with a calm atmosphere to perform my study in South Africa.
I would like to express my sincere appreciation to Mr Leon Augustyn, Dr. Wayne Nelson and Mr Ayanda Khanyile for their valuable assistant and care in the chemical engineering laboratory, during my PhD study.
vi
ABSTRACT
The separation of xenon from a mixture of xenon, krypton and argon is an important industrial problem. Cryogenic distillation, zeolite adsorbent, metal - organic framework (MOF) and membranes are the well-established methods for the separation of these gases. A large amount of energy is consumed for the gas separation using the cryogenic distillation method during the gas liquefaction. Zeolite adsorbents can select xenon over krypton at conditions close to room temperature. The capacity of MOFs is 20 percent of the total pore volume for the separation of Xe from a mixture of Xe, Kr and Ar. In a comparison of these methods, cryogenic distillation is a costly and energy intensive and other separation methods such as membranes and adsorbents have not been proven to be economical. Hence the purification of noble gas mixtures remains a challenge with researchers investigating alternate separation techniques. One of the newest methods for gas separation is the use of gas/clathrate hydrates. The basic idea is to take advantage of selective encapsulation of gas molecules inside a gas hydrate crystal at the specific conditions of temperature and pressure.
Gas hydrates or clathrate hydrates, are non-stoichiometric crystals of guest molecules with an appropriate molecular diameter recognised as hydrate formers which can be trapped inside the cavities of water molecules by hydrogen bonds at suitable temperature and pressure conditions. It is well established that gas hydrates can be utilized for separating mixtures of expensive gases consisting of Ar, Kr, Xe and CF4 instead of using the conventional methods such as cryogenic distillations which is costly and quite energy intensive. Hence, accurate information of the hydrate formation/dissociation conditions of Ar, Kr, Xe and CF4 hydrate formation is vital to develop such hydrate based procedures. The major problem in the implementation of gas hydrate technology for applications in gas separation is their conditions for dissociation, which occur at high pressures. One solution to this problem is the application of Quaternary Ammonium Salts or QAS semi-clathrate hydrates such as tetra-n-butyl ammonium bromide (TBAB) which can moderate the hydrate formation and dissociation conditions. The addition of the salt to the solution enables a shift in the P-T diagrams to lower pressures and higher temperatures.
The aim of this study was to measure the hydrate dissociation conditions in the system of Xe/Ar/Kr and CF4 in the presence of aqueous TBAB solutions. For this purpose, the isochoric pressure search method was applied to measure the hydrate (H) - liquid (L) - vapour (V) phase equilibrium. For this purpose, the hydrate phase dissociation conditions for the systems of Ar + water + TBAB (0, 5, 10, 20, and 30 wt% TBAB), Kr + water + TBAB (0, 5,
vii 10, and 20 wt% TBAB), Xe + water + TBAB (0, 10, 20, and 30 wt% TBAB) and CF4 + water + TBAB (0, 5, 10, 20, and 30wt % TBAB) were measured.
The results indicate that TBAB has a significant promotion effect on the hydrate formation of Ar and Kr. In addition, with an increase in the TBAB concentration, a promotion effect of TBAB is observed. The hydrate dissociation measurements using a mass fraction of 0.1, 0.2 and 0.3 promotes the Xe hydrate dissociation conditions at pressures lower than 0.73 MPa, 1.40 MPa and 1.57 MPa, respectively. At the higher pressures the TBAB aqueous solution showed no effect on the Xe hydrate phase equilibrium. Results also show that TBAB aqueous solution with the mass fractions of 0.05, 0.1, and 0.2 has no promotion effect on the hydrate formation of CF4. However, the aqueous TBAB solution with 0.30 mass fraction showed a significant promotion effect on the CF4 hydrate formation.
Three thermodynamic models namely the fugacity approach, the Chen and Guo approach (1998) and a simple method based on fugacity approach and vapour pressure calculations were applied to estimate the hydrate equilibrium data for the system of Ar/Kr/Xe and CF4 + water. The results show a good agreement between the experimental measurements and modelling calculations. Additionally, a thermodynamic model based on the models of Chen and Guo (1998) and Joshi et al. (2012) was developed to correlate the hydrate dissociation conditions for the systems of Xe + water + TBAB, Ar + water + TBAB, Kr + water + TBAB and CF4 + water + TBAB. The Langmuir and Antoine constants for the Xe / Kr / Ar and CF4
hydrate as well as the constants for water activity in the system of semi-clathrate hydrates of Xe / Ar / Ke and CF4 + aqueous solutions of TBAB were optimized. The results indicate a reasonably good agreement between the experimental measurements and modelling calculations.
This study also presents an experimental kinetic study for CF4 clathrate hydrates to investigate the effect of initial temperature and initial pressure on the rate of hydrate formation.
The results display that an increase in the initial pressure at constant temperature decreases the induction time, while the CF4 hydrate formation rate, water to hydrate conversion, the apparent rate constant of reaction and storage capacity increase. The similar behaviours are detected with a decrease in the initial temperature at constant pressure. A thermodynamic model based on van der Waals and Platteeuw (vdW-P) solid solution theory (van der Waals and Platteeuw, 1959) was used for the representation of hydrate dissociation conditions. The Langmuir constants for CF4 based on the equation by Parrish and Prausnitz is also reported.
viii In this study, the effect of initial temperature, initial pressure, aqueous TBAB solution concentration, and sodium dodecyl benzene sulfonate (SDS) concentration on the kinetic of the semi-clathrate hydrate of Ar + aqueous TBAB solutions was also investigated. The results indicated that with an increase in the initial pressure at a constant temperature, the induction time decreases significantly. The same trends were detected with a decrease in the initial temperature at a constant pressure. In addition, with an increase in the TBAB concentration from 0.1 to 0.3 mass fraction TBAB, the rate of semi-clathrate hydrate nucleation increases and the induction time decreases, significantly. The results show the positive kinetic and thermodynamic effect of TBAB on Ar hydrate which makes TBAB as a reliable promoter to decrease the pressure of argon hydrate formation and increase the rate of argon hydrate formation. The results for the addition of SDS (in the concentration of 100, 200, 400 ppm) indicated that SDS increases the induction time of the semi-clathrate hydrate formation for the system of Ar + TBAB + water.
ix
TABLE OF CONTENTS
CHAPTER ONE: INTRODUCTION
... 11. Introduction
... 1CHAPTER TWO: GAS HYDRATES
... 72. Gas hydrate
... 72.1. Historical background
... 72.2. Gas hydrates structures
... 92.2.1. Structure I (sI)
... 92.2.2. Structure II (sII)
... 112.2.3. Structure H (sH)
... 112.3. Cages occupancies
... 122.4. Gas hydrate applications
... 152.4.1. Future energy source
... 162.4.2. Gas storage and transportation
... 162.4.3. Water desalination
... 162.4.4. Gas separation
... 172.5. Gas hydrate promoters
... 212.6. Semi-clathrate hydrates
... 22CHAPTER THREE: THERMODYNAMIC AND KINETIC MODELLING
... 253. Thermodynamic and kinetic modelling
... 253.1. Modelling of gas hydrate dissociation conditions
... 263.1.1. K-values and gravity diagram method
... 263.1.2. Fugacity approach (equality of water fugacity in the neighbouring phases)
283.1.3 Chemical potential approach
... 313.1.4. A simple method based on fugacity approach
... 31x
3.1.5. Equality of hydrate former fugacity in the neighbour phases (Chen and
Guo, 1998) model
... 343.2. Modelling of semi-clathrate hydrate dissociation conditions
... 363.3. Kinetic study
... 38CHAPTER FOUR: REVIEW OF THE EXPERIMENTAL METHODS AND EQUIPMENT
... 434. Review of experimental methods and equipment
... 434.1. Significant parameters for the development of a gas hydrate apparatus.
... 444.2. Equipment review
... 454.2.1. The apparatus of Deaton and Frost (1937)
... 454.2.2. Quartz crystal microbalance (QCM)
... 474.2.3. Cailletet Apparatus
... 484.2.4. High Pressure autoclave
... 494.2.5. Calorimetric approaches
... 504.3. Available experimental methods for the determination of hydrate dissociation
524.3.1. Visual isothermal pressure search method
... 534.3.2. Visual isobaric temperature search method
... 534.3.3. Isochoric pressure search method
... 54CHAPTER FIVE: DESCRIPTION OF THE EXPERIMENTAL APPARATUS AND PROCEDURE
... 565. Description of experimental apparatus and procedure
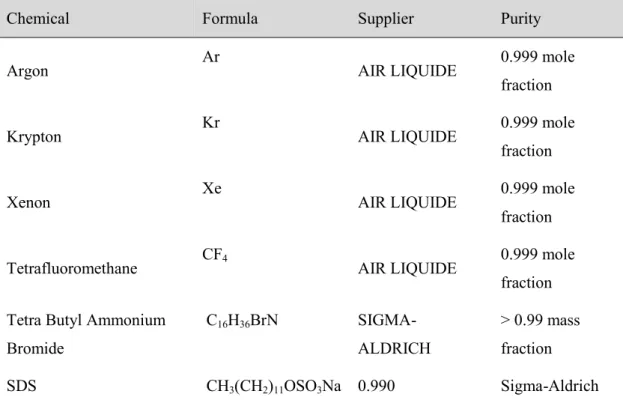
... 565.1. Materials
... 575.2. Experimental apparatus
... 585.2.1. The high pressure equilibrium cell
... 605.2.2. Agitation system
... 635.2.3. The liquid thermostated bath
... 655.2.4. Temperature Controllers
... 66xi
5.2.6. Pressure Transducer
... 675.3. Preparation of the set-up before hydrate measurements
... 675.3.1. Cleaning the equilibrium cell
... 675.3.2. Leak test
... 675.3.3. Pressure calibration
... 685.3.4. Temperature calibration
... 705.3.5. Vapour Pressure Measurement Test
... 715.4. Experimental procedure for gas hydrate measurements
... 735.4.1. Experimental procedures for measurements of hydrate dissociation points
735.4.2. Experimental procedures to assess the kinetic behaviour of gas hydrate formation
... 765.4.3. Shutdown the procedure
... 775.5. NIST uncertainty analysis for the measurement of the hydrate dissociation experimental data.
... 775.5.1. Estimation of Uncertainties
... 785.5.2. Reporting uncertainty
... 79CHAPTER SIX: RESULTS AND DISCUSSION
... 816. Results and discussion
... 816.1. Experimental measurements of the hydrate/semi-clathrate hydrates dissociation conditions
... 826.1.1. Test system
... 836.1.2. TBAB+ H
2O system
... 846.1.3. Ar + TBAB + Water system
... 876.1.4. Kr + TBAB + Water system
... 906.1.5. Xe + TBAB + Water system
... 926.1.6. CF
4+ TBAB + Water system
... 956.2. Thermodynamic modelling
... 99xii
6.2.1. Modelling of simple hydrate of Ar, Kr, Xe and CF
4 ... 996.2.2. Modelling of semi-clathrate hydrates for the systems of Ar/ Kr/ Xe/ CF
4+ TBAB + water
... 1066.3. Kinetics results for CF
4hydrate formation
... 1166.3.1. Initial temperature and pressure, and driving force of growth
... 1166.3.2. Induction time
... 1186.3.3. Gas consumption
... 1216.3.4. Water to hydrate conversion
... 1246.3.5. Storage Capacity (SC)
... 1266.3.6. Rate of hydrate formation
... 1286.3.7. Apparent rate constant (K
app)
... 1306.4. Kinetic results for the semi-clathrate hydrate of Ar + aqueous TBAB solution + SDS
1336.4.1. Effect of initial temperatures and pressures
... 1336.4.2. Effect of SDS
... 1406.4.3. Effect of TBAB
... 1436.5. Application of this study
... 146CHAPTER SEVEN: CONCLUSIONS
... 1527. Conclusions
... 152CHAPTER EIGHT: RECOMMENDATIONS
... 1558. Recommendations
... 155REFERENCES
... 157APPENDIX. A: VPT EoS AND NDD MIXING RULE
... 176APPENDIX B: FUGACITY OF WATER IN THE HYDRATE PHASE
... 180APPENDIX C: FUGACITY OF WATER IN THE EMPTY HYDRATE LATTICE
. 184APPENDIX D: KINETICS MODEL FOR THE SEMICLATHRATE HYDRATES
. 186xiii
LIST OF FIGURES
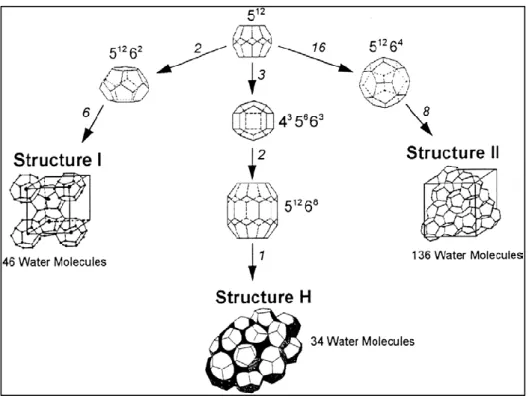
Figure 2-1. Typical gas hydrate structures with the cavity arrangements (Khokhar et al., 1998).
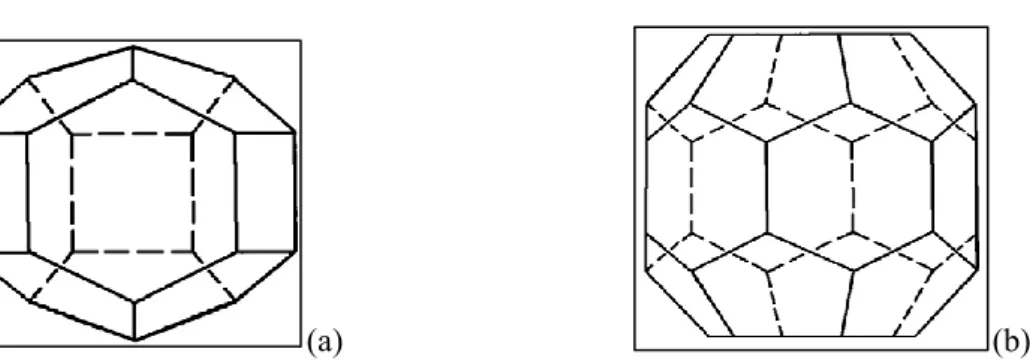
... 9 Figure 2-2. A schematic of the dodecahedron or 512 cavity (a polyhedron with twelve
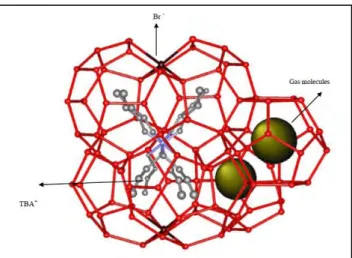
pentagonal faces) (Sloan and Koh, 2008). ... 10 Figure 2-3. A schematic of the tetrakaidecahedron or 51262 cavity (Sloan and Koh, 2008). ... 10 Figure 2-4. Hexakaidecahedron or 51264 cavity (Sloan and Koh, 2008). ... 11 Figure 2-5. (a) Medium cavity (435663) and (b) large cavity (51268) for structure H (Sloan and Koh, 2008). ... 12 Figure 2-6. Comparison between the size of hydrate formers and cage occupancies in different structures (Sloan and Koh, 2008). ... 15 Figure 2-7. A schematic diagram of the xenon separation from the mixture of Ar, Kr, Xe using gas hydrate method (Vorotyntsev and Malyshev, 2011). ... 20 Figure 2-8. A schematic diagram of a typical semi-clathrate hydrate of small gas hydrate former + TBAB +water (Shimada et al., 2005). ... 23 Figure 2-9. A three-dimensional vision of semi- clathrate hydrate of aqueous solution of TBAB with hydration number of 38 (C16H36N+·Br−·38H2O) (Shimada et al., 2005). ... 24 Figure 3-1. K values diagram for predicting methane hydrate equilibrium condition (Sloan and Koh, 2008, Carroll, 2009). ... 26 Figure 3-2. Gas gravity diagram for the predicting natural gas hydrate dissociation conditions (Carroll, 2009). ... 27 Figure 3-3. The algorithm used in this study based on fugacity approach (Li et al., 2008, Abbott et al., 2001) for calculating the hydrate dissociation temperature (Newton- Raphson method (Ben-Israel, 1966) was used in the flash calculations). The weight fraction value was 0.001 in these calculations. ... 30
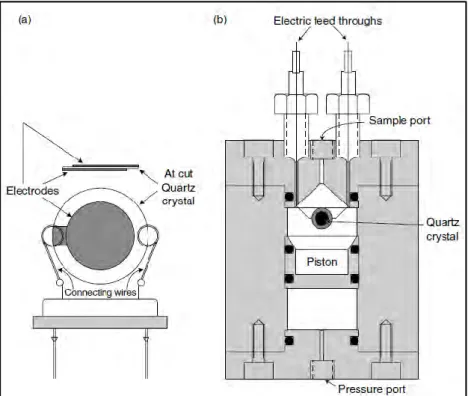
xiv Figure 3-4. A flowchart used for kinetic modelling in this study (Mohammadi et al., 2014). .. 42 Figure 4-1. A diagram of the rocking hydrate equilibrium cell developed by Deaton and Frost in 1937 (Sloan and Koh, 2008). ... 46 Figure 4-2 (a) Quartz crystal microbalance (QCM) apparatus. (b) QCM placed inside a high pressure equilibrium cell (Sloan and Koh, 2008, Mohammadi et al., 2003). ... 47 Figure 4-3. A schematic diagram of Cailletet apparatus. A, autoclave; B, magnets; C, Cailletet tube; D, drain; E, stirring motor; H, hydraulic pump; Hg, mercury; I, inlet tube; L, connection with dead-weight pressure gauge; M, sample of mercury; Ma, manometer; O, outlet thermostat liquid; Or, oil reservoir; P, closing plug; R, O’ rings; S, silicone rubber stopper; T, mercury trap; Th, glass thermostat; V, valve (Sabil, 2009). ... 48 Figure 4-4. A schematic diagram of a high equilibrium cell equipped with two sight glasses/
windows (Javanmardi et al., 2012). ... 49 Figure 4-5. A schematic diagram of high pressure apparatus (Mohammadi et al., 2011). DAU, data acquisition unit; EC, equilibrium cell; G, gas cylinder; LB, liquid bath; LV, loading valve;
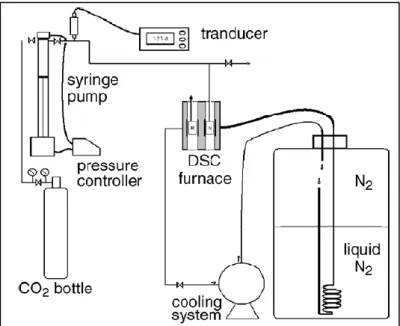
MR, magnetic rod; PP, platinum probe; PT, pressure transducer; SA, stirring assembly; SD, stirring device with variable speed motor; TR, temperature controller. ... 50 Figure 4-6. A schematic diagram of the high-pressure micro Differential Scanning Calorimetry (DSC) device (Marinhas et al., 2006, Deschamps and Dalmazzone, 2010). ... 51 Figure 4-7. Primary cooling and heating curve for formation and dissociation of simple hydrate in the isochoric method (Sloan and Koh, 2008). ... 55 Figure 5-1. A schematic diagram of the apparatus developed in this study. C, cell; CF, cold finger; DAS, data acquisition system; GC, gas cylinder; MJ, mechanical jack; MS, mechanical stirrer; PT, pressure transmitter; TB, thermos-statted bath; TP, temperature probe; TPC,
temperature programmable circulator; VP, vacuum pump; V, valve. ... 59 Figure 5-2. A photograph of the experimental setup. ... 59
xv
Figure 5-3. A schematic of the equilibrium cell. ... 60
Figure 5-4. Exterior view of the equilibrium cell (sizes are in mm). ... 61
Figure 5-5. A photograph of the bottom flange of the equilibrium cell. ... 62
Figure 5-6. Top view of the equilibrium cell. ... 62
Figure 5-7. Top view of the equilibrium cell. ... 63
Figure 5-8. Photograph of the Heidolph motor with the shaft connected to the top flange of the cell. ... 64
Figure 5-9. A schematic diagram of the stirring mechanism. ... 65
Figure 5-10. Photograph of the agitation device (with neodymium magnets). ... 65
Figure 5-11. Calibration of the WIKA pressure transducer (0-16 MPa) used in this study. A first order relation between standard and transducer pressure was achieved. These results were performed in June 2013 and verified in February 2014. ... 69
Figure 5-12. Deviations from the standard pressure due to first order relation with the maximum deviation of ±1.8 kPa. ... 69
Figure 5-13. Calibration of the Pt-100 temperature probe used in this study. A first order relation between standard and used temperature probe was achieved. These results were performed in Jun 2013 and verified on February 2014. ... 70
Figure 5-14. Deviations from the standard temperature due to first order relation, with maximum deviation of ±0.03 K. ... 71
Figure 5-15. Carbon dioxide vapour pressure measurement: ♦, this study; ×, Roebuck et al. (1942) (Roebuck et al., 1942); □, Yucelen and Kidnay (1999) (Yucelen and Kidnay, 1999); ∆, Yarym-Agaev (1999) (Yarym-Agaev, 1999); ... 72
Figure 5-16. An example of the primary cooling and heating curve for the semi-clathrate hydrate of argon and 0.20 mass fraction of TBAB aqueous solution. ... 74
xvi Figure 5-17. Change in the temperature during hydrate formation and dissociation for the semi- clathrate hydrate of xenon and 0.20 mass fraction of TBAB aqueous solution. ... 75 Figure 5-18. Change in the pressure during hydrate formation and dissociation for the semi- clathrate hydrate of xenon and 0.20 mass fraction of TBAB aqueous solution. ... 75 Figure 6-1. Experimental hydrate dissociation conditions for the carbon dioxide + water system. The symbols represent the experimental data: ■, this work; ○, (Frost and Deaton, 1946); □, (Ng and Robinson, 1985); ∆, (Adisasmito et al., 1991); ×, (Mohammadi et al., 2005).
... 84 Figure 6-2. Semi-clathrate hydrate phase diagram for the system of TBAB + H2O at the
pressure of 0.1 MPa. The symbols represent the experimental data: ●, This work; ∆, (Oyama et al., 2005) (with the hydration number of 26); +, (Oyama et al., 2005) (with the hydration number of 38); □, (Lipkowski et al., 2002); ○, (Deschamps and Dalmazzone, 2009); ◊,
(Darbouret et al., 2005), ▬, Trend line for type A, ----, Trend line for type B. ... 86 Figure 6-3. Hydrate dissociation conditions measurements for the system of argon + TBAB + water. Symbols signify experimental data: ●, This work, 0.05 mass fraction aqueous TBAB solution; ▲, This work, 0.10 mass fraction aqueous TBAB solution; ×, This work, 0.20 mass fraction aqueous TBAB solution; ♦, This work, 0.30 mass fraction aqueous TBAB solution; ■, This work, 0 mass fraction of TBAB (argon hydrate); ○, (Marshall et al., 1964), 0 mass fraction of TBAB (argon hydrate). ... 88 Figure 6-4. Hydrate dissociation data for the system krypton + TBAB + water. Symbols represent experimental data. 0.0 mass fraction of TBAB (krypton hydrate): ■, This work, □, (Sugahara et al., 2005), ○, (Dyadin et al., 1997a), ∆, (Holder et al., 1980), ×, (Stackelberg and Meuthen, 1958); 0.05 mass fraction of TBAB: ●, This work; 0.10 mass fraction of TBAB: ♦, This work; 0.20 mass fraction of TBAB: ▲, This work, ... 90 Figure 6-5. Experimental measurements of hydrate dissociation conditions for the system of xenon + TBAB + water. Symbols represent experimental data. 0.0 mass fraction of TBAB (Xe
xvii hydrate): ●, This work, ◊, (Ewing and Ionescu, 1974), +, (Makogon et al., 1996), ×, (Dyadin et al., 1997a), -, (Ohgaki et al., 2000); 0.10 mass fraction of TBAB: ▲, This work, ∆, (Jin et al., 2012); 0.20 mass fraction of TBAB: ■, This work, □, (Jin et al., 2012), ○,(Garcia and Clarke, 2014); 0.30 mass fraction of TBAB: ♦, This work. ... 93 Figure 6-6. Experimental CF4 hydrate dissociation data. Symbols represent experimental data:
▲, This work; ×, (Garg et al., 1975); □, (Sugahara et al., 2004); ○, (Mooijer-van den Heuvel et al., 2006). ... 95 Figure 6-7. Experimental measurements of hydrate dissociation conditions for the system of CF4 + TBAB + water. Symbols represent experimental data. ◊, 0.0 mass fraction of TBAB (CF4
hydrate); ■, 0.05 mass fraction of TBAB; ▲, 0.10 mass fraction of TBAB; ×, 0.20 mass
fraction of TBAB; ●, 0.30 mass fraction of TBAB. ... 96 Figure 6-8. Cooling and heating curve for formation and dissociation of semi-clathrate hydrate of CF4 + 0.30 mass fraction of aqueous TBAB solution. ... 97 Figure 6-9. Plot of Ar hydrate dissociation data and comparison with experimental, literature data and model results. Symbols represent experimental data: ▲, This work; ○, (Marshall et al., 1964); Model results: ●●●●●●●, Approach 1, ▬ ● ▬, Approach 2, ▬, Approach 3. ... 104 Figure 6-10. Plot of Kr hydrate dissociation data and comparison with experimental, literature data and model results. Symbols represent experimental data: ■, This work, □, (Sugahara et al., 2005), ○, (Dyadin et al., 1997b), ∆, (Holder et al., 1980), ×, (Stackelberg and Meuthen, 1958);
Model results: ●●●●●●●, Approach 1, ▬ ● ▬, Approach 2, ▬, Approach 3. ... 105 Figure 6-11. Plot of Xe hydrate dissociation data and comparison with experimental, literature data and model results. Symbols represent experimental data: ●, This work, ◊, (Ewing and Ionescu, 1974), +, (Makogon et al., 1996), ×, (Dyadin et al., 1997a), -, (Ohgaki et al., 2000);
Model results: ●●●●●●●, Approach 1, ▬ ● ▬, Approach 2, ▬, Approach 3. ... 105 Figure 6-12. Plot of CF4 hydrate dissociation data and comparison with experimental, literature data and model results. Symbols represent experimental data: ●, This work; ▲, (Mooijer-van
xviii den Heuvel et al., 2006); □, (Garg et al., 1975), ♦, (Sugahara et al., 2004); Model results:
●●●●●●●, Approach 1, ▬ ● ▬, Approach 2, ▬, Approach 3. ... 106 Figure 6-13. Experimental data and modelling of semi-clathrate hydrate dissociation conditions for the system of Ar + TBAB + water. Symbols represent experimental data: ●, This work, 0.05 mass fraction aqueous TBAB solution; ▲, This work, 0.10 mass fraction aqueous TBAB solution; ×, This work, 0.20 mass fraction aqueous TBAB solution; ♦, This work, 0.30 mass fraction aqueous TBAB; ___, This work, model results. ... 108 Figure 6-14 Experimental data and modelling of semi-clathrate hydrate dissociation conditions for the system of Kr + TBAB + water. Symbols represent experimental data. ●, This work, 0.05 mass fraction aqueous TBAB solution; ♦, This work, 0.10 mass fraction aqueous TBAB
solution; ▲, This work, 0.20 mass fraction aqueous TBAB solution; ___, This work, model results. ... 110 Figure 6-15. Experimental data and modelling of semi-clathrate hydrate dissociation conditions for the system of Xe + TBAB + water. Symbols represent experimental data. 0.10 mass fraction of TBAB: ▲, This work, ∆, (Jin et al., 2012); 0.20 mass fraction of TBAB: ■, This work, □, (Jin et al., 2012), ○, (Garcia and Clarke, 2014); 0.30 mass fraction of TBAB: ♦, This work; ___, model results, This work. ... 112 Figure 6-16. Experimental data and modelling results of semi-clathrate hydrate dissociation conditions for the system of CF4 + TBAB + water at various TBAB concentrations. Symbols represent experimental data. 0.0 mass fraction of TBAB (pure CF4 hydrate): ◊, This work; 0.05 mass fraction of TBAB: ■, This work; 0.10 mass fraction of TBAB: ▲, This work; 0.20 mass fraction of TBAB: ×, This work; 0.30 mass fraction of TBAB: ●, This work; Solid lines, This work, model results. The maximum ∆T between the measured data and the model results is equal 0.1 K. ... 114 Figure 6-17. The driving force or degree of subcooling between the initial pressure conditions (●) and CF4 hydrate equilibrium line (solid line) at a constant temperature of 275.3 K. ... 118
xix Figure 6-18. The pressure of the system during the hydrate formation of CF4 at an initial temperature 275.3 K and pressure of 7.08 MPa. ... 119 Figure 6-19. The pressure of the system during the hydrate formation of CF4 at an initial temperature 275.3 K and initial pressure of ▬♦▬, 7.08 MPa; ▬▲▬, 7.92 MPa; ▬■▬, 9.11 MPa; ▬●▬, 11.83 MPa. ... 120 Figure 6-20. Number of moles of CF4 consumed per mole of water during the hydrate
formation at an initial temperature 275.35 K and initial pressure of 7.08 MPa... 121 Figure 6-21. Number of moles of CF4 consumed per mole of water during the hydrate
formation at an initial temperature 275.35 K and different pressures: ▬♦▬, 7.08 MPa; ▬▲▬, 7.92 MPa; ▬■▬, 9.11 MPa; ▬●▬, 11.83 MPa. ... 122 Figure 6-22. Number of moles of CF4 consumed per mole of water during the hydrate
formation at an initial pressure of 11.47 MPa and two initial temperatures of: ▬▲▬, 276.6 K;
▬●▬, 276.1 K. ... 123 Figure 6-23. Water to hydrate conversion percentage versus time at the initial temperature and pressure conditions of 275.3 K and 7.08 MPa, respectively. ... 124 Figure 6-24. Final moles of CF4 consumed per moles of water at the constant temperature of 275.3 and different initial pressures. ... 125 Figure 6-25. CF4 storage capacity during hydrate formation at an initial temperature 275.35 K and different pressures: ▬♦▬, 7.08 MPa; ▬▲▬, 7.92 MPa; ▬■▬, 9.11 MPa; ▬●▬, 11.83 MPa. ... 126 Figure 6-26. CF4 Storage capacity during hydrate formation at an initial pressure of 11.47 MPa and different temperatures: ▬▲▬, 276.6 K; ▬●▬, 276.1 K. ... 127 Figure 6-27. Rate of CF4 consumption during the hydrate formation at an initial temperature of 275.35 K and different pressures: ▬◊▬, 7.08 MPa; ▬∆▬, 7.92 MPa; ▬○▬, 9.11 MPa;
▬□▬, 11.83 MPa. ... 129
xx Figure 6-28. Rate of CF4 consumption during the hydrate formation at an initial pressure of 11.47 MPa and different temperatures: ---■---, 276.11 K; ▬▲▬, 276.60 K. ... 129 Figure 6-29. The apparent rate constant (Kapp) of CF4 hydrate formation at a temperature of 275.35 K and different pressures: ▬×▬, 7.08 MPa; ▬∆▬, 7.92 MPa; ▬◊▬, 9.11 MPa;
▬○▬, 11.83 MPa, (Kapp values for 11.83 MPa is related to secondary axes (right side axes)).
... 130 Figure 6-30. The effect of initial pressure on the maximum apparent rate constant of CF4
hydrate formation at T=275.36 K. ... 131 Figure 6-31. The effect of initial temperature on the maximum apparent rate constant of CF4
hydrate formation at P=11.47 MPa. ... 131 Figure 6-32. The degree of subcooling between the initial pressure conditions (♦) and the semi- clathrate hydrate of Ar + 0.1 TBAB + 0.9 water equilibrium line (solid line) at a constant temperature of 285 K and initial pressures of 6.1 MPa, 8.1 MPa and 10.1 MPa. ... 134 Figure 6-33. The pressure changes during the semi-clathrate hydrate formation for the system of Ar + 0.1 TBAB + 0.9 waterat an initial temperature of 285 K and different initial pressures:
▬♦▬, 10.1 MPa; ▬▲▬, 8.1 MPa; ▬●▬, 6.1 MPa. ... 135 Figure 6-34. The pressure of the system during the semi-clathrate hydrate formation for the system of Ar + 0.1 TBAB + 0.9 waterat an initial pressure of 8.1 MPa and different
temperatures ▬■▬, 281 K; ▬●▬, 285K, ▬▲▬, 287.5 K. ... 136 Figure 6-35. Number of moles of Ar consumed during the hydrate formation at an initial temperature 285.0 K and different pressures: ▬●▬, 6.1 MPa; ▬♦▬, 8.1 MPa; ▬▲▬, 10.1 MPa. ... 137 Figure 6-36. Number of moles of Ar consumed during the semi-clathrate hydrate formation for the system of Ar + 0.1 TBAB + 0.9 water at an initial pressure of 8.1 MPa and different
temperatures: ▬▲▬, 281.0 K, ▬♦▬, 285.0 K; ▬●▬, 287 K. ... 138
xxi Figure 6-37. Kinetic constant, akf, during the semi-clathrate hydrate formation for the system of Ar + 0.1 TBAB + 0.9 water at an initial pressure of 8.1 MPa and different temperatures:
▬♦▬, 287 K; ▬■▬, 285.0 K. ... 139 Figure 6-38. The effect of initial pressure and temperature on the maximum kinetic constant for the semi-clathrate hydrate formation for the system of Ar + 0.1 TBAB + 0.9 water. ... 140 Figure 6-39. The pressure change during the semi-clathrate hydrate formation for the system of Ar + 0.1 TBAB + 0.9 water+ SDS at an initial temperature of 285 K and different SDS
concentrations: ▬♦▬, 0 ppm SDS; ▬▲▬, 100 ppm SDS; ▬■▬, 200 ppm SDS; ▬●▬, 400 ppm SDS. ... 141 Figure 6-40. The pressure change during the semi-clathrate hydrate formation for the system of Ar + TBAB + waterat an initial temperature of 285 K and pressure of 6.1 MPa and different TBAB concentrations: ▬▲▬, 0.1 mass fraction aqueous TBAB solution; ▬●▬ 0.2 mass fraction aqueous TBAB solution; ▬ + ▬, 0.3 mass fraction aqueous TBAB solution. ... 143 Figure 6-41. Number of moles of Ar consumed during the semi-clathrate hydrate formation for the system of Ar + TBAB + water at the initial conditions of 285.0 K and 6.1 MPa and different TBAB concentrations (mass fraction): ▬▲▬, 0.1 TBAB, ▬●▬, 0.2 TBAB; ▬■▬, 0.3 TBAB. ... 144 Figure 6-42. Rate of Arconsumed during the semi-clathrate hydrate formation for the system of Ar + TBAB + water at an initial conditions of 285.0 K and 6.1 MPa and different TBAB concentrations (mass fraction): ▬○▬, 0.1 TBAB, ▬□▬, 0.2 TBAB; ▬∆▬, 0.3 TBAB. .... 145 Figure 6-43. A schematic diagram of the gas hydrate process for Xe separation from the mixture of Kr, Xe and Ar using a multi-staged crystallizer (Dabrowski et al., 2009). ... 150
xxii
LIST OF TABLES
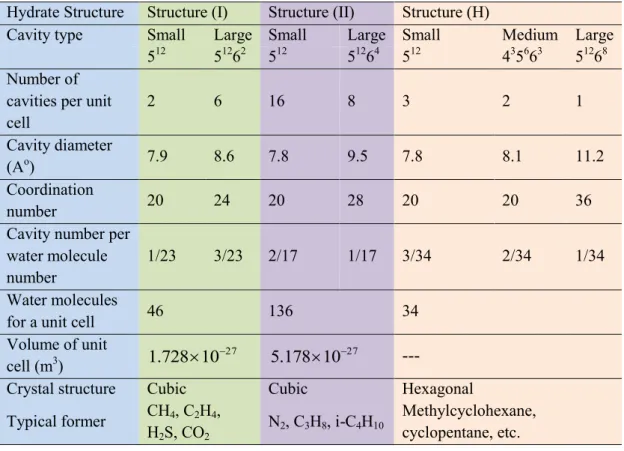
Table 2-1. Molecular characteristics of the different hydrate structures (Sloan and Koh, 2008).
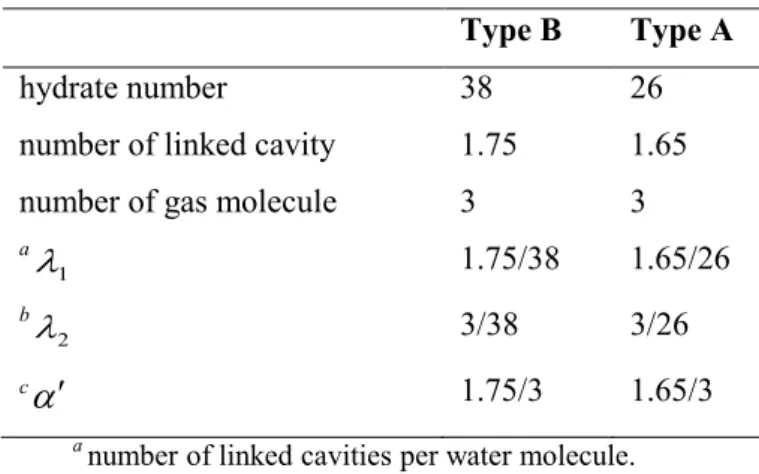
... 12 Table 2-2. Guest molecules as well as their cage occupancies for natural gas hydrates (Sloan and Koh, 2008). ... 13 Table 2-3. The ratio of the molecular diameter to cavity diameter for gas hydrate formers (Sloan and Koh, 2008). ... 14 Table 2-4. The experimental studies for gas hydrate equilibrium conditions of noble gases of Ar/ Kr/ Xe in the presence of pure water and TBAB aqueous solution. ... 21 Table 3-1. The properties of type A and B for a unit cell of TBAB semi-clathrate hydrate (Joshi et al., 2012). ... 37 Table 3-2. Structural parameter β for semi-clathrate of TBAB (Joshi et al., 2012). ... 38 Table 4-1. Three methods of isobaric, isothermal and isochoric for the determination of gas hydrate dissociation conditions (Sloan and Koh, 2008). ... 52 Table 5-1. Details of the purities and the suppliers of the materials used in this study a. ... 57 Table 5-2.Vapour pressure data for CO2. ... 72 Table 5-3. The uncertainties in the pressure and temperature. ... 79 Table 6-1. Hydrate/ semi-clathrate hydrate systems along with temperature and pressure ranges. ... 82 Table 6-2. Experimental CO2 hydrate dissociation conditions. ... 83 Table 6-3. Experimental semi-clathrate hydrate dissociation conditions for the system TBAB + H2O at the pressure of0.1 MPa. ... 85
xxiii Table 6-4. Experimental hydrate dissociation conditions for the system of argon + TBAB + water. ... 89 Table 6-5. Experimental hydrate dissociation conditions for the system of krypton + water + TBAB. ... 91 Table 6-6. Experimental hydrate dissociation conditions for the system of xenon + aqueous solutions of TBAB. ... 94 Table 6-7. Experimental hydrate dissociation conditions for the system of CF4 + TBAB + water. ... 98 Table 6-8. The optimal binary interaction parameters between water (i) and guest molecule (j) for the VPT-EoS and NDD mixing rules. ... 100 Table 6-9. *Kihara potential parameters for Ar, Kr, Xe and CF4 hydrates. ... 101 Table 6-10. Antoine constants for calculating af 0(T) in the Chen and Guo model. ... 101 Table 6-11. a The parameters of Equation (3-21) for calculation of the Langmuir constant. .. 102 Table 6-12. The parameters for calculation of the Langmuir constant based on the equations of Parrish and Prausnitz* (Parrish and Prausnitz, 1972). ... 102 Table 6-13. Comparisons between three approaches: Approach 1, Approach 2 and approach 3 for modelling of Ar, Kr, Xe, and CF4 simple hydrates. ... 103 Table 6-14. *Constants (k1 and k2) for the water activity calculations in the system of semi- clathrate hydrates of Ar/Kr/Xe or CF4 + aqueous solutions of TBAB. ... 107 Table 6-15. Experimental and calculated semi-clathrate hydrate dissociation conditions for the system of Ar + aqueous TBAB solution. ... 109 Table 6-16. Experimental and calculated hydrate dissociation conditions for the system of Kr + aqueous TBAB solutions. ... 111 Table 6-17. Experimental and calculated semi-clathrate hydrate dissociation conditions for the system of Xe + TBAB aqueous solution. ... 113
xxiv Table 6-18. Experimental and calculated semi-clathrate hydrate dissociation conditions for the system CF4 + aqueous TBAB solutions. ... 115 Table 6-19. Investigated initial temperatures and pressures of CF4 hydrate formation. ... 117 Table 6-20. The values of Induction time at different initial temperatures and pressures for CF4
hydrate formation... 120 Table 6-21. Final moles of CF4 consumed per moles of water at different initial temperatures and pressures conditions. ... 123 Table 6-22. Final moles of CF4 consumed per moles of water at different initial temperatures and pressures conditions. ... 125 Table 6-23. The final storage capacity at different initial temperatures and pressures conditions.
... 127 Table 6-24. The maximum apparent rate constant of CF4 hydrate formation at different initial temperatures and pressures conditions. ... 132 Table 6-25. The values of induction time, final mole of Ar consumed and maximum kinetic constant at different initial temperatures and pressures for the semi-clathrate hydrate formation of Ar + 0.1 TBAB + 0.9 water. ... 134 Table 6-26. The values of induction time , at different SDS concentrations and initial pressures for the semi-clathrate hydrate formation for the system of Ar + 0.1 TBAB + 0.9 water. ... 142 Table 6-27. The values of induction time and final moles of gas consumed for the semi-
clathrate hydrate of Ar + TBAB + water at an initial temperature of 285.0 K and pressure of 6.1 MPa and different TBAB concentrations. ... 144 Table 6-28. Hydrate dissociation pressure for the system of Ar/ Kr/ or Xe + 0.2 mass fraction of aqueous TBAB solutions at 293.6 K. ... 149
xxv
NOMENCLATURE
Symbol Description Units
aw Activity of water --
A, B, C Antoine constants Pa, K, K (respectively) aij Cross parameters for the terms am Pa. (m3/mol)2
am EOS parameter for the mixture Pa. (m3/mol)2 bij Cross parameters for the terms bm m3 / mol bm EOS parameter for the mixture m3 / mol
C Langmuir constant Pa-1
f Fugacity Pa
k
app apparent rate constant mol / (min. Pa) kij and lij Binary interaction parameters for NDDmixing rule --
Lw The liquid phase --
LH Liquid phase containing mainly
hydrocarbons --
M hydration number --
N Number of experimental data --
n Number of moles mol
w0
n
Initial number of moles of water in theliquid phase mol
OF Objective function --
P Pressure Pa
r Radial coordinate m
R Universal gas constant m3.Pa / (mol.K)
r (t) Rate at time equal t mol / min
s Structure of gas hydrate --
T Temperature K
t Time s
Ht
V
Volume of the hydrate at time = t m3V
cell Cell volume m3RWt
V
Volume of reacted water m3S0
V Initial volume m3
v
i
Number of cavities of type I per watermolecule in a unit hydrate --
v Partial molar volume m3 / mol
x Mole fraction in liquid phase --
X, Y, Z Langmuir parameters Pa-1, K, K (respectively)
y Mole fraction in vapour phase --
Z Compressibility factor --
xxvi
Greek symbol
Symbol Description Units
Δ Change in a property --
Chemical potential J / mol
Activity coefficient --1 Number of linked cavities per water molecule and
--
2 Number of gas hydrate former per water molecule
--
Fugacity coefficient --sol.
H
Enthalpy of solution
J / mol Cpw
Specific heat capacity differences J / (mol. K)
H
K Henry’s constant at T0 = 298.15 Pa
Cage occupancy --
Number of linked cavities per number of gas molecules.--
EOS temperature dependent parameter --
Acentric factor --
r Spherically symmetric cell potential in the cavity
J / mol
v
Molar volume m3 / molki Number of groups of kind k in molecule i --
Collision diameter m
Depth of energy well J / mol
xxvii
Superscripts
Symbol Description Exp Experimental Cal Calculated
g Gas phase
H Hydrate phase L Liquid water phase MT Empty hydrate sat Saturation
v Vapour phase
β Empty hydrate phase
α Ice phase
Infinite dilution conditionSubscripts
Symbol Description
Equib. Equilibrium condition
I Ice
i,j Component
l Large cavity
m Cavity type m
s Small cavity
w Water
xxviii
ABBREVIATIONS
Symbol Description
AAD Average Absolute Deviation
AE Absolut Error
Ar Argon
CB Cyclobutane
CF Cold finger
CF4 Tetrafluoromethane
CH Cyclohexane
CO Cyclooctane
CP Cyclopentane
CHP Cycloheptane
DAS Data acquisition system EC Equilibrium cell EOS Equation of state
GC Gas chromatograph
GH Gas hydrate
HBGS Hydrate Base Gas Separation H-Lw-V Hydrate – liquid water –vapour
IT Induction time
Kr Krypton
LB Liquid bath
LV Loading valve MCH Methylcyclohexane MCP Methylcyclopentane
MJ Mechanical jack
MR Magnetic rod
MS Mechanical stirrer
NDD Non-Density-Dependent (NDD) mixing rules PP Platinum probe
PR Peng-Robinson
PT Pressure transducer
QAS quaternary ammonium salts QCM Quartz Crystal Microbalance QS Quaternary salts
xxix PCM Phase change material
SC Storage Capacity SD Stirring device
SDS Sodium dodecyl sulfate sI structures I
sII structures II
sH structure H
STS Sodium tetradecyl sulfate
STP Standard temperature and pressure TBAB Tetra-n-butylammonium bromide TBAC Tetra-n-butylammonium chloride TBAF Tetra-n-butylammonium fluoride TBPB Tetra-n-phosphonium bromide THF Tetrahydrofuran
TR Temperature controller
V Valve
VLE Vapour-liquid equilibrium
VPT EoS Valderrama modification of Patel–Teja Equation of State vdWP van der Waals and Platteeuw
Xe Xenon
1
1
CHAPTER ONE: INTRODUCTION
1. Introduction
Noble or inert gases such as argon, krypton and xenon, have a diverse range of applications in industries such as gas laser, space exploration, welding, metallurgy, quartz lamps and fluoroscopic examinations of the brain. Krypton and xenon have high atomic weights which promote their use in the applications of multi-pane windows and light bulbs with longer suitable operating life (Vorotyntsev and Malyshev, 2011). Liquid xenon has been reported to be used in the detection of particles and astroparticle physics (Abe et al., 2009, Bernabei et al., 1998, Collaboration et al., 2008), and in the reduction of the γ and β rays emitted from uranium (U) and thorium (Th) pollutants by self-shielding. The short lived radioactive isotopes of liquid xenon can be used in rare phenomena experiments such as double beta decay searches and dark matter experiments (Abe et al., 2009).
The separation of xenon from a mixture of xenon, krypton and argon is an important industrial problem. Current technologies for separating these gases consist of cryogenic distillation (Abe et al., 2009), zeolite adsorbent (Alagappan, 2013), methal-organic framework (MOF) (Sikora et al., 2012, Liu et al., 2012) and membranes (Ohno et al., 1977). A mixture of xenon and krypton can be separated to a ratio of 80 / 20 (molar basis) of krypton to xenon via cryogenic distillation of air (Ryan and Hills, 2012). With using additional cryogenic distillation steps, greater purification of krypton and xenon would be achieved. Due to gas liquefaction in the cryogenic distillation process, a large amount of energy is consumed during the gas separation with this method. Separation of the noble gases can be performed using selective adsorbents such as zeolites at conditions close to room temperature (Alagappan, 2013). Zeolites are suitable for these applications because these adsorbents are selective of xenon over krypton.
2 Furthermore zeolites can eliminate the radioactive krypton 85 from the xenon rich phase.
Methal-Organic Framework (MOF) is another method for the separation of noble gases mixtures (Sikora et al., 2012, Liu et al., 2012). MOFs can selectivity adsorb xenon from a mixture of xenon, krypton and argon. Due to the small pore volume of MOFs, such materials can acommodate one Xe atom per one pore. It is reported that the capacity of such materials is 20 percent of the total pore volume in achieving the separation of Xe from a mixture of noble gases (Ryan and Hills, 2012).
In a comparison of the separation methods mentioned above for the purification and separation of noble gases, cryogenic distillation is a costly and energy intensive process owing to the required low temperature for gas liquefaction and other separation methods such as membranes and adsorbents have not been proven to be economical (Hnatow M.A. and Happel, 1995). Hence the purification and separation of noble gas mixtures remains a challenge with researchers investigating alternate separation techniques. One of the newest methods for gas separation is the use of gas/clathrate hydrates which has captured the attentions of scientists in recent decades (Vorotyntsev and Malyshev, 2011). Since gas and water molecules can form gas hydrates at room temperature conditions, the gas hydrate method has lower cost in comparison to the cryogenic distillation which is based on gas liquefaction at very low temperatures. One of the other advantages of the gas/ clathrate hydrate method is its simplicity because gas hydrate can form and dissociate easily with cooling and heating of the system (Eslamimanesh et al., 2012b).
The major problems in the implementation of gas hydrate technology for applications in gas industries are their slow formation rate and the high pressure dissociation conditions (Ilani-Kashkouli et al., 2013). In gas hydrate formation processes, one of the usual ways to moderate the gas hydrate equilibrium conditions is using gas hydrate promoters such as Quaternary Ammonium Salts (QAS). QAS such as tetra-n-butyl ammonium bromide (TBAB) produce semi-clathrate hydrates and can moderate the hydrate formation and dissociation conditions. The addition of salt to the aqueous solution enables a shift in the P-T diagrams to lower pressures and higher temperatures conditions. The properties of the hydrate promoters as well as semi-clathrate hydrate structures will be discussed in later chapters.
Prior to the design of a hydrate based gas separation process it is essential to be aware of the dissociation conditions of the pure constituents of the considered mixture. Consequently, the main objective of this study is to provide the hydrate phase equilibrium of noble gases such as Xe, Ar and Kr. To study the effect of TBAB on the hydrate phase equilibrium, the experiments were performed in the presence of pure water and TBAB aqueous solution with
CHAPTER 1……….… INTRODUCTION
3 different concentrations. It has been proved that the highest stabilization effect of TBAB is at the stoichiometric concentrations of 0.40 mass fraction (Lee et al., 2010). For this purpose, in this dissertation, gas hydrate dissociation experimental data for the systems of argon / xenon/
krypton + aqueous TBAB solutions were measured below the stoichiometric TBAB concentration with a TBAB range of 0 to 0.30 mass fraction (0, 0.05, 0.10, 0.20 and 0.30 mass fraction).The other aim for the selection of this range of TBAB concentration was to develop a comprehensive thermodynamic model for the system of of argon / xenon/ krypton + aqueous TBAB solutions.
In addition to the work focused on noble gases, the separation of carbon tetrafluoride (CF4) and nitrogen trifluoride (NF3) is of considerable significance in the electronic industries.
Nitrogen trifluoride (NF3) is used in the electronics industries as a dry etchant through plasma assisted etching of silicon wafers, or through the plasma cleaning of chemical vapour deposition chambers (Branken et al., 2014). With the contamination of NF3 with CF4, it is crucial to remove CF4 from NF3. The high purity of NF3 in electronic manufacturing industry desires in which the impurity content (CF4 content in the mixture of NF3 + CF4) must not exceed 20 ppm. The chemical and physical properties of NF3 and CF4 are quite similar which makes it difficult to separate these gases (Branken et al., 2014). As the difference in boiling point of NF3 (-129 oC) and CF4 (-127.8 oC) is too small, the separation of these gases using cryogenic distillation needs a large number of theoretical trays which makes it financially not feasible (Branken et al., 2014). Another method for purification of NF3 and removal of CF4 is using zeolite adsorbents which selectively adsorbs NF3 as the major component (because of the zeolite pore volume). As mentioned earlier, adsorbents can adsorb approximately 20% of their pore volumes. As a result, for the adsorption of the main component (NF3) in the mixture of NF3 and CF4, a large amount of zeolite is needed (Branken et al., 2014). According to Branken et al., (Branken et al., 2014) amorphous glassy perfluoro polymer Teflon AF and Hyflon AD60 membranes are suitable adsorbents for separation of NF3 and CF4 in which the CF4 content would be near 11 ppm. The gas hydrate method is an alternative technique/technology which can be applied for the separation of NF3 and CF4. Prior to the design of a hydrate based gas separation process, it is essential to be aware of the exact information of the CF4 hydrate formation/ decompositions temperature and pressure and the kinetics of CF4 hydrate formation.
For this purpose in this study, the experimental measurements on the phase equilibria of CF4
hydrate in the presence of pure water and aqueous solution of TBAB were performed.
Furthermore, the effect of initial temperature and initial pressure on the rate of CF4 hydrate formation was studied.
4 In this thesis, the gas hydrate concept is introduced in chapter 2 which includes a history of research performed to date on gas hydrates. In addition, the molecular structures of gas hydrates, the application of gas hydrates in industries, gas hydrate promoters and the structure and properties of semi- clathrate hydrate are explained.
In chapter three, the theory of the thermodynamic methods for modelling of the gas hydrate and semi- clathrate hydrate dissociation conditions is discussed. In addition, a kinetic model to investigate the gas hydrate rates and the related parameter such as the apparent rate constant of reaction, converting water into hydrate, gas consuming and storage capacity are presented.
In chapter four, the experimental method for measuring gas hydrate dissociation conditions consisting of the visual isobaric temperature search method, visual isothermal pressure search and isochoric pressure search method is explained.
In chapter five, the experimental setup and procedure developed in this study which was based on the isochoric pressure search method is explained. In addition the calibration results and the vapour pressure measurements for testing the reliability of the used experimental method is presented.
The experimental and model results are reported in chapter six and are categorised in three sections:
1. Experimental measurements of hydrate dissociation conditions for the system of Ar + water + TBAB (0 to 30 wt %), Xe + water + TBAB (0 to 30 wt %), Kr + water + TBAB (0 to 20 wt %) and CF4 + water + TBAB (0 to 30 wt %).
2. Representation of a thermodynamic model of the hydrate phase equilibria for the system of Ar + water + TBAB (0 to 30 wt %), Xe + water + TBAB (0 to 30 wt %), Kr + water + TBAB (0 to 20 wt %) and CF4 + water + TBAB (0 to 30 wt %).
3. Kinetic behaviour of CF4 hydrate and the semi-clathrate hydrate for the system of Ar + TBAB + water.
The results obtained in this study showed that TBAB aqueous solutions with 0.05 to 0.30 mass fractions has a drastic promotion effect on the argon and krypton hydrate and shift the three
CHAPTER 1……….… INTRODUCTION
5 phase equilibrium curve to higher temperatures and lower pressures conditions. The results show that the effect of TBAB on the xenon hydrate is influenced by the pressure conditions. So that, a 0.1 mass fraction of TBAB aqueous solution has a promoting effect on the xenon hydrate dissociation conditions at pressures lower than 0.73 MPa. In addition, 0.2 and 0.3 mass fraction of TBAB has a promoting effect on the xenon hydrate at pressures lower than 1.4 MPa and 1.57 MPa, respectively. The results for the effect of TBAB aqueous solution on the CF4 hydrate showed that 0 to 0.20 mass fraction of TBAB aqueous solution has no promotion effect on the CF4 hydrate. However, the aqueous TBAB solution with 0.30 mass fraction showed a significant promotion effect on the CF4 hydrate formation.
A good agreement between the experimental measurements in this study and those reported in the literature as well as the model results for all investigated systems were observed.
In the kinetic study, the effects of initial pressure and initial temperature on the kinetics of CF4
hydrate formation were investigated. The results demonstrated that the induction time of hydrate formation decreases with an increase in the initial pressure. However, other kinetics parameters such as the rate of CF4 hydrate formation, the apparent rate constant, storage capacity, and ratio of water to hydrate conversion increase. The decrease in the initial temperature shows a similar behaviour on the kinetics of CF4 hydrate formation. The results obtained in this study reveals the promoting effect of aqueous TBAB solution on the aforementioned gas hydrates as well as a kinetic study on the CF4 hydrate formation which will be helpful in the application of the gas hydrate in the separation.
The effect of the initial temperature, initial pressure, concentration of aqueous TBAB solution, and concentration of SDS on the kinetics of the semi-clathrate hydrate of Ar + aqueous TBAB solutions was determined experimentally in chapter six. A kinetic model based on the work of Tajima et al. (2010) was used to calculate the rate of hydrate formation and the number of gas consumed during the hydrate formation (Tajima et al., 2010). The results indicate that with an increase in the initial pressure, the induction time decreases significantly however the kinetic constant and moles of Ar consumed during the semi-clathrate hydrate formation increases. The same trends were detected with a decrease in the initial temperature.
In addition, with an increase in the TBAB concentration from 0.1 to 0.3 mass fraction TBAB, the rate of semi-clathrate hydrate formation and consumption of Ar during the hydrate formation increases however the induction time decreases, significantly. The results show the positive kinetic and thermodynamic effect of TBAB on Ar hydrate which makes TBAB as a reliable promoter to decrease the pressure of argon hydrate formation and increase the rate of argon hydrate formation. The results for the addition of SDS (in the concentration of 100, 200,
6 400 ppm) indicated that SDS increases the induction time of the semi-clathrate hydrate formation for the system of Ar + TBAB + water.
7
2
CHAPTER TWO: GAS HYDRATES
2. Gas hydrate
Gas hydrates or clathrate hydrates, are known as non-stoichiometric crystals of water and guest molecules with an appropriate molecular diameter recognised as hydrate formers. In these structures, guest molecules can be trapped inside the cavities of water molecules which are formed by hydrogen bonds at suitable temperature and pressure conditions. The favourable conditions for the formation of gas/clathrate hydrates are high pressures and low temperatures (Sloan and Koh, 2008). Different well-known structures of clathrate hydrates include structures I (sI), structures II (sII), and structure H (sH). Typical hydrate formers include methane, ethane, propane, and carbon dioxide. It has been discovered lately that the use of heavy hydrocarbons with a help gas (a small sized gas like hydrogen and nitrogen) can form gas hydrates of structure H (Sloan and Koh, 2008).
The appearance of ice and clathrate hydrates are hardly distinguishable. Nevertheless, at the microscopic level, the structure of ice and clathrate hydrates are different from each other. Ice has a normal hexagonal structure while nonstoichiometric clathrate hydrates are compounds with complicated structures. These microscopic differences lead to differences in the behaviour and properties of ice and clathrate hydrates. Previously, in order to identify clathrate hydrate from ice, polarized light was used. Unlike clathrate hydrates which do not have any effect on the polarized light, the effect of ice is clear (Sloan and Koh, 2008).
2.1. Historical background
Sir Humphery Davy in 1810 observed that dissolved chlorine gas in cold water at a temperature of 9° C formed a solid ice-like structure; this led to the discovery of chlorine hydrates (Sloan
8 and Koh, 2008). In 18